Brent ($103.63) and WTI ($90.87) Fade From 5% Spike as Nine Tanker Attacks Hit Hormuz — $108.23 Breakout
Crude is caught between strike threats on Iran and a loosening physical market | That's TradingNEWS
Key Points
- Brent trades at $103.63, up 3.42%, after touching $105.91; WTI is at $90.87, up 2.93%.
- Hurricane Isaias has shut in 500,000 bpd, 25% of US Gulf of Mexico oil production.
- US crude stocks fell 3.2M barrels to 424.1M in the week to Oct. 2, against a forecast 1.7M build.
Brent crude for December delivery traded at $103.63 a barrel at 12:18 p.m. ET on Thursday, October 8, up $3.43 or 3.42% from Wednesday's $100.20 settlement. West Texas Intermediate was at $90.87, up $2.59 or 2.93% from $88.28. Both benchmarks had been higher. Brent reached $105.91 and WTI $93.20 within the first two hours of New York trading, gains of 5.7% and 5.6%, before giving back more than $2 each.
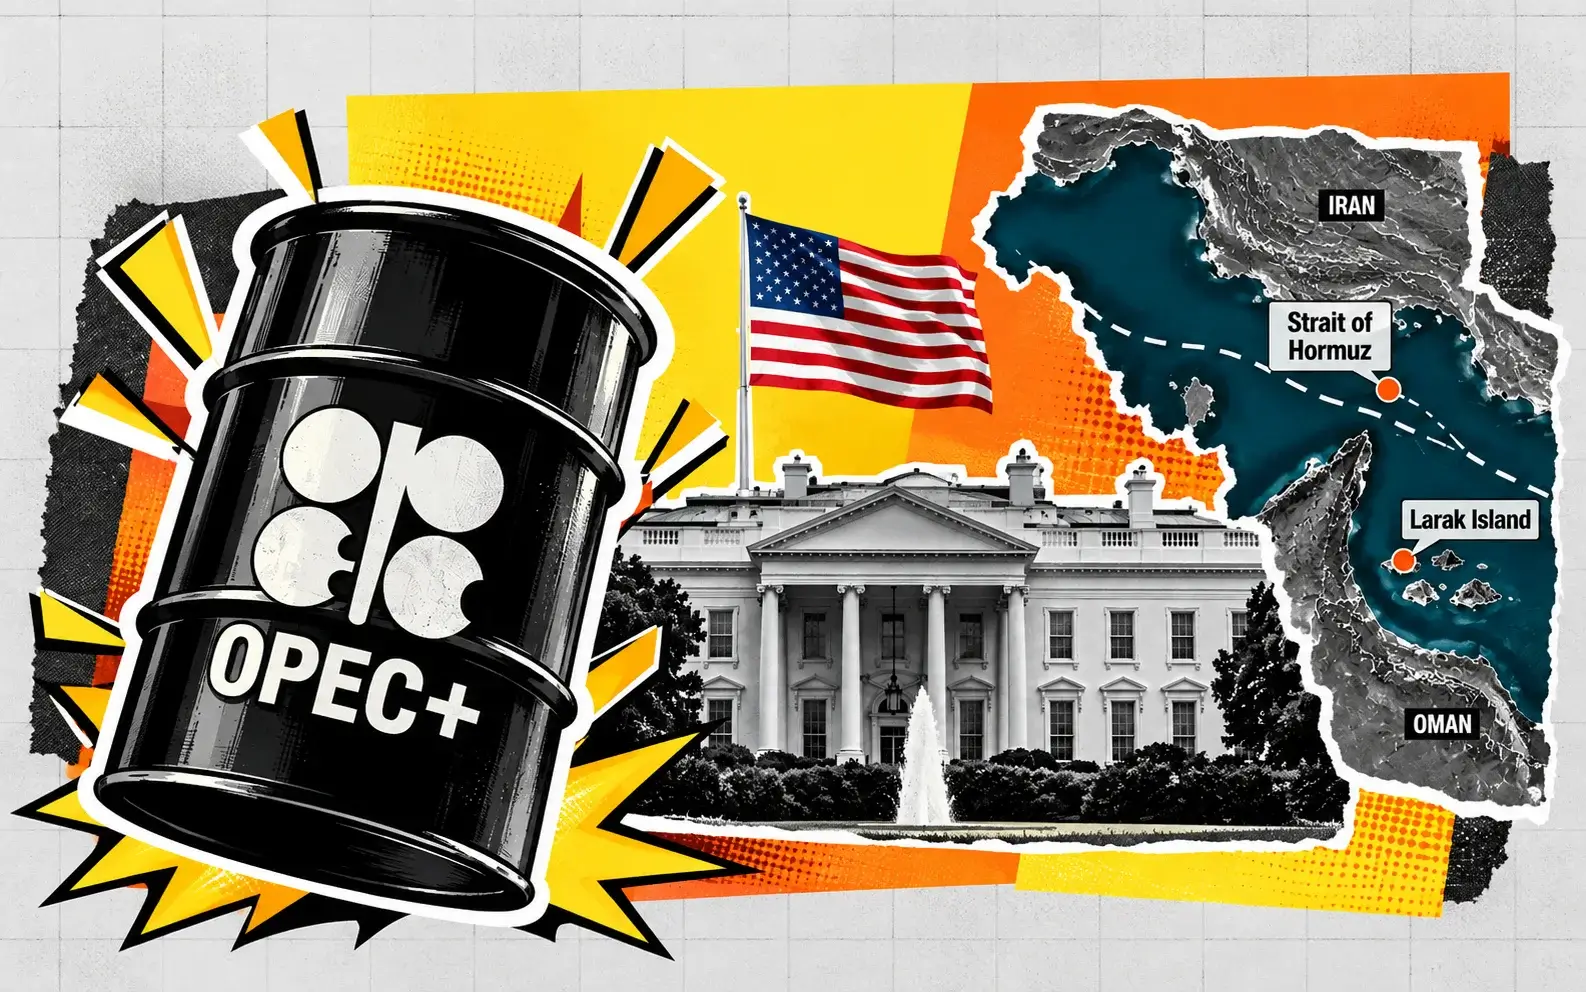
Three supply shocks arrived overnight. President Trump said he does not want a deal with Iran, and reports followed that the US military is preparing for a possible resumption of large-scale strikes. Nine tankers have come under attack in and around the Strait of Hormuz over the past week, the most of any week since the war began on February 28. And Hurricane Isaias forced operators to shut in 500,000 barrels a day, 25% of US Gulf of Mexico production, as it moved toward the coasts of Alabama, Mississippi and the Florida panhandle.
The scale of the reaction and the speed of the fade both carry information. A 5% jump on strike headlines shows how little spare cushion the market believes it has. A $2 retreat by midday shows that physical barrels are more available than the headlines suggest. Saudi Arabia cut its official selling price to Asia to a six-year low this week. Total crude flows out of the Middle East, counting pipeline routes that bypass Hormuz, are close to prewar levels. The International Energy Agency agreed on Wednesday to accelerate the release of 100 million barrels from emergency stocks.
Brent is 56% above its price of a year ago, $66.47, and 6% below the September 11 high of $109.97. The 52-week range is $58.72 to $126.41. WTI's range is $54.98 to $117.63, and it trades 14% under its September 16 peak of $105.63. Over the past month Brent has averaged $101.82 and WTI $94.24.
The spread between the two benchmarks is $12.76. That is wide by historical standards and reflects where the risk sits: in seaborne barrels that must transit the Gulf, far more than in landlocked US supply. It also explains why WTI's rally has been the weaker of the two all week, and why a hurricane in the Gulf of Mexico moved it less than a rally speech in San Antonio.
A Week Between $97 and $106: How the Range Formed
Crude has spent October oscillating around $100 Brent with large daily swings in both directions. The month opened with a 4.37% jump on October 1, taking Brent from $98.03 to $102.31 and WTI up 2.71% to $92.87, on reports of attacks on Saudi energy infrastructure. October 2 was volatile and flat: Brent ranged from $98.40 to $103.04 and settled at $102.25, while WTI fell 1.90% to $91.11.
Monday, October 5, brought the selloff. Saudi Aramco had cut its November prices for Asian buyers over the weekend, a sign that Gulf producers were competing for market share as exports recovered, and major producers left output targets unchanged. Brent dropped 1.89% to $100.32 and WTI 1.84% to $89.43. On Tuesday both benchmarks made their lows for the month so far, with Brent touching $97.06 and WTI $86.86, before closing almost unchanged at $100.58 and $89.44. The long lower shadows on those daily candles formed hammer patterns at support.
Wednesday was choppy. Prices rose early on Houthi attacks and a larger-than-expected draw in US crude inventories, then reversed when the International Energy Agency announced it would speed up emergency stock releases and prioritize diesel. Brent settled down 38 cents at $100.20 after trading between $99.61 and $102.59. WTI fell $1.16, or 1.3%, to $88.28.
Thursday's move began in Asian hours. Brent opened at $101.06, dipped to $100.79 and was at $102.29 early in the Asian session. By the European morning it had cleared $105. WTI opened at $89.02, held a low of $88.78 and reached $92.52 by 7:18 a.m. ET. At 11:25 a.m. ET Brent was at $105.50, up 5.29%, and WTI at $92.86, up 5.19%. The session highs of $105.91 and $93.20 came shortly after.
The pattern across September was more violent. Brent rose 8.64% on September 24 and fell 7.30% on September 25. It dropped 7.35% on September 21. WTI lost 5.72% on September 18. Daily moves of 5% or more have occurred seven times in Brent over the past 23 sessions. A market that swings that widely on each headline is pricing binary outcomes, a strike or a deal, and repricing the odds every day.
Thursday's highs stopped short of the levels that would mark a breakout. Brent did not reach the September 24 peak of $108.23, and WTI stalled below its October 1 high of $93.68.
Washington: "Not Really Something That I Want to Do"
The catalyst was political. Speaking at a campaign rally with Republican candidates in San Antonio late Wednesday, Trump said: "I think the deal isn't really something that I want to do, but they're willing to offer us anything to stop." He added that his special envoy to the Middle East was "doing very well" in the talks, which continue indirectly.
Reports the same day said Trump and his national security team have discussed resuming large-scale military operations against Iran in the coming weeks. One account described the options as including "massive bombing" of Iranian energy, infrastructure and nuclear targets. Another said the Pentagon has directed US Central Command to prepare for a possible resumption of major combat operations. Several noted that the timing would fall before the November midterm elections.
For oil, the distinction between targets matters. Strikes on nuclear facilities raise the geopolitical temperature without removing barrels. Strikes on Iranian energy infrastructure, export terminals or refineries take supply offline directly, and they invite retaliation against the same kind of assets in neighboring Gulf states. The mention of energy targets in the reported options is what moved crude 5% instead of 2%.
The cost of the campaign to date is visible in a Congressional Research Service update dated October 5. It lists 81 US military aircraft as lost or damaged since Operation Epic Fury began, up from 42 in May. The revision added jets damaged in a September Iranian strike on a base in Jordan, helicopter losses and a sharply higher count of Reaper drones. The report notes that some damaged aircraft may have returned to service. The trend still shows a conflict that has been escalating through the autumn.
Markets have learned how quickly this can reverse. Earlier this year, when Trump postponed strikes on Iranian power and energy infrastructure for five days and described conversations with Tehran as "productive," oil futures fell 10% to 11% in a single session. In June, WTI dropped below $80 for the first time in nearly four months on hopes of a framework deal. Traders who chase a strike headline risk being caught by the next statement.
That history is part of why Thursday's rally faded. The president said in the same breath that he does not want a deal and that Iran is offering "anything to stop." Positioning for war on the basis of a rally speech, with an envoy still negotiating, has been a losing trade more than once in 2026.
The risk premium is real and warranted. Its size on any given day depends on rhetoric, and rhetoric has been an unreliable guide.
Hormuz: Nine Tanker Attacks in a Week, Flows 30% Below Prewar
The physical threat is in the strait. Nine tankers have come under attack in and around the Strait of Hormuz over the past week, according to ship-tracking data, the highest weekly count since the war began. The increase comes as Gulf producers have been raising exports, which puts more vessels and more crew in harm's way at higher insurance cost.
Some 9.5 million barrels a day of crude exited through Hormuz in the week ended Tuesday. That is 30% below the level that moved through the strait before the conflict, which implies a prewar baseline near 13.6 million barrels a day. Before the war the waterway carried shipments equal to 20% of global oil and fuel consumption.
The broader picture is less dire than the strait alone suggests. Total crude flows from the Middle East, including pipeline workarounds, stood at 16.4 million barrels a day, nearly equivalent to prewar levels. Saudi Arabia has rerouted exports through its East-West pipeline to Yanbu on the Red Sea, which earlier in the war was handling 4.6 million barrels a day, close to capacity. The United Arab Emirates ships from Fujairah, outside the strait. Those routes have restored most of the lost volume.
That recovery is what the tanker attacks jeopardize. The pipelines are running near their limits, so any further loss of Hormuz transit cannot be offset by rerouting. And the Red Sea route has its own vulnerability: Houthi forces attacked Saudi airports and energy infrastructure this week, and a brief scare over the East-West pipeline lifted Brent above $103 on Monday before prices settled.
Gulf members of the producer alliance have been exporting at 60% to 80% of normal levels in recent months, a range that describes how unstable the recovery has been. When transit improves, storage tanks that filled during the closure are drawn down and a wave of crude reaches the market, which is what pressured prices in early October. When attacks pick up, shipowners pause and the flow drops.
The freight market shows the stress. Tanker operators are trading at 52-week highs, with day rates and war-risk premiums climbing. That cost is embedded in the delivered price of every Gulf barrel and is one reason Brent holds a $12.76 premium over WTI.
One energy strategist told clients on Thursday that the situation "warrants a sticky risk premium" in pricing. The data supports that. Flows have recovered far enough that the market is no longer short of crude in aggregate. They have not recovered far enough, or securely enough, that a bad week in the strait can be absorbed without a price response.
Hurricane Isaias: 500,000 Barrels a Day Offline in the Gulf of Mexico
The second supply shock is domestic and temporary. Hurricane Isaias is moving toward the coasts of Alabama, Mississippi and the Florida panhandle, and offshore operators have evacuated platforms and curtailed output. As of Wednesday, 25.08% of crude production in the US Gulf of Mexico was shut in, along with 16.37% of natural gas output. That is 500,000 barrels a day of oil. Shell and Chevron were among the producers that halted operations.
The Gulf of Mexico accounts for 15% of US crude production, and its infrastructure includes offshore platforms, subsea pipelines, coastal terminals and a large share of the country's refining capacity along the Texas and Louisiana coasts. A storm tracking east of that refining belt, toward Alabama and Florida, is less damaging to fuel supply than one hitting Houston or Lake Charles. The current path limits the risk to production more than to refining.
Hurricane shut-ins follow a familiar course. Operators evacuate ahead of the storm, output drops for several days, crews return once conditions are safe and production is restored within a week unless facilities are damaged. A five-day outage at 500,000 barrels a day removes 2.5 million barrels, a modest amount against US commercial inventories of 424.1 million. The market treats the event as a short-term factor unless damage assessments say otherwise.
Timing is what gives the storm more weight than usual. The shut-ins coincide with a week in which US crude stocks fell 3.2 million barrels against expectations for a build, exports ran at 4.77 million barrels a day and the Strategic Petroleum Reserve sits at 283.8 million barrels, its lowest level since October 1982. There is less buffer than in past hurricane seasons, and less government capacity to fill a gap.
WTI's response has been proportionate. The contract rose 5% at the highs, in line with Brent, and has since underperformed. If the storm were the main driver, WTI would be leading and the spread to Brent would be narrowing. It has widened instead, from $11.92 at Wednesday's settlement to $12.76.
Natural gas showed a similar pattern. Futures were quoted at $3.28 per million British thermal units early Thursday, up 4.79%, and had fallen back to $3.12 by midday, down 2.75%. A shut-in of 16.37% of Gulf gas output would normally support prices, but the same storm reduces demand by knocking out power and cooling load along its path.
The next data point is the damage report once Isaias makes landfall. A clean pass means production returns within days and this leg of support disappears. Structural damage to platforms or pipelines would extend the outage and matter more to WTI than anything happening in the Gulf.
EIA: Crude Stocks Fall 3.2 Million Barrels Against a Forecast Build
The weekly petroleum data published Wednesday gave the bulls a number to work with. US commercial crude inventories fell 3.186 million barrels to 424.1 million in the week ended October 2. Forecasts had called for a build of 1.7 million to 1.9 million barrels. The prior week had shown an increase of 0.9 million to 427.3 million. Industry data released a day earlier had pointed the same way, with a draw of 2.09 million barrels.
Products were less supportive. Gasoline stocks rose 0.4 million barrels to 204.7 million, where a 1.7 million barrel draw had been expected. Distillate inventories, which include diesel and heating oil, were little changed at 105.1 million barrels, down 42,000, against expectations for a 2.1 million barrel decline. Stocks at the Cushing, Oklahoma, delivery hub for WTI rose 444,000 barrels.
Refiners are running hard. Crude runs increased by 223,000 barrels a day and utilization rose 0.2 percentage points to 92.7%. Net crude imports fell 53,000 barrels a day, and exports climbed to 4.77 million barrels a day. Total commercial petroleum inventories declined 6.9 million barrels, so the draw extended beyond crude.
The export figure is the one that ties the US report to the global story. With Brent at a $12 premium, American barrels are attractive to refiners in Europe and Asia who cannot rely on Gulf supply. The US is exporting close to 5 million barrels a day of crude while drawing its own stocks. That arbitrage is how the tightness in seaborne markets is transmitted to domestic inventories.
Crude stocks themselves are not low. Two weeks earlier they stood 1% to 2% above the five-year average for the time of year. The draw supports a tighter near-term balance without establishing a shortage. The shortage is in middle distillates. Distillate inventories are 13% to 14% below their five-year average nationally, and on the East Coast they were 32% below the seasonal norm in September. The EIA expects regional stocks to stay 20% to 30% below average through the winter.
Wednesday's market reaction showed the hierarchy of drivers. The draw was bullish on its face, and WTI still settled down 1.3% because the IEA's stock-release announcement outweighed it. Inventory data is setting the floor under prices this month. Policy and geopolitics are setting the direction.
Next week's report will capture the first effects of the hurricane: lower Gulf production, possible disruption to imports and exports through coastal terminals, and any change in refinery runs. A second consecutive crude draw of 3 million barrels or more would take stocks toward 420 million and tighten the comparison with the five-year average.
Diesel Is the Crisis: IEA Accelerates Stock Releases
The acute shortage in this market is in refined fuel. US retail diesel set a record of $6.5276 a gallon on September 22 and was $6.34 on October 4 after governments intervened. Wars in Iran and Ukraine have damaged refineries and disrupted product tanker traffic. Diesel exports from Russia, the Middle East and Asia were running 1.3 million barrels a day lower than a year earlier as of August, a loss equal to 20% of global seaborne trade in the fuel.
The International Energy Agency responded on Wednesday. Its member governments agreed to accelerate the oil stock releases announced under the collective action of March 2026 "with a view to completing them as soon as possible," and to prioritize diesel "to the extent possible, given the current tightness in diesel markets." The agency said completing previously announced releases could bring 100 million barrels to market.
That followed a G7 agreement on October 2 to release 100 million barrels of crude and diesel through the IEA. The March action, the largest coordinated release in the agency's history, made 400 million barrels available. Member governments still hold public emergency stocks equivalent to 1.1 billion barrels, including more than 200 million barrels of diesel.
France moved first on the product side. Its prime minister said the country will release 10 million barrels of diesel from strategic reserves, supplied to distributors, which could lower pump prices by 12 to 18 euro cents a liter. Europe is where the squeeze is tightest, because the continent depended on Russian and Middle Eastern diesel imports that have been curtailed by two wars at once.
The market's assessment of the announcement was measured. Brent fell 38 cents on the day. Several observers and some governments noted that the 100 million barrels are part of the original 400 million barrel plan and do not represent a new draw on reserves. Faster delivery of pledged barrels helps prompt supply. It does not add to the total.
There is also a limit to how long reserves can substitute for production. The US Strategic Petroleum Reserve is at its lowest level in 44 years. Each release reduces the cushion available if the conflict escalates, and markets price that depletion. The head of the International Monetary Fund said this week that high oil prices could continue into 2027, citing elevated transport costs and disrupted energy supplies.
For crude prices, the diesel shortage works through refining margins. Wide crack spreads give refiners every incentive to run flat out, which is why US utilization is at 92.7% in what is normally maintenance season. High runs draw crude inventories. Stock releases that target diesel relieve the product squeeze and, at the margin, reduce the pull on crude.
OPEC+ Holds Targets as Saudi Arabia Cuts Asian Prices to a Six-Year Low
The producer group is a bystander to its own market. Seven core members of OPEC+, Saudi Arabia, Russia, Iraq, Kuwait, Kazakhstan, Algeria and Oman, met virtually on October 4 and decided to maintain September's required production levels for November. Their next meeting is on November 1. The broader alliance still has 2 million barrels a day of cuts in place covering most members through the end of 2026.
Those targets have been largely theoretical this year. When the Strait of Hormuz closed to most traffic in late February, Gulf producers could not ship what they pumped, storage filled, and output had to be cut. Total OPEC+ production fell from 42.77 million barrels a day in February to 33.13 million in May, a loss of 9.6 million barrels a day and the largest supply disruption on record. The group raised quotas in a series of 188,000 barrel a day steps through the summer, increases that existed on paper while physical exports were constrained.
The alliance also lost a member. The United Arab Emirates left OPEC after almost 60 years and raised output to near-record levels above 3.8 million barrels a day by June, free of production caps and with an export route through Fujairah outside the strait.
The more telling signal this week came from pricing. Saudi Aramco lowered the November official selling price of Arab Light to Asia to $5 a barrel below the regional benchmark, a six-year low, from a $2 discount for October. Heavier grades were cut by the same amount. In the first weeks of the war, when Hormuz traffic collapsed, the same price was set at a record premium of $19.50.
A swing from a $19.50 premium to a $5 discount describes a market that has gone from scarcity to competition. Gulf producers are racing for market share as exports recover, cutting prices to win back refiners who turned to US, Brazilian and West African crude during the closure. That is the behavior of sellers with barrels to place.
It sits awkwardly beside a $105 Brent print. Futures are pricing the risk that supply will be cut off. Physical differentials are pricing the fact that, for now, it is arriving. When the two diverge, the physical market tends to be right about the present and the futures market about the tail. Monday's 1.9% drop in Brent came on the Saudi price cut. Thursday's 5% spike came on the threat of strikes. Both were rational.
Read More
-
Yen Stalls at 160 Despite a 3% JGB and Tokyo Core CPI at 2.0% — Intervention Sits at 164, Friday's Payrolls Decide
02.09.2026 · TradingNEWS ArchiveEnergy
-
COCO Bounces From Oversold as Short Interest Hits 10.9% of Float — Hold Into Q3, With $59.82 the Level to Reclaim
08.10.2026 · TradingNEWS ArchiveStocks
-
XRP-USD ($1.35) Slides 18.7% From September High as 3 Supports Fail — $1.27 Demand Zone Is Next, Bulls Must Reclaim $1.45
08.10.2026 · TradingNEWS ArchiveCrypto
-
Gold ($4,112) Real Yields Near 2.91% Cap Bullion — Bears Eye $4K, Bulls Need a Close Above $4,2K
08.10.2026 · TradingNEWS ArchiveCommodities
-
S&P 500 Slips Below 7,800, Nasdaq −0.56%, Dow Under 51,000 on $105 Oil and 5.35% Yields; HAE +13.41%
08.10.2026 · TradingNEWS ArchiveMarkets
-
Sterling Stuck Between 1.3180 and 1.3287 as Gilt Selloff Tests UK Fiscal Credibility — BoE Hike in Play for Nov. 5
08.10.2026 · TradingNEWS ArchiveForex
The implication for the forecast is that Brent's floor depends on what happens in the strait, and its ceiling on what happens in Washington. Absent a new disruption, discounted Gulf crude and accelerating stock releases pull prices back toward the high $90s. A strike on energy infrastructure sends them through $110.
The $12.76 Brent-WTI Spread and What It Says About Where Risk Sits
The gap between the two benchmarks has become a market signal in its own right. Brent's premium over WTI was $11.92 at Wednesday's settlement and widened to $12.76 on Thursday. At the session highs it was $12.71. Before the war the spread typically ran between $3 and $5.
Three things hold it open. The first is geography. Brent prices waterborne crude that competes directly with Middle Eastern grades and must be shipped through contested sea lanes. WTI prices crude delivered by pipeline to Cushing, Oklahoma, a thousand miles from any coast. War risk attaches to the first and not the second.
The second is freight. Moving a barrel from the US Gulf Coast to Europe or Asia requires a tanker, and tanker rates are at multi-year highs. The spread has to be wide enough to cover that cost before exports become profitable. With day rates and insurance elevated, the breakeven spread is several dollars higher than it was a year ago.
The third is capacity. US export terminals are operating near their limits. Crude exports reached 4.77 million barrels a day in the latest week. When the infrastructure that connects WTI to the world market is full, additional overseas demand cannot pull more barrels out, and the domestic price detaches from the global one.
For US producers the spread is a cost. They receive the lower price while the global market signals for more supply. For US refiners it is a windfall. They buy crude priced off WTI and sell products priced off global markets where diesel is at record levels. That margin is behind the 92.7% utilization rate and the performance of refining stocks this year.
The spread also explains the pattern of this week's moves. On days when the news is about Hormuz or Iran, Brent leads and the gap widens. On days when the news is about US inventories or hurricanes, WTI should lead and the gap should narrow. Thursday had both, and the gap widened, which says the market weighted the strike risk more heavily than the storm.
Watch the spread for confirmation of any breakout. A move in Brent above $107.50 accompanied by a spread widening toward $14 would indicate the market is pricing a real loss of Gulf supply. A Brent rally with the spread narrowing would suggest the driver is domestic and temporary. If the spread compresses back toward $10, it would mean either that Gulf flows are normalizing or that US supply has tightened, and the weekly inventory data would show which.
Cushing stocks rose 444,000 barrels in the latest week, a sign that crude is backing up at the hub even as national inventories fall. That is consistent with full export channels and a spread that stays wide.
Macro: Oil Is Driving Yields, the Dollar and the Fed
Crude is setting the tone for every other market. When Brent jumped to $105 on Thursday morning, the 10-year Treasury yield rose to 5.35%, its highest since 2002, and the 30-year reached 5.70%. As oil eased toward $103.63 by midday, the 10-year fell back to 5.26%. Bond traders are treating each dollar on the oil price as an input to the inflation outlook, and the link has been close to mechanical this week.
The Federal Reserve is part of the chain. The minutes of its September meeting showed all 19 officials supported raising the policy rate to 3.75% to 4.00%, and most expected another increase by year-end. Futures put the odds of a hike in December at 70%. A Fed governor said on Thursday that more hikes may be needed. With diesel at records and headline energy inflation rising, the central bank has little room to look through an oil shock.
Higher rates feed back into oil demand. Tighter financial conditions slow industrial activity, freight and construction, the sectors that consume diesel. US product demand has been running below year-ago levels. The European Central Bank's chief economist said this week that costlier energy and higher borrowing costs are already slowing demand in the euro area, where energy inflation hit 18.8% in September.
That is the demand destruction that eventually caps a price spike. At $105 Brent and $6-plus diesel, consumption adjusts. Airlines cut marginal routes, truckers consolidate loads, and consumers drive less. The process is slow, and it works. It is one reason the September high of $109.97 has held for four weeks despite repeated tests.
The dollar adds a second brake. The dollar index is at 102.40, near an 18-month high. Crude is priced in dollars, so a stronger currency raises the cost for buyers in Europe, India and Japan beyond the move in the benchmark itself. India's central bank raised rates this week, citing crude above $100, and the rupee is under pressure. Emerging-market demand is the most price-sensitive in the world.
Equities are absorbing the shock unevenly. The S&P 500 fell 0.38% and the Nasdaq 0.56% by late morning, with the Russell 2000 down 0.96%. Energy was the only sector with gains. The pattern of oil up, bonds down and stocks down is the stagflation trade, and it has reappeared each time Brent has pushed above $105 since the war began.
The data calendar matters for crude through this channel. September CPI on October 14 will show how much of the fuel price increase reached consumers. A hot reading raises rate expectations and weighs on demand forecasts.
Energy Equities: Refiners and Tankers at Highs, With a Valuation Warning
Stocks tied to oil were the only large group to rise on Thursday. Marathon Petroleum gained between 4.2% and 5.2% through the morning, trading at $460.92 to $465.26 and above its prior 52-week high of $444.99. Valero Energy rose 4.11% to $441.53. APA climbed as much as 4.94% to $45.98. BP's US shares added 4.03% to $46.31. In the first hour the Energy Select Sector SPDR was up 2.42% and the exploration and production ETF 1.94%.
Refiners are the clearest beneficiaries of this market's structure. They buy crude priced off a discounted WTI and sell diesel into a global shortage. Marathon Petroleum is up 136% over twelve months and trades at 15 times trailing earnings. The record diesel price and the 32% deficit in East Coast distillate stocks describe the margin environment better than the crude price does.
There was a note of caution inside the group. Delek US, Par Pacific and Phillips 66 were downgraded to neutral on valuation this week, even as price targets across the refining sector were raised 40% on average to reflect wider and longer-lasting crack spreads. The argument is that higher earnings are already in the shares. Marathon Petroleum making a new high on the same day suggests buyers disagree for now.
Tanker owners are the purest play on the Hormuz risk. Okeanis Eco Tankers rose 5.51% to $92.89, Frontline 4.17% to $55.27, DHT Holdings 3.88% to $24.63 and Hafnia 3.53% to $10.69. Three of the four set new 52-week highs. They trade at 7.7 to 8.0 times trailing earnings, multiples that imply the market expects day rates to fall once the conflict eases. Until it does, each week of attacks in the strait raises the rates they earn.
Integrated producers lagged the specialists. ExxonMobil is pursuing exploration offshore Trinidad and Tobago to extend its Guyana success, and Chevron has been restructuring its Bakken position to reduce debt. Their upstream earnings benefit from higher prices, but US output sells at the lower WTI benchmark, and their size limits the percentage move.
Energy's weight in the S&P 500 is small, so a 4% day in the sector does little for the index. Nvidia's 0.56% decline on Thursday erased more market value than the entire energy sector added.
The equities offer a read on how long the market expects this to last. Refiners at record highs and tankers at single-digit multiples tell two different stories: one of durable margins, one of temporary windfall. Third-quarter results later this month will show how much of the crack-spread surge reached the bottom line.
Technical Map: WTI Resistance at $93.35 and $94.50, Brent at $107.50 and $110
Both benchmarks bounced from support this week and are testing the middle of their ranges. For WTI the base is the $86.86 to $87.00 zone. That area contains Tuesday's low, the level that capped an advance in mid-August, the lower boundary of an uptrend channel in place since July, and the 38.2% Fibonacci retracement of the rally from early July. The hammer candle that formed there on October 6 held through Wednesday's low of $87.96.
Below $86.86, the lower Bollinger Band sits at $85.58 and the 100-day moving average at $84.35. A sustained close under those levels would open a deeper correction toward $82 to $84 and then $80.
WTI's upside is layered. Thursday's high of $93.20 stopped just short of the middle Bollinger Band at $93.35 and the October 1 high of $93.68. A zone of resistance runs from $93.10 to $95, and the specific level of $94.50 marked the top of a corrective rally at the end of September. Beyond that are the September 24 high at $96.78, then $99.14, the upper Bollinger Band at $101.10 and $102.50. One projection holds that a decisive break above $93 targets $106. The 50-day exponential average is near $90, where price is trading now.
A screen of 22 technical indicators on the daily WTI chart showed 12 sell signals against 8 buys early Thursday, a reading downgraded from neutral on Tuesday. On the four-hour chart the contract has posted lower highs and lower lows since the September peak. The trend from $105.63 is down until $94.50 breaks.
Brent's picture is firmer. The benchmark held $97.06 on Tuesday and $98.71 on a shorter-term chart, and it has now cleared $103.89, which had been the key breakout level on the two-hour chart. Daily support levels are at $102.58 and $101.39. The relative strength index is above its midline.
Resistance for Brent starts at $105.65 to $105.72, where Thursday's rally stalled at $105.91. Above that, $107.50 and the September 24 high of $108.23 form the next barrier, followed by $110 and the September 11 peak at $109.97. A close above $110 would be a new high for the autumn and would put the 52-week high of $126.41 back on the chart.
Volume supports the move. Brent traded 328,084 contracts by midday, on pace to exceed Wednesday's 325,010.
A weekly range based on current volatility puts WTI between $82.28 and $99.00. That $17 band describes the uncertainty.
Verdict: Bullish While Brent Holds $100, With the Next Move Decided in Washington
Crude at $103.63 Brent and $90.87 WTI is carrying a risk premium that is justified by events and vulnerable to words. The supply threats are concrete: nine tanker attacks in a week, Hormuz flows 30% below prewar, 500,000 barrels a day shut in by a hurricane, US crude stocks down 3.2 million barrels and a Strategic Petroleum Reserve at a 44-year low. The offsets are concrete too: Saudi prices cut to a six-year low, total Middle East flows near prewar levels, 100 million barrels of emergency stocks being released faster, and demand slowing under record fuel prices and 5% Treasury yields.
The near-term call is bullish with a defined floor. While Brent holds above $100 and WTI above $88, the path of least resistance is a retest of Thursday's highs at $105.91 and $93.20. Through those, Brent targets $107.50 and $108.23, and WTI $94.50 and $96.78. A confirmed US strike on Iranian energy targets would take Brent through $110 quickly and bring $115 to $126 into view.
The bull case has a clear failure point. Thursday's rally faded $2 from the highs within an hour, and the 10-year yield fell 9 basis points with it. If Brent closes back below $101.39, the spike will have been another headline move that the physical market rejected. In that case the range lows at $97.06 Brent and $86.86 WTI come back into play, declines of 6% and 4% from current prices. A diplomatic breakthrough would break those floors: oil fell 10% to 11% in one session on such news earlier this year.
For positioning, Brent is the better expression of the geopolitical risk and WTI the weaker one, as the $12.76 spread shows. Long positions make more sense on pullbacks toward $101 to $102 Brent than at $105, given how reliably spikes have been sold. Refiners and tanker owners offer exposure to the same tightness with earnings support, though both groups are at highs and one set of valuation downgrades has already appeared.
The balance of risk over the next two weeks favors higher prices. The reported strike planning has a political deadline in early November. The hurricane's damage is unknown. The producer group has no spare supply it can deliver through a contested strait. And diesel stocks are too low heading into winter for the product market to loosen.
Over a three-month horizon the picture is more two-sided. Gulf producers are discounting to move barrels, reserves are being drawn, and demand is eroding. If the strait stays open and no strike comes, Brent drifts back toward the mid-$90s.
Four markers decide the next leg: the landfall and damage report from Isaias, next Wednesday's inventory data, the CPI release on October 14, and any statement from the White House on Iran.