Brent ($107) and WTI ($96) Surge as Iran Talks Collapse — $103 September High in Reach With Diesel at a Record $6.52
Saudi crude output collapsed to 6.24M barrels per day in August | That's TradingNEWS
Key Points
- WTI crude jumps 4.24% to $96.33 after the White House rejects Iran's Hormuz reopening plan.
- Saudi Arabia's crude output collapsed to 6.24 million barrels per day in August 2026.
- US distillate stocks sit 12% below their five-year average as diesel hits a record $6.52.
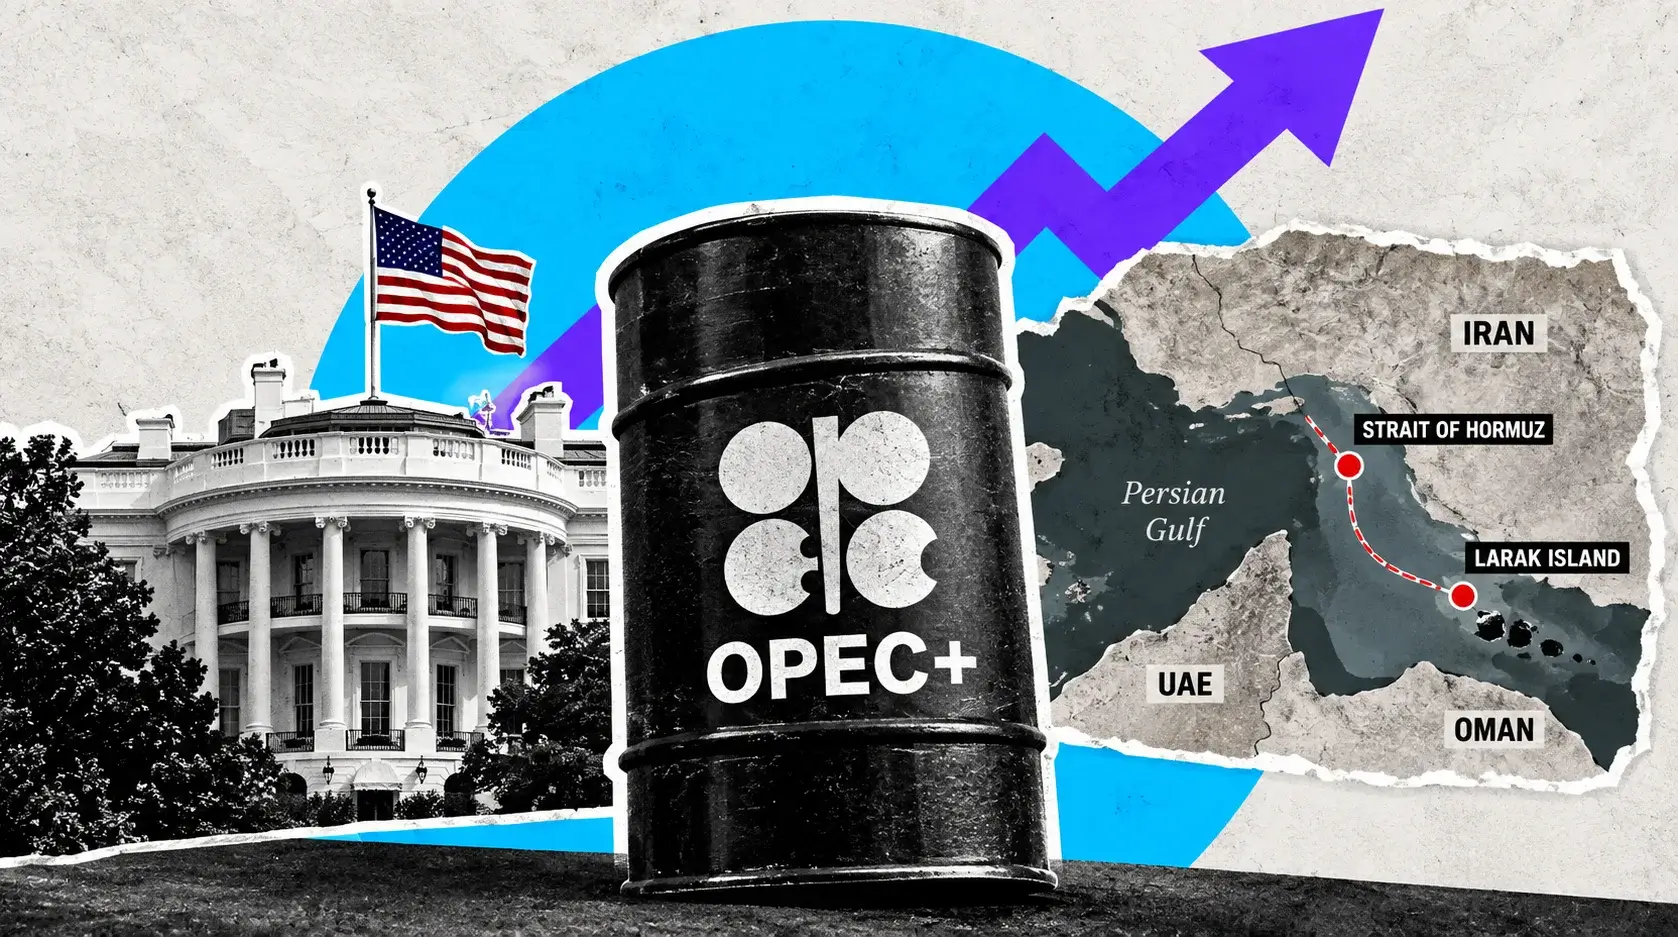
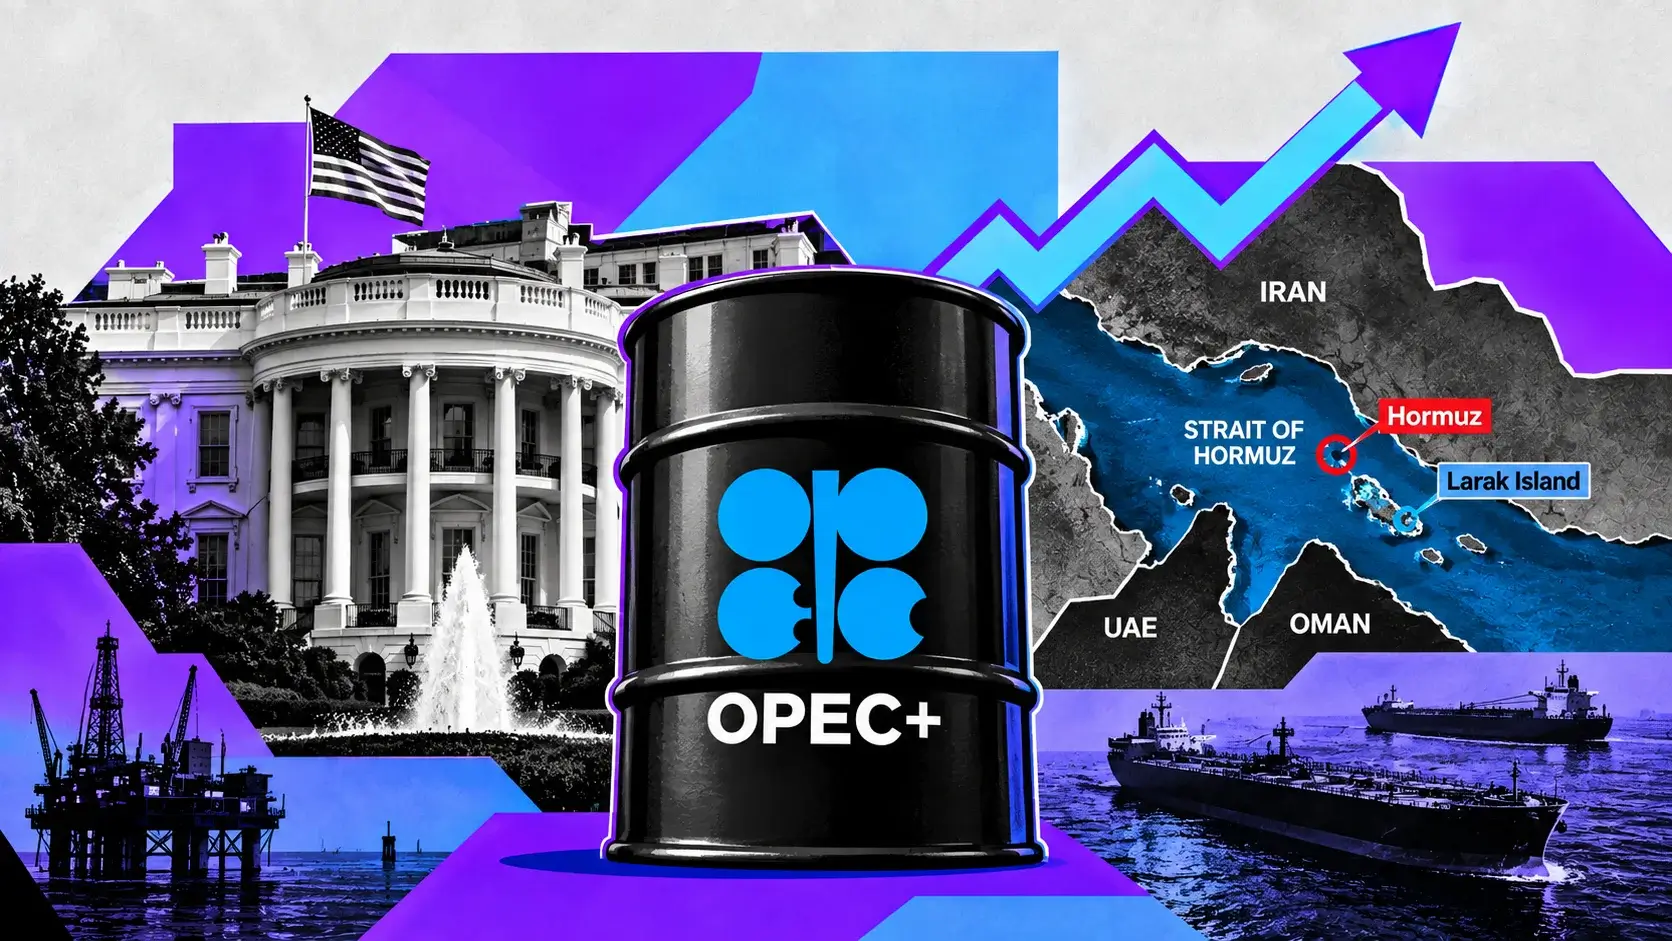
Crude oil opened the final week of September with its sharpest one-day gain in weeks. November WTI futures trade at $96.33 a barrel, up $3.92 or 4.24% from Friday's settlement of $92.41. November Brent traded 2.7% higher at $107.11 after climbing as high as $108.83 earlier in the session. The move erased Friday's entire decline and then some. On Friday, WTI had dropped 2.33% and Brent had fallen 2.14% to $104.32 on hopes that a US-Iran agreement could reopen the Strait of Hormuz.
Those hopes died over the weekend. President Trump rejected Iran's conditional proposal, a seven-day framework to reopen the strait and end the war. Tehran's conditions included the release of frozen Iranian funds, the lifting of oil sanctions and an end to the US naval blockade of Iranian ports. Trump said Iran had overplayed its hand and that its conditions were ones Washington might have accepted a year ago. Iran responded that it will not ease its conditions and is waiting for a definitive US answer. Trump said negotiations would resume this week.
The price moves frame the market. Brent has risen 18.12% over the past month and sits 59.32% above its level a year ago. WTI has gained 9.72% in a month and 48.30% year over year. Brent is up more than 70% since the start of 2026 and on track for its third straight monthly gain. The Brent-WTI spread stands at $10.78, reflecting how much tighter the seaborne market outside the United States has become.
The thesis for this forecast: the oil market is pricing a physical supply shock that diplomacy has not resolved, and the physical data backs the price. Saudi crude output collapsed to 6.24 million barrels per day in August. Both of Saudi Arabia's routes around Hormuz, the East-West pipeline to the Red Sea and the Bab el-Mandeb shipping lane, have come under attack. US distillate stocks sit 12% below their five-year average, and diesel prices hit a record $6.52 per gallon last week. Monday's rally is not a speculative spike; it is the market re-pricing a disruption that Friday's optimism had discounted too early.
The swing factor is the negotiating table. A credible reopening framework would send Brent back below $100 within days. Continued stalemate keeps $100 WTI in play.
From $70.69 to $107: The Eight-Month Path of the Hormuz Oil Shock
To forecast where crude goes next, start with how it got here. Oil ended January 2026 near its highest level since August 2025, with Brent at $70.69 and WTI at $65.21, as uncertainty over Iran built. In February, prices chopped in a narrow range as the United States and Iran agreed to talks. Brent finished February 5 at $67.55 and February 12 at $67.52 after the International Energy Agency forecast lower demand. By February 19, supply fears lifted Brent to $71.66, a six-month high.
Then the war began. The United States and Israel launched strikes on Iran in late February, and the Strait of Hormuz closed on February 28. Brent finished March 3 at $81.49, the highest since January 2025. WTI closed March 4 at $74.66. Within weeks, crude surged to a four-year high near $120 a barrel. WTI's 52-week range shows the scale of the move, stretching from a low of $54.98 to a peak of $117.63.
The shock cut off the world's most important oil route. Before the war, the Strait of Hormuz carried one-fifth of global crude oil and liquefied natural gas. The closure blocked exports from OPEC+ members Saudi Arabia, the United Arab Emirates, Kuwait and Iraq. In April, eight OPEC+ members agreed to raise May output quotas by 206,000 barrels per day, a move that amounted to less than 2% of the disrupted supply. Key members could not raise production because their oil could not reach market.
The summer brought partial relief and fresh escalation. Brent traded at $91.47 on July 21. By August 28, it sat at $90.55. In late July and August, US and Iranian forces exchanged fire, and each round sent crude higher. By mid-September, the escalation spread to Saudi infrastructure, and Brent spiked to $108.68 with WTI at $103.45. Murban crude, the Abu Dhabi benchmark, hit $122.
Last week brought the sharpest pullback of the month. Iranian officials floated a plan to reopen Hormuz within seven days if Washington lifted its naval blockade. Brent tumbled below $100 and WTI lost 3.79% on the week to $92.44. The market priced a deal. Monday's rejection has now priced it back out.
The pattern over eight months is consistent: every diplomatic opening sends crude lower, every breakdown sends it higher, and the physical disruption underneath has never been resolved. Brent's floor has risen with each cycle, from $67 in February to $90 in August to $104 last Friday.
Saudi Arabia's Two Escape Routes Under Fire: Output Collapses to 6.24 Million Barrels Per Day
The most important supply development of September came from Saudi Arabia, and it explains why Brent refuses to fall back to the $80s. With Hormuz closed, Saudi Arabia has relied on two alternative routes to move crude to market. The first is the East-West pipeline, a 745-mile line that carries oil from the eastern fields to the Red Sea port of Yanbu. The second is the Red Sea shipping lane, which runs south through the Bab el-Mandeb Strait. Both have come under attack.
The pipeline took direct hits. An earlier strike on a pumping station along the East-West line cut throughput by 700,000 barrels per day. On September 12, Saudi Arabia closed the pipeline entirely after it was struck by drones launched from Iraq. Satellite imagery and fire-detection data later raised questions about whether the Houthi movement had hit the line again southeast of Medina, though no independent confirmation that the pipeline itself was struck has emerged.
The shipping lane is under pressure from the south. Houthi forces captured Perim, an island in the middle of the Bab el-Mandeb Strait that serves as the gateway linking the Red Sea to the Gulf of Aden and the trade routes between Europe and Asia. Control of Perim gives the Houthis a direct threat to tankers leaving Yanbu for Asian markets.
The result has been a collapse in Saudi output. According to OPEC data reported by the kingdom, Saudi crude production fell to 6.24 million barrels per day in August 2026. Saudi Arabia pumped 9.90 million barrels per day in October 2019, after recovering from the attacks on its Abqaiq facility. The kingdom is producing well below two-thirds of that level.
The attacks continued over the weekend. Saudi Arabia intercepted Houthi drones heading toward Riyadh and a missile targeting Khamis Mushait in the south. Alerts were issued in Abha and Jazan, where Aramco operates energy facilities. In August, a fire broke out at a refinery in Jazan following Houthi strikes.
Saudi officials have described damage across the system. An energy ministry official said strikes targeted infrastructure for oil and gas production, transport and refining, as well as petrochemical plants and power facilities in Riyadh, the Eastern Province and Yanbu.
For the forecast, the Saudi supply picture is the anchor. Even if Hormuz reopened tomorrow, damaged pipelines, pumping stations and refineries take months to restore. OPEC+ warned in April that restoring damaged energy assets to full capacity is costly and slow. That repair timeline puts a floor under Brent that diplomacy alone cannot remove.
The Hormuz Negotiations: A Seven-Day Plan Rejected and Talks Set to Resume
The negotiating table is now the single most important price driver in the oil market. Iran's proposal, presented on the sidelines of the United Nations General Assembly, offered to reopen the Strait of Hormuz within seven days if Washington lifted its naval blockade of Iranian ports and scaled back military pressure. The plan resembled the memorandum of understanding from June that failed to end the conflict.
The conditions went beyond the blockade. Tehran also sought the release of frozen Iranian funds and the lifting of oil sanctions. Trump rejected the package, saying Iran had overplayed its hand and that its terms were ones Washington might have accepted a year ago. He did not rule out additional military action before the November midterm elections.
Iran's response was uncompromising. Foreign Minister Abbas Araghchi said Tehran wants to forge peace but is fully prepared for the war to resume. Iran said it will not soften its conditions for reopening the waterway and is waiting for a definitive US response to its seven-day proposal.
Both sides say talks will continue. Trump said negotiations would resume this week. Araghchi and Qatari mediators remain in the United States, with discussions focused on an amended version of the seven-day proposal. Talks through mediators are expected Monday or Tuesday.
Physical flows through the strait remain erratic. Trump said a record amount of oil was taken out of the strait on Saturday night. Iranian media reported that Iranian forces targeted ships using unauthorized routes through the waterway. The strait is not fully closed, but it is not open either; flows depend on which ships Iran allows through and which routes they take.
The market is trading headline to headline. Friday's 2.33% drop in WTI came on reports that Iran had asked the United States to return to the June memorandum. Monday's 4.24% jump came on the rejection. Each diplomatic signal moves crude by $2 to $4 per barrel within hours.
For the forecast, the negotiations create a binary setup. A credible reopening framework with a timeline would remove the geopolitical risk premium quickly, likely sending Brent below $100 and WTI toward $88. A breakdown, or a resumption of military strikes, would push Brent back toward its mid-September high of $108.68 and WTI above $100. The middle ground, talks that drag on without resolution, keeps crude in a volatile range around current levels.
EIA Inventories: A 2.97 Million-Barrel Crude Build, but Distillates Sit 12% Below Normal
US inventory data sends a mixed signal that explains why WTI trades at an $10.78 discount to Brent. For the week ended September 18, the Energy Information Administration reported that commercial crude inventories rose by 2.969 million barrels to 426.4 million barrels, against expectations for a 0.6 million-barrel draw. The build ended three consecutive weekly declines and left crude stocks 2% above their five-year average.
The build was concentrated at the delivery hub. Crude stocks at Cushing, Oklahoma, where WTI futures settle, rose by 2.266 million barrels to 23.7 million barrels. A Cushing build loosens the near end of the WTI futures curve directly, which contributed to last week's price decline.
Refinery activity dropped. Crude runs fell by 519,000 barrels per day, and utilization fell 2.8 percentage points to 94%. That followed 96.8% utilization in the week ending September 11 and 97.8% the week before. Lower refinery demand for crude explains part of the inventory build. Net US crude imports rose by 369,000 barrels per day.
The product side tells a tighter story. Gasoline stocks fell by 1.686 million barrels to 206 million, against forecasts for a 0.1 million-barrel build. Distillate stockpiles, which include diesel and heating oil, fell by 0.4 million barrels to 107.4 million. That leaves distillates 12% below their five-year average, the tightest segment of the US petroleum market.
The prior weeks showed steady draws. Crude inventories fell by 0.64 million barrels to 423.4 million in the week ended September 11, and by 0.391 million to 424.1 million in the week ended September 4. Both draws were smaller than expected.
The Strategic Petroleum Reserve has absorbed much of the shock. The SPR stands at 284.96 million barrels, after a drawdown of 128 million barrels since early April as part of a 172 million-barrel release coordinated with the International Energy Agency. That release has kept US commercial crude stocks near normal despite the loss of Gulf supply. As the SPR shrinks, that buffer thins.
The inventory picture explains the Brent-WTI spread. US crude stocks are near normal thanks to domestic production and SPR releases, while the global seaborne market is short. Distillates are the pressure point: the diesel shortage is where the Hormuz shock hits American consumers most directly. The next EIA report arrives Wednesday.
Diesel at $6.52, Gasoline at $4.47 and a Possible Export Ban
The oil shock is reaching the pump with full force. US diesel prices hit a record $6.52 per gallon last week. National gasoline averages above $4.47 per gallon. Those prices reflect both the crude rally and the tightness in refined products, particularly distillates, where US stocks sit 12% below their five-year average.
Diesel is the choke point. It powers trucks, trains, farm equipment and construction machinery, which means diesel costs flow into the price of nearly every physical good. A record diesel price is an inflation shock that shows up in freight rates, grocery bills and manufacturing costs with a lag of weeks to months.
The White House is weighing an intervention. Trump is considering a ban on diesel exports as part of efforts to address elevated fuel prices, and said Washington is looking at the option very seriously. An export ban would keep more US-refined diesel at home, easing domestic prices, but it would tighten global diesel markets further and could push international distillate prices higher. It would also widen the gap between US and global fuel prices.
The policy risk cuts both ways for crude. An export ban could reduce US refiners' incentive to run at high utilization, since they would lose access to lucrative export markets. Lower refinery runs mean less demand for crude, which is bearish for WTI. But tighter global diesel supply would support Brent and international crack spreads. The net effect would likely widen the Brent-WTI spread beyond its current $10.78.
Consumers are feeling the squeeze. The University of Michigan's final September consumer sentiment reading fell to 48.1 from 51.7 in August, near historic lows, with fuel prices cited as a key driver. Year-ahead inflation expectations sit at 4.6%. Households expect prices to keep rising, which feeds the Federal Reserve's hawkish stance.
Europe faces the same pressure. Eurozone energy inflation jumped to 14.3% in August, its highest since January 2023, pushing headline inflation to 3.3%. German consumer sentiment deteriorated as energy prices weighed on households' income expectations.
For the forecast, refined product prices matter as much as crude. Record diesel prices signal that the physical shortage is real at the consumer level, not just in futures markets. As long as distillate stocks sit 12% below normal, any further crude supply disruption translates into higher pump prices quickly, which keeps both the political pressure and the inflation feedback loop intense.
The Rate Feedback Loop: 5.22% Treasury Yields and 70.3% Fed Hike Odds
Oil is not just responding to macro conditions; it is driving them. Monday's crude rally pushed the 10-year Treasury yield to 5.22%, the highest level since 2007. The 5-year jumped 7 basis points to 5.06%, the 2-year sits at 4.91%, and the 30-year has climbed to 5.51%. Fed funds futures now price a 70.3% probability of an October rate hike, up from 64.2% one session earlier.
The chain runs directly from crude to the Fed. Higher oil lifts headline inflation and inflation expectations. Higher inflation expectations push the Fed toward more tightening. More tightening lifts Treasury yields. The Fed already raised rates by 25 basis points on September 16, lifting its target range to 3.75%–4.00%, and the market expects at least one more hike.
The same loop operates in Europe. The European Central Bank hiked on September 10, lifting its deposit rate to 2.50%, its second hike since the Middle East conflict began. The ECB said the conflict continues to generate inflation pressures, with inflation set to remain well above target for an extended period.
The feedback eventually works against oil. Higher interest rates slow economic activity, which reduces demand for fuel. Tighter financial conditions weigh on manufacturing, freight and consumer spending. If the Fed hikes aggressively enough to trigger a slowdown, oil demand falls and prices follow. That is the market's built-in brake on the rally, but it operates with a lag of months.
The dollar adds a near-term headwind. The dollar index trades at 101.09, up 0.1%, near three-month highs. Oil is priced in dollars, so a stronger dollar raises the cost of crude for buyers using other currencies, which can soften international demand at the margin.
Cross-asset reactions confirm the inflation reading. Gold fell 3.3% to $4,146 on Monday as higher yields crushed demand for non-yielding assets. Bitcoin dropped 2.28%. Nasdaq-100 futures fell 0.92%. The market is treating the Hormuz rejection as an inflation shock rather than a flight-to-safety event.
For the oil forecast, the rate loop sets the ceiling on how long prices can stay elevated. Crude above $100 would push yields higher and hike odds toward 85%, tightening conditions enough to erode demand over the fourth quarter. The near-term price is set by supply; the medium-term price will increasingly be set by how much demand the Fed destroys in response.
Energy Stocks Rally While Airlines Sink: OXY and COP Up 2%, XOM and CVX Up 1.5%
The equity market's reaction to Monday's oil spike splits cleanly between producers and consumers of fuel. Energy stocks are catching a bid in premarket trading. Occidental Petroleum and ConocoPhillips are each up 2%. Exxon Mobil and Chevron are both higher by 1.5%.
The energy sector is recovering part of last week's damage. The Energy Select Sector SPDR lost 3.53% during the week ending September 25, as WTI fell 3.79% on diplomacy hopes. Energy and communication services were the two sectors that finished lower on Friday, when the broader market rallied. Monday's reversal in crude is reversing that sector move.
The producer rally reflects operating leverage to crude. Upstream companies like Occidental and ConocoPhillips have costs that are largely fixed in the short term, so every dollar added to the oil price flows almost directly to their margins. Integrated majors like Exxon and Chevron have refining operations that partly offset their upstream gains, which explains their smaller 1.5% moves.
Oil services face a mixed picture. KLX Energy Services updated its third-quarter guidance to revenue of $180 million to $185 million, up 9% sequentially, but the stock slipped 0.62% in premarket trading.
Airlines are on the losing side. United Airlines and the major carriers are trading lower as investors digest the implications for jet fuel costs. Jet fuel is refined from the same middle-distillate cut as diesel, and with US distillate stocks 12% below normal, jet fuel prices track diesel's record climb. For carriers running on thin margins, a $3.92 jump in WTI in one session hits forward earnings estimates directly.
European energy stocks provide a cushion for those indexes. The UK's FTSE 100 rose 0.46% and France's CAC 40 gained 0.37% on Monday, outperforming US index futures, partly because European indexes carry heavier weightings in oil majors.
The broader market reads oil as a net negative. S&P 500 futures are down 0.52%, with energy stocks too small a weight in the index to offset damage elsewhere. Higher oil lifts yields, which pressures high-multiple technology stocks, and squeezes consumer spending.
For the forecast, energy equities serve as a confirmation signal. When producer stocks rally alongside crude, investors believe higher prices will last long enough to lift earnings. If Exxon and Chevron fade while crude holds, it would suggest equity investors expect a diplomatic resolution to pull prices lower soon.
The Global Demand Picture: Asia Sells Off as Import Bills Climb
Crude's supply shock is colliding with signs of demand stress in the world's largest importing regions. Asian markets sold off hard on Monday as oil and US yields rose together. South Korea's Kospi fell 2.7% to 6,889.74. China's CSI 300 dropped 2.22% and the Shanghai Composite lost 1.7%. Japan's Nikkei 225 fell 0.73%.
India took one of the hardest hits. The BSE Sensex plunged 1,064 points, or 1.31%, to 72,926, while the Nifty 50 lost 1.33% to 22,831, near six-month lows. The combined market capitalization of BSE-listed companies dropped by INR 7.5 lakh crore in a single session. India is one of the world's largest oil importers, and surging crude prices combined with a weakening rupee and foreign fund outflows triggered a broad selloff.
The import bill is the transmission mechanism. Asian economies buy the bulk of Gulf crude, and the Hormuz closure has forced them to source oil from longer, more expensive routes at higher prices. Every dollar added to Brent increases their import costs and widens their current account deficits. That weakens their currencies, which makes oil even more expensive in local terms.
Europe faces similar pressure. The eurozone is a net energy importer, and EUR/USD has fallen to 1.1377, near its weakest level since late July. The euro's terms of trade deteriorate with each oil spike, draining capital from the region to pay for dollar-denominated energy.
Demand destruction has not yet shown up clearly in the data, but the warning signs are building. High prices eventually reduce consumption as households cut driving, airlines trim schedules and industries delay production. Consumer sentiment at 48.1 in the United States and deteriorating German consumer confidence point in that direction.
China adds a trade dimension. China is set to cut tariffs on a broad range of US agricultural goods, a sign of easing trade tensions following last week's meeting between President Trump and President Xi. Better US-China trade relations support global growth expectations, which is mildly supportive for oil demand over the medium term.
For the forecast, demand is the slow-moving counterweight to supply. The supply shock sets the price today; demand erosion determines how long elevated prices can last. At Brent above $105, the demand response accelerates. That is why each spike toward $110 has been followed by a pullback rather than a sustained move higher.
Read More
-
Yen Stalls at 160 Despite a 3% JGB and Tokyo Core CPI at 2.0% — Intervention Sits at 164, Friday's Payrolls Decide
02.09.2026 · TradingNEWS ArchiveEnergy
-
Intel Pulls Back From $127 as AI Chip Trade Wobbles — $116.16 Support Guards the 228% Rally
28.09.2026 · TradingNEWS ArchiveStocks
-
Ethereum Outperforms Bitcoin on Record 71% Quarter — $2,602 EMA Guards the Path to $2,800 and $3,000
28.09.2026 · TradingNEWS ArchiveCrypto
-
Gold ($4,146) Breaks Below $4,200 as Oil Rips to $96 — $4,009 June Low Guards the Path Back to $4,510
28.09.2026 · TradingNEWS ArchiveCommodities
-
Nasdaq, S&P 500 and Dow Slide as Yields Hit 5.22% and Oil Rips to $96; NVDA Up 1.58% on Record Buyback
28.09.2026 · TradingNEWS ArchiveMarkets
-
Sterling Trapped Below 1.3300 as the Fed Outpaces the BOE — 1.3203 Floor Guards the Path to 1.3395
28.09.2026 · TradingNEWS ArchiveForex
Technical Map for WTI: $92.41 Support, $100 and $103.45 Resistance
WTI's chart shows a market trapped between geopolitical risk premium and inventory reality. At $96.33, WTI has recovered Friday's entire loss and sits $3.67 below the $100 psychological level. The contract traded in a range of $92.70 to $94.72 earlier in the session before extending its gains, and the move from the prior close at $92.41 marks a technically oversold market rebounding from its pullback off the $100-plus highs seen earlier this month.
The first support is $92.41, Friday's settlement. A return to that level would erase Monday's entire rally and signal that the market has priced back in a diplomatic resolution. Below that, $90 is a round-number reference that has not been tested since August. The deeper support zone runs from $85 to $86, where WTI settled at $85.76 on August 31 after US and Iranian forces exchanged fire.
On the upside, the first resistance is $100. WTI traded above $100 earlier in September and spent much of the month's first half above that level. Reclaiming $100 on a daily settlement would signal that the market is pricing a prolonged stalemate.
The next resistance is $103.45, the mid-September high reached when the Saudi East-West pipeline shut and Houthi forces captured Perim. A settlement above $103.45 would open the path toward the 52-week high at $117.63, set during the initial Hormuz shock.
Brent carries its own map. The first resistance is Monday's intraday high at $108.83, followed by the mid-September peak at $108.68 and then the $110 level. Support sits at Friday's $104.32 settlement and then the $100 psychological level, which Brent broke below briefly last week before reversing.
The Brent-WTI spread is a signal in itself. At $10.78, the spread shows that the seaborne market outside the United States is far tighter than the domestic US market. A widening spread would signal that the disruption is intensifying in Gulf and Asian markets; a narrowing spread would suggest either improving Gulf flows or tightening US supply.
The November WTI contract expires on October 20. As expiry approaches, Cushing inventory levels will increasingly drive the near-month price. The 2.266 million-barrel Cushing build last week, to 23.7 million barrels, loosens that dynamic.
The trading range for the week is defined: $92.41 support against $100 resistance for WTI, and $104.32 against $108.83 for Brent.
The Week's Calendar: EIA on Wednesday, Hormuz Talks and Payrolls
The oil market faces a week in which physical data, geopolitics and macro releases will all move prices. The negotiating table sits at the top of the list. Talks through mediators are expected Monday or Tuesday, with Iran's delegation and Qatari mediators still in the United States. Any headline on an amended seven-day proposal will move crude by $2 to $4 within hours.
Tuesday brings the Conference Board's September consumer confidence index and the August Job Openings and Labor Turnover Survey at 10:00 a.m. ET. Weak consumer confidence would reinforce concerns that high fuel prices are eroding demand.
Wednesday is the heaviest day. The EIA Weekly Petroleum Status Report will show whether last week's 2.969 million-barrel crude build was an outlier or the start of a trend. A second consecutive build, particularly at Cushing, would pressure WTI. Another draw in distillates would push stocks further below their five-year average and support diesel prices. The same morning, the personal income and outlays release delivers headline and core PCE inflation at 8:30 a.m. ET. PCE will show how much of the energy shock has flowed into broader prices. The eurozone's flash September inflation estimate lands the same day. Wednesday is also month-end and quarter-end, which will lock in Brent's third straight monthly gain.
Thursday brings initial jobless claims at 8:30 a.m., the final S&P Global manufacturing PMI at 9:45 a.m. with 57 expected, and ISM manufacturing at 10:00 a.m. with 54.9 expected. Manufacturing activity is a direct read on industrial fuel demand.
Friday closes with the September employment report at 8:30 a.m. A strong labor market supports oil demand but also reinforces the Fed's hiking bias. Dallas Fed President Lorie Logan, whose district covers the Permian Basin, speaks the same day.
Policy risk runs throughout the week. A decision on a diesel export ban could come at any time and would reshape the refined products market. Houthi attacks on Saudi infrastructure and ships near Bab el-Mandeb remain a constant threat to Red Sea flows.
The combination to watch: stalled talks plus another EIA distillate draw equals a push toward $100 WTI. A reopening framework plus a second crude build equals a return to $92.
Oil Price Forecast: Scenarios, Levels and the Verdict for WTI and Brent
The forecast for crude oil this week turns on diplomacy, but the physical market sets the floor. On the supply side, the Strait of Hormuz has been effectively closed since February 28, Saudi output has collapsed to 6.24 million barrels per day, both of Saudi Arabia's alternative export routes have been attacked, and the Houthis control Perim in the Bab el-Mandeb Strait. On the demand side, US crude stocks sit 2% above their five-year average after last week's 2.969 million-barrel build, refinery utilization has dropped to 94%, and Asian and European economies are straining under record import bills.
The bullish scenario carries real weight. If the mediator talks stall or collapse, and particularly if military strikes resume, WTI reclaims $100 and tests the mid-September high at $103.45. Brent clears its Monday peak at $108.83 and targets $110. Another attack on Saudi infrastructure or a disruption at Yanbu would push Brent toward $115 and WTI toward its 52-week high at $117.63. A diesel export ban would add pressure to global product markets. That path represents upside of 4% to 7% for WTI and 3% to 7% for Brent this week.
The base case is a volatile range. Talks continue without resolution, headlines swing prices by $2 to $4 per day, and WTI trades between $92.41 and $100 while Brent holds between $104.32 and $108.83. Distillate tightness keeps diesel near record levels. Brent closes September with its third straight monthly gain.
The bearish scenario requires a breakthrough. If Washington and Tehran agree on an amended seven-day framework with a credible timeline for reopening Hormuz, the geopolitical risk premium collapses. WTI falls back through $92.41 toward $88 to $90, and Brent drops below $100 again, as it did briefly last week. A second consecutive EIA crude build and weak manufacturing data would accelerate the decline. That path represents downside of 7% to 9% for WTI.
Even a deal leaves a high floor. Damaged Saudi pipelines, pumping stations and refineries take months to restore. The SPR has been drawn down by 128 million barrels and cannot be tapped indefinitely. OPEC+ members cannot raise output quickly after eight months of disruption. That repair timeline is why Brent's floor has risen with each diplomatic cycle, from $67 in February to $90 in August to $104 last Friday.
The rate feedback loop caps the upside over time. Crude above $100 pushes the 10-year yield higher and Fed hike odds toward 85%, tightening conditions enough to erode demand through the fourth quarter.
The verdict for oil at $96.33 WTI and $107.11 Brent: bullish in the near term, with Hormuz diplomacy as the swing factor. Expect WTI to trade between $92.41 and $100 while talks continue, with a retest of $100 likely if the stalemate extends past midweek. Brent holds above $104.32 as long as Saudi export routes remain under threat. The medium-term floor stays elevated near $90 WTI and $100 Brent even in a deal scenario, because the physical damage to Gulf supply infrastructure outlasts any ceasefire. A daily WTI settlement above $103.45 would signal a new leg higher toward $110; a settlement below $92.41 would confirm that the market is pricing a diplomatic resolution.