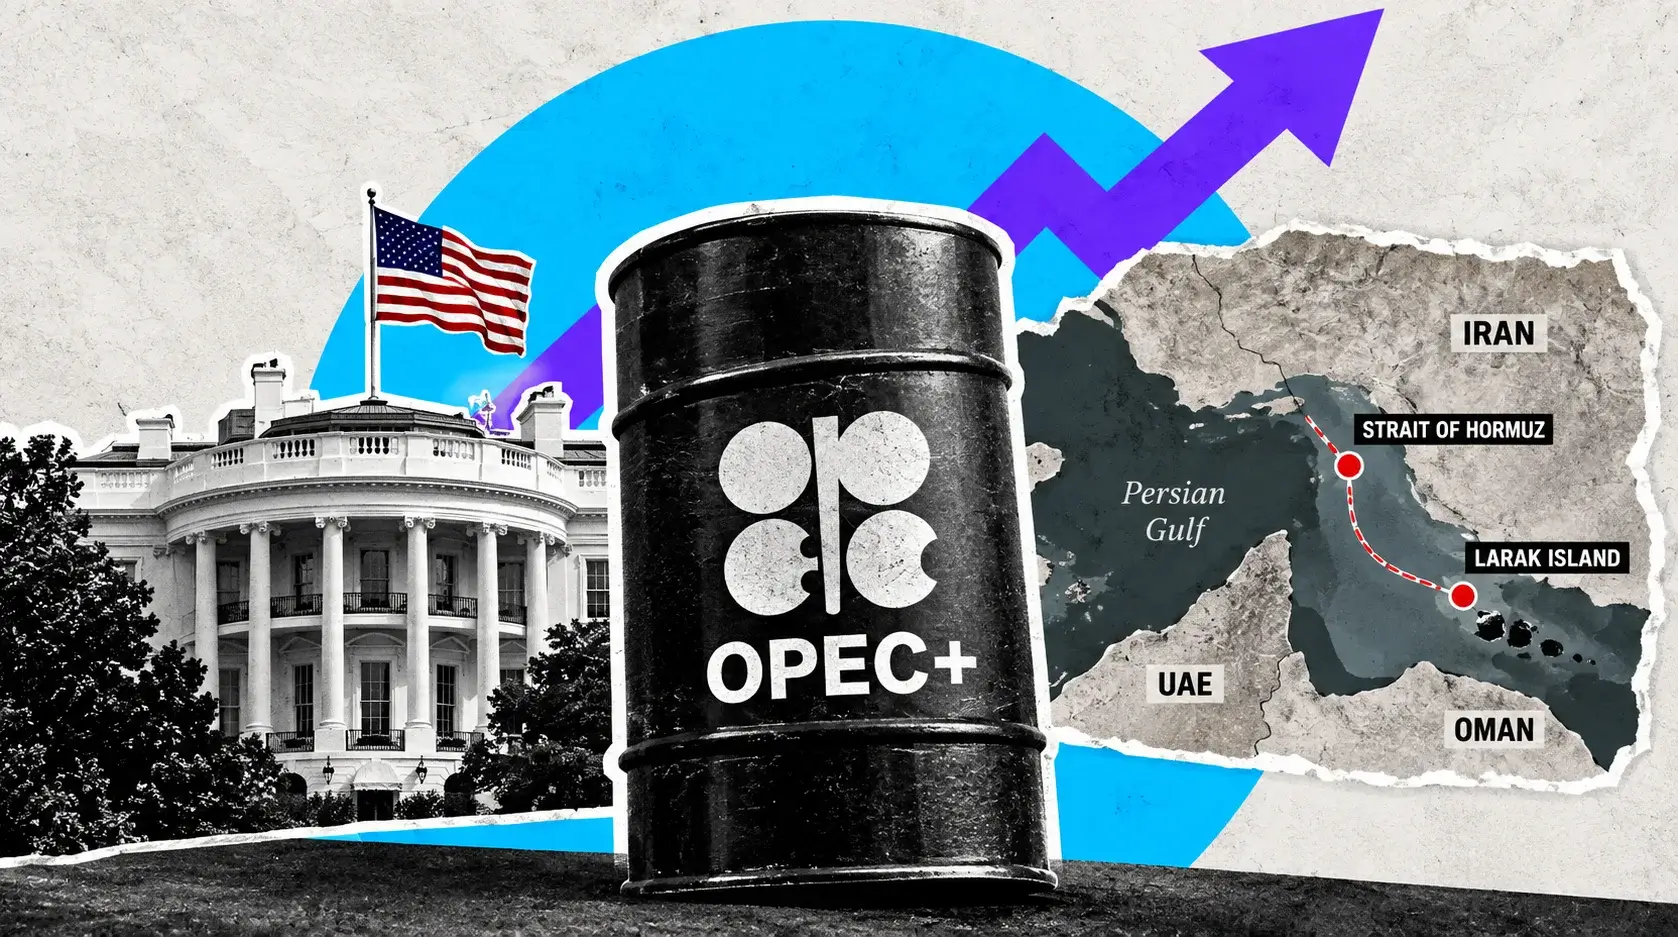
Brent Holds $105 While WTI Heads for a 7% Weekly Loss as a 3M-Barrel Build and a Diesel Ban Threat Split the Market
Brent is on track for a 2% weekly gain after touching $108 on a Houthi attack on Saudi Arabia | That's TradingNEWS
Key Points
- Brent fell to $105.35 and WTI to $94.09 after a report of a phased U.S.-Iran Hormuz deal.
- The Brent-WTI spread widened to $12.68 this week, its widest level since May.
- U.S. crude inventories rose 2.969 million barrels against an expected 641,000-barrel draw.
Oil prices fell on Friday, September 25, as a report that U.S. and Iranian negotiators are exploring a phased agreement to reopen the Strait of Hormuz trimmed the risk premium built up over the previous two sessions. Brent crude, the international benchmark (ICE:BRN1!), traded at $105.35 to $105.52 per barrel, down $1.08 to $1.25, or 1.0% to 1.2%. U.S. West Texas Intermediate for November delivery (NYMEX:CL1!) traded at $94.09 at 11:34 a.m. ET, down $0.52 or 0.55%, after falling as low as $92.90 earlier in the session, a decline of 1.81% at the trough.
Friday's pullback follows a violent Thursday. Brent closed at $106.60 after nearing $108 intraday, a gain of more than 3%, on a Houthi missile attack on Saudi Arabia that revived fears of broader supply disruption. WTI rose 2.7% to settle at $94.61. The rally faded late in the session once reports surfaced of the U.S.-Iran talks in New York, and Friday's selling extended that reversal.
The weekly picture shows two different markets. Brent is on track for a weekly gain of 2%. WTI is on track for a weekly decline of 7% on a front-month basis, dragged by a surprise build in U.S. crude inventories, the roll from the October to the November contract, and the prospect of a U.S. diesel export ban that could leave more fuel trapped in the domestic market. The spread between Brent and WTI widened to $12.68 this week, the widest since May, when it exceeded $13.
Natural gas followed crude lower. Henry Hub futures fell 5.25% to $3.124 per million British thermal units after reclaiming $3 earlier in the week. Energy equities traded with the commodity: Devon Energy dropped 2.66% to $47.60.
The thesis for this forecast runs through every section that follows. There are now two oil markets, and they are telling different stories. Brent, priced off the waterborne barrels that must pass through the Middle East, carries a war premium that has held above $100 for most of September because only 10 commodity vessels transited Hormuz on Wednesday against a 10-day average of 17. WTI, priced off a U.S. market where crude inventories just rose by 3 million barrels and the government may block diesel exports, is trading on domestic oversupply. The $12.68 spread between them is the clearest measure of how much of today's oil price is geopolitics. A confirmed Hormuz deal would collapse that spread and pull Brent toward $95. Without one, the war premium stays.
A Week of Two Directions: Brent +2%, WTI −7%, and a $108 Intraday High
The week's price path reflects how sharply crude has reacted to every Middle East headline.
Monday opened with crude sliding. Investors monitored diplomatic efforts around the conflict ahead of the United Nations General Assembly, and reports of improving oil flows from the Gulf fed expectations of increased supply. Treasury yields and oil fell together, and the S&P 500 and Nasdaq posted their best session since early August.
Wednesday reversed the move. Iranian President Masoud Pezeshkian told the United Nations that Tehran would not surrender to U.S. pressure. Brent crude jumped 3.9% to settle at $103.08, and WTI rose 1.8% to $92.16. At the same time, reports that President Trump backed a potential ban on U.S. diesel exports sent diesel futures swinging. Brent touched $103.51 and WTI $92.51 in early Thursday trading as U.S.-Iran talks stalled.
Thursday brought the week's peak. A Houthi missile attack on Saudi Arabia sent Brent to a one-week high, with prices climbing to just over $108 intraday. The rally faded after reports that U.S. and Iranian negotiators in New York were considering a deal under which Iran would reopen the Strait of Hormuz and the United States would lift its economic blockade on Iranian ports. Brent closed at $106.60, still up more than 3% on the day. Iran publicly denied that deal talks were taking place.
Friday extended the fade. Brent slipped to $105, and WTI dropped to $92.90 before recovering to $94.09.
The swings are large relative to the underlying price. Brent's intraday range across the week ran from the low $100s to just over $108, a band of more than 7%. That volatility reflects a market pricing binary outcomes: either Hormuz reopens and tens of millions of barrels return to the market, or it stays constrained and the supply deficit persists. Every headline moves the probability, and the probability moves the price by $3 to $5 per barrel.
For traders, the pattern this week is a warning about headline risk. Iran's denial on Thursday did not stop the market from pricing the phased-deal report on Friday. The next confirmation or denial could reverse the move just as quickly.
September's Arc: From $95 to $109.68 and Back, With the East-West Pipeline Shut
September has been one of the most volatile months for crude since the conflict began. On September 4, November Brent traded at $95.09 and WTI at $90.81, with Brent heading for a 7% weekly gain and WTI for a 10% gain after U.S. strikes on Iranian targets near the Strait of Hormuz and Iranian missile and drone attacks on U.S. and allied positions in Kuwait, Bahrain, and Jordan.
The escalation continued the following week. On September 8, the U.S. military destroyed five Iranian crude oil tankers in retaliation for attempted attacks on an American warship. Brent gained 3.4% to $101.21 on September 9, its highest close since May 22, and WTI rose 3.3% to $96.05. On September 10, Brent rallied to $109.68 intraday, its highest level since a May 15 peak of $109.75. On September 11, WTI for October delivery soared to $104.46, its highest since a May 21 peak of $105.28, before settling at $100.05. Brent closed that day at $104.61. Both benchmarks gained 9% for the week.
September 11 brought the most serious supply shock of the month. Saudi Arabia's East-West Crude Oil Pipeline, which had been diverting 7 million barrels per day of crude to Red Sea ports to bypass Hormuz, was shut down after attacks. Combined with the restrictions at Hormuz and the Bab al-Mandab strait, the shutdown disrupted 39% of global trade and 31% of global shipments. Strikes on commercial vessels had already brought oil exports from Gulf Cooperation Council countries to a near standstill.
Saudi Arabia adapted. It shifted some crude exports back through Hormuz and began making additional cargoes available to Asian refiners through ship-to-ship transfers just outside the strait near Oman's Sohar port. That rerouting eased fears on September 17, when Brent fell $1.01 to $104.82 and WTI slipped 52 cents to $101.91. At that point, WTI was up 18% for the month.
The late-month pullback in WTI reflects the roll from the October contract, which settled near $102, to the November contract, which trades near $94. That gap is backwardation, a structure in which near-dated oil trades above later-dated oil, and it signals a market paying a premium for immediate barrels. Brent's front month has held between $101 and $108 for most of the last three weeks.
Hormuz at 10 Vessels a Day: The Chokepoint That Sets the Price
The Strait of Hormuz is the single most important variable in the oil market, and the flow data shows it remains severely constrained. Only 10 commodity vessels transited Hormuz on Wednesday, September 23, below the 10-day moving average of 17. Before the conflict, the strait carried roughly one-fifth of global oil consumption. The International Energy Agency has described the disruption as the largest supply disruption in the history of the global oil market.
The strait has been effectively closed to normal traffic since February 28, 2026, when the conflict began. Brent surged 10% to 13% to $80 to $82 per barrel by March 2, dropped back toward $70 by July during a lull in fighting, and has since climbed back above $100 as hostilities resumed. The U.S. and Iran largely refrained from fighting for about a month after an outburst of violence in July. Washington pivoted to economic pressure, but fighting erupted again as Iran continued to attack commercial traffic in and around the strait.
The Friday headline is the most concrete sign of progress in weeks. U.S. and Iranian negotiators in New York are reported to be exploring a phased deal that would lift naval blockades against tankers crossing Hormuz and ease U.S. sanctions on the Iranian economy. The phasing matters: rather than a single agreement, the framework would restore flows in stages, with each step tied to reciprocal concessions. That structure would bring barrels back gradually rather than all at once.
There are clear obstacles. Iran denied deal talks on Thursday. President Pezeshkian told the United Nations on Wednesday that Iran would not surrender under pressure. The U.S. Senate narrowly rejected a nonbinding measure demanding an end to the war. Houthi forces in Yemen, aligned with Iran, attacked Saudi Arabia on Thursday, showing that regional proxies can disrupt supply regardless of what happens in New York.
The price implications are asymmetric. A confirmed phased agreement would likely strip $8 to $12 from Brent over several weeks as vessel counts climb back toward pre-war levels, pulling the benchmark toward $95. A collapse in talks, or a major attack on shipping, would push Brent back toward the $108 to $110 zone that capped prices on September 10 and September 24. Between those outcomes, the market will trade on vessel counts. A rise in daily transits above 17 would confirm that flows are improving. A drop below 10 would signal fresh disruption.
The $12.68 Brent-WTI Spread: The Widest Since May and Why It Matters
The gap between Brent and WTI is the clearest measure of how the war is reshaping oil markets. The spread widened to $12.68 per barrel this week, the widest since May, when it topped $13. Before the conflict, the spread typically ran between $3 and $5.
The spread reflects the physical geography of supply. Brent is priced off crude loaded in the North Sea and serves as the benchmark for most internationally traded oil, including cargoes that must compete for barrels displaced from the Middle East. When Hormuz is constrained, European and Asian refiners bid up waterborne crude from every other source, and Brent absorbs that premium directly.
WTI is priced at Cushing, Oklahoma, the landlocked hub for U.S. domestic crude. It reflects U.S. production, U.S. refinery demand, and U.S. inventories. American crude can be exported, but pipeline and terminal capacity limit how much can reach the Gulf Coast and ship abroad. When U.S. supply rises faster than export capacity, WTI trades at a deeper discount.
This week added three U.S.-specific pressures. First, U.S. crude inventories rose by 3 million barrels when a draw was expected. Second, stocks at Cushing jumped by 2.27 million barrels, the delivery point for WTI futures. Third, the prospect of a U.S. diesel export ban raised the risk that more refined product would be trapped in the domestic market, lowering U.S. refiners' demand for crude. All three push WTI lower relative to Brent.
The spread has trading consequences. It is a direct signal of export economics: at a $12.68 discount, U.S. crude is highly competitive in Europe and Asia, and exporters have every incentive to ship as much as terminal capacity allows. That export pull should eventually narrow the gap. It also signals where the war premium sits. Roughly $8 to $9 of the spread above its pre-war norm represents the geopolitical premium embedded in Brent that WTI does not carry.
For the forecast, the spread is the variable most sensitive to a Hormuz deal. If the strait reopens, Brent would fall faster than WTI, and the spread would compress toward $5 to $7. If disruption worsens, Brent would rise faster, and the spread could widen past $13 to a new high for the conflict.
EIA Data: A 3-Million-Barrel Crude Build, Cushing Up 2.27 Million, Products Drawing Down
The U.S. government's weekly inventory report added a bearish input for WTI and a bullish one for refined products. According to the U.S. Energy Information Administration's Weekly Petroleum Status Report for the week ending September 18, released on September 23, commercial crude oil inventories rose by 2.969 million barrels to 426.4 million barrels. Analysts had expected a draw of 641,000 barrels, so the build missed consensus by 3.6 million barrels. It was the first build in four weeks, after three consecutive draws. The prior week had shown a draw of 640,000 barrels.
Stocks at Cushing, Oklahoma, the delivery hub for WTI futures, rose by 2.266 million barrels after a prior draw of 342,000 barrels. A sharp Cushing build is especially bearish for WTI because it signals that more crude is available at the exact location where futures contracts settle.
The products side told the opposite story. Gasoline inventories fell by 1.686 million barrels, against an expected build of 93,000 barrels, after a build of 794,000 barrels the prior week. Distillate stocks, which include diesel and heating oil, fell by 428,000 barrels to 107.4 million barrels, slightly less than the 633,000-barrel draw expected. Distillate inventories stood 13% below the five-year seasonal average and 12.7% below year-ago levels.
The split matters for the price structure. Crude looks well supplied in the United States, which weighs on WTI. Refined products, especially diesel, look tight, which supports refining margins and keeps demand for crude elevated at refineries that can run it. Earlier this month, U.S. refineries processed 17.5 million barrels per day at 98% capacity utilization in the week ending August 28, a level that leaves little room to increase output further.
The next weekly report, due September 30, will show whether the crude build was a one-week anomaly or the start of a trend. A second build, especially at Cushing, would push WTI toward $90. A return to draws would support the $94 level and could narrow the Brent-WTI spread.
Read More
-
Yen Stalls at 160 Despite a 3% JGB and Tokyo Core CPI at 2.0% — Intervention Sits at 164, Friday's Payrolls Decide
02.09.2026 · TradingNEWS ArchiveEnergy
-
Dell Rebounds to $565.86 as a $95 Billion AI Backlog Meets 22x Forward Earnings — $595 High in Sight
25.09.2026 · TradingNEWS ArchiveStocks
-
XRP-USD ($1.53) Outperforms as ETF Inflows Return, but August Buyers Guard $1.60 — $1.70 Upside vs. $1.25 Floor
25.09.2026 · TradingNEWS ArchiveCrypto
-
Gold Stuck Below the $4,400 Seller Zone as 5.2% Yields Cap Bullion — $4,700 Target in Play
25.09.2026 · TradingNEWS ArchiveCommodities
-
S&P 500 Gains 0.22%, Nasdaq Tops 27,000, Dow Up 0.40% on MSFT Launch and AKAM Deal
25.09.2026 · TradingNEWS ArchiveMarkets
-
Sterling Slides to 1.3216 as a Divided Bank of England Trails the Fed — 1.3424 Upside vs. 1.3000 Risk
25.09.2026 · TradingNEWS ArchiveForex
Diesel Above $5 and 13% Below Normal: The Export Ban That Could Break the Market
The tightest part of the oil market right now is diesel. NYMEX ultra-low sulfur diesel futures for October delivery surged above $5 per gallon on September 10 for the first time since the 2022 rally triggered by Russia's invasion of Ukraine. They eased to $4.9593 on September 11 but gained almost 10% for that week. U.S. retail diesel prices climbed to record levels.
The shortage is structural. Distillate inventories stand at 107.4 million barrels, 13% below the five-year average, and the latest weekly draw extends a multi-month pattern rather than an isolated event. The disruption comes from overseas refining losses, including damage to Russian refineries from the war in Ukraine and the loss of Middle Eastern product exports through Hormuz. With U.S. refineries already running near capacity, domestic output cannot fill the gap.
That shortage produced the week's most unusual policy risk. President Trump said on Tuesday at the United Nations that he had called for a halt to diesel exports, telling reporters that the U.S. makes a lot of diesel and should keep it. He faces mounting political pressure over fuel prices ahead of the November midterm elections. Diesel futures dropped 6% on a report of an export ban that the White House later denied.
The oil industry pushed back hard. The American Petroleum Institute warned that Americans are hurting from rising diesel costs driven by an unprecedented disruption to global refining capacity, and industry groups argued that an export ban would backfire and worsen the global fuel crisis. The logic is straightforward: U.S. refiners supply diesel to Latin America and Europe, and cutting those exports would raise prices abroad, trigger retaliation, and reduce the incentive for U.S. refiners to maximize diesel output.
For crude prices, a diesel export ban would cut in two directions. It would lower U.S. diesel prices in the short term by trapping supply at home. It would also reduce U.S. refiners' demand for crude if they cannot sell the extra product, which would push WTI lower and widen the Brent-WTI spread further. That is part of why WTI fell this week while Brent rose.
Europe is feeling the diesel squeeze directly. In France, 16.5% to 17% of fuel stations reported shortages on September 21, driven by a price cap rather than a physical shortage. Germany's government has decided to cut fuel taxes by €0.17 per liter from October 1 through year-end.
The SPR Buffer: 128 Million Barrels Drawn Since April From a 172-Million-Barrel Release
Governments have been spending their emergency stockpiles to cushion the supply shock. The U.S. Strategic Petroleum Reserve has been drawn down by 128 million barrels since early April as part of a 172-million-barrel release coordinated by the International Energy Agency after the Strait of Hormuz closed on February 28. That leaves 44 million barrels of the coordinated U.S. commitment still to be delivered.
The release has served its purpose. Without it, U.S. commercial inventories would have fallen far faster through the spring and summer, and prices would likely have run well above their May peaks of $109.75 for Brent and $105.28 for WTI. The SPR has acted as a shock absorber, filling part of the gap left by missing Middle Eastern barrels.
The problem is that the buffer is finite. As the coordinated release winds down, the market loses a steady source of supply that has been flowing for six months. If Hormuz remains constrained into the fourth quarter, the supply deficit that the SPR has been filling will fall back onto commercial inventories and prices.
The inventory data shows how much the buffer has been doing. U.S. commercial crude stocks stood at 426.4 million barrels as of September 18. Earlier in the summer, commercial stocks matched the five-year average at 424.1 million barrels, despite a Hormuz closure that removed a large share of global supply. That stability reflects SPR barrels replacing lost imports.
Middle distillates are thinner. Jet fuel and middle distillate cover has fallen below the IEA's comfort level of 23 days on some measures, against the European Union's 90-day strategic-stock obligation. The emergency system has focused on crude, but the shortage has migrated to refined products, where stockpiles are harder to release quickly.
For the forecast, the SPR sets a timeline. The remaining 44 million barrels would cover a few more weeks of drawdown at recent rates. Once the release ends, the market will need either a Hormuz reopening or significant demand destruction to balance without prices climbing. A decision by governments to extend or expand the release would add supply and pressure Brent. A decision to begin refilling the reserve would add demand and support prices.
Demand Destruction: IEA Cuts 2026 Demand by 2.5 Million Barrels a Day, Deficit Still 1.74 Million
High prices are already reducing consumption. The International Energy Agency, tracking a surge of close to 45% in crude prices since the second quarter, deepened its 2026 forecast for a contraction in global oil demand to 2.5 million barrels per day, from the 1.6-million-barrel decline it estimated in August. That is one of the largest annual demand declines outside a recession.
The supply side has deteriorated even more. The IEA expanded its projected 2026 global supply deficit to 1.74 million barrels per day from 1.27 million. In other words, even after demand falls by 2.5 million barrels a day, supply losses from the conflict are so large that the market remains short by 1.74 million barrels a day. That gap is being filled by inventory draws, including the SPR, which cannot continue indefinitely.
The U.S. Energy Information Administration's Short-Term Energy Outlook, released September 9, showed the Brent spot price averaging $91 per barrel in August, $7 higher than in July, as total exports from the Middle East remained constrained and more production in the region was shut in. The agency warned that continued volatility in flows through Hormuz and through alternative routes will likely produce more short-term price swings than its forecast indicates. The next outlook is due October 6.
Asia is behaving differently from the demand-destruction narrative. The region is on track to import 23.96 million barrels per day of crude in September, up from 23.38 million in August and the most since February, the month before the conflict began. Asian refiners are rebuilding stocks as Saudi ship-to-ship transfers near Oman make more cargoes available. That buying supports Brent, which prices most Asia-bound crude.
The demand picture in the U.S. is mixed. Gasoline prices near $4.50 per gallon are squeezing household budgets. The University of Michigan's consumer sentiment index sits at 48.1, one of the weakest readings on record, with consumers citing fuel costs. But gasoline inventories drew by 1.686 million barrels last week, showing that demand has not collapsed. Business activity is also strong: the U.S. flash composite PMI hit 58.4, its fastest pace in more than five years.
For the forecast, demand destruction is a slow-moving floor under prices rather than a fast-moving driver. It takes months to show up in the data, while Hormuz headlines move prices in minutes.
Oil, Inflation, and the Fed: The Feedback Loop Pushing 10-Year Yields to 5.2%
Crude is now the central input into the global interest rate outlook. Every move in oil feeds directly into inflation expectations, which drive central bank decisions, which move bond yields and the dollar.
The Federal Reserve raised its benchmark rate by 25 basis points on September 16 to a range of 3.75% to 4.00%, its first hike since 2023, citing inflation driven partly by higher energy costs. Its median projection puts 2026 PCE inflation at 3.7%. This week, New York Fed President John Williams, Philadelphia Fed President Anna Paulson, and Governor Michael Barr all signaled more tightening, while Chicago Fed President Austan Goolsbee warned that the energy shock should be treated as persistent inflation rather than a temporary supply blip. Futures price a 66% to 71% probability of another hike in October. The University of Michigan survey shows year-ahead inflation expectations at 4.6%, the highest since June, with consumers explicitly citing fuel prices.
The European Central Bank has hiked twice since June, to a 2.50% deposit rate, and has named energy prices as the main source of inflation risk. Bundesbank President Joachim Nagel said oil prices were becoming an increasingly important factor in policy decisions.
Bond markets have absorbed the message. The 10-year Treasury yield hit 5.225% on Thursday, its highest since July 2007. The 30-year touched 5.502%, the highest since 2004. Germany's 10-year Bund yield reached 3.57%, its highest since 2009. Every oil rally this week lined up with a rise in yields, and Friday's crude decline gave bonds their first relief in days.
The feedback loop runs back to oil through the dollar. The Dollar Index touched 101 on Thursday, a two-month high, and is heading for a weekly gain of 1%. A stronger dollar makes crude more expensive for buyers holding other currencies, which trims demand at the margin.
Other markets confirm the linkage. Gold, which has shown a -31% correlation with Brent since March 2026, rose on Friday as oil fell, because cheaper crude eases rate-hike pressure. Stocks rallied: the S&P 500 gained 0.22% as crude slipped.
For the oil forecast, the Fed is not a direct driver of supply or demand in the short term. But the macro feedback loop means a sharp crude rally tightens financial conditions, strengthens the dollar, and slows growth, which eventually weighs on oil demand. That self-correcting mechanism limits how far prices can run without a physical supply shock.
Energy Equities and Natural Gas: Devon Down 2.66%, Henry Hub Down 5.25%
Energy stocks traded with crude on Friday. Devon Energy (DVN) fell 2.66% to $47.60, among the weaker S&P 500 names in the morning session. On Wednesday, energy was the only sector consistently holding gains as the S&P 500 fell 0.75%; the sector rose 1.1% that day while ten of eleven sectors declined. Energy has led the S&P 500 in both the third quarter and year to date, and nine of eleven sectors are higher for 2026 with energy at the top.
That leadership reflects the earnings power of crude above $90. At Brent near $105 and WTI near $94, U.S. producers are generating far more free cash flow than they did at the $59 to $63 WTI range that prevailed in January and February 2026, before the war began. Oil prices at the start of the year traded near their lowest levels since August 2025, with Brent at $63.34 and WTI at $59.12 in the first full week of January.
Refiners occupy a different position. With distillate stocks 13% below the five-year average and diesel futures near $5 per gallon, diesel crack spreads, the margin refiners earn from turning crude into diesel, have been running at historically elevated levels. A diesel export ban would threaten those margins by forcing refiners to sell more product into a domestic market that would then be oversupplied.
Natural gas has decoupled from crude. Henry Hub futures fell 5.25% to $3.124 per million British thermal units on Friday, after reclaiming $3 earlier in the week. U.S. gas prices remain far below the European and Asian levels driven by the loss of liquefied natural gas from the Middle East, because U.S. production is largely domestic and constrained only by export terminal capacity. Lower gas prices reduce input costs for utilities and for on-site power providers such as Bloom Energy, whose fuel cells run on natural gas.
The integrated majors, including Exxon Mobil and Chevron, sit between producers and refiners, with exposure to both crude prices and refining margins. They offer the most balanced exposure to the current environment.
For investors, the equity market is pricing a durable war premium. Energy stocks have held gains through several pullbacks in crude, suggesting investors expect prices to stay elevated even if Hormuz partially reopens. A confirmed deal that drove Brent toward $95 would test that assumption, particularly for higher-cost producers whose economics depend on sustained prices above $90.
Resistance Map: Brent $106.60, $108, $109.68–$109.75; WTI $94.61, $96.05, $100, $104.46
Oil's overhead levels are defined by the recent peaks of the conflict, and each marks a specific escalation.
For Brent, the first resistance is $106.60, Thursday's close. A return above that level would erase Friday's decline and signal that the phased-deal report has lost credibility. It sits 1.1% above Friday's $105.45 midpoint.
The second Brent resistance is $108, the intraday high reached on Thursday after the Houthi attack on Saudi Arabia. That level capped the rally before the U.S.-Iran talk reports surfaced. It is 2.4% higher than the current price.
The third and most important Brent resistance is the $109.68 to $109.75 band, marking the September 10 intraday high and the May 15 peak. That zone represents the highest Brent prices of the conflict's second phase. A close above it would put Brent at its highest level since the spring and would likely require a new supply shock, such as a further attack on Saudi infrastructure or a collapse in the Hormuz talks. It sits 4.0% above Friday's level.
For WTI, the first resistance is $94.61, Thursday's settlement, just 0.6% above Friday's price. The second is $96.05, the September 9 close, 2.1% higher. The third is $100, a psychological level the October contract held for much of mid-September. It sits 6.3% above the current November price. The fourth is $104.46, the September 11 intraday high on the October contract, and the fifth is $105.28, the May 21 peak. Because the November contract trades at a discount to the expired October contract, reaching those levels would require a sustained rally of 11% or more.
The resistance structure shows that Brent is closer to its conflict highs than WTI. Brent sits 4% below its September peak, while WTI's November contract sits more than 10% below the October contract's peak. That gap reflects the widening Brent-WTI spread and the domestic pressures weighing on U.S. crude.
Support Map: Brent $103.08, $101.21, $100, $95; WTI $92.90, $92.16, $90.81, $90
The downside levels for crude are closer for WTI and more widely spaced for Brent.
For Brent, the first support is $103.08, Wednesday's settlement before the Thursday spike. It sits 2.2% below Friday's price. A close below that level would mark the lowest settlement of the week. The second is $101.21, the September 9 close and the highest close since May at the time. It is 4.0% lower. The third is $100, a psychological level Brent has held above for most of the past three weeks. It sits 5.2% below the current price.
The fourth Brent support is $95, the level where Brent traded on September 4 before the latest escalation. A return there would mark a 9.9% decline and would likely require a confirmed Hormuz agreement with vessel counts climbing back toward pre-war levels. Below that, the EIA's August average of $91 marks the level prices held before the September escalation.
For WTI, the first support is $92.90, Friday's intraday low, 1.3% below the current price. The second is $92.16, Wednesday's settlement, 2.1% lower. The third is $90.81, the September 4 level, 3.5% below. The fourth is $90, the psychological floor, 4.3% lower. A move there would likely follow a second consecutive crude inventory build or a confirmed diesel export ban.
Below $90, WTI's next support sits in the mid-$80s, the level before the August escalation. The January range near $59 to $65 marks where crude traded before the war and would only return with a complete resolution of the conflict and a full reopening of Hormuz.
The support map shows WTI closer to its floor than Brent. WTI is 4.3% above $90, while Brent is 5.2% above $100. With U.S. inventories building and a diesel export ban under discussion, WTI has less structural support than Brent, whose floor is set by the physical shortage of waterborne crude.
Oil Forecast: Brent $100–$110 and WTI $90–$98 Base Range, Hormuz Deal Targets Brent $95, Escalation Targets $110
The forecast for crude over the next four to five weeks turns on one variable above all others: whether the reported phased deal to reopen the Strait of Hormuz becomes an agreement. Every other factor, inventories, diesel policy, the Fed, and demand destruction, moves prices by a few dollars. Hormuz moves them by $10 or more.
The base case, carrying the highest probability, is a range of $100 to $110 for Brent and $90 to $98 for WTI. In this scenario, talks continue without a signed agreement, vessel transits through Hormuz stay between 10 and 17 per day, the SPR release continues to wind down, and the Brent-WTI spread stays between $10 and $13. Friday's Brent price of $105.45 sits in the middle of its range; WTI's $94.09 sits near the middle of its own.
The bearish scenario targets Brent at $95, a decline of 9.9%, and WTI at $88. The trigger is a confirmed phased agreement to reopen Hormuz, with daily vessel transits climbing above 17 and Saudi exports returning to normal routes. The Brent-WTI spread would compress toward $7 as the war premium on waterborne crude unwinds. A confirmed U.S. diesel export ban or a second weekly crude build at Cushing would add pressure on WTI specifically. The IEA's projected supply deficit of 1.74 million barrels per day would narrow as Middle Eastern supply returned, but demand destruction of 2.5 million barrels per day would take months to reverse, limiting the recovery in consumption.
The bullish scenario targets Brent at $110, a gain of 4.3%, and WTI at $100. The trigger is a collapse in the U.S.-Iran talks, a further attack on Saudi infrastructure or Gulf shipping, or daily vessel transits falling below 10. The expiry of the SPR release would add upward pressure by removing a source of supply. A close above the $109.68 to $109.75 zone would mark the highest Brent price since the spring and would put the May highs in play.
The verdict is neutral with a war-premium bias. The physical market remains short: only 10 commodity vessels crossed Hormuz on Wednesday, the IEA projects a 1.74-million-barrel-per-day deficit even after record demand destruction, distillate stocks sit 13% below normal, and the emergency reserve release is running down. Those factors keep Brent anchored above $100. The phased-deal report shows that diplomacy is moving, and the $12.68 Brent-WTI spread shows how much of today's price depends on that diplomacy failing. Until the talks produce a signed agreement or collapse, Brent will trade the headlines inside a $100 to $110 box, with the direction of the next $10 decided in New York rather than in the oil fields.