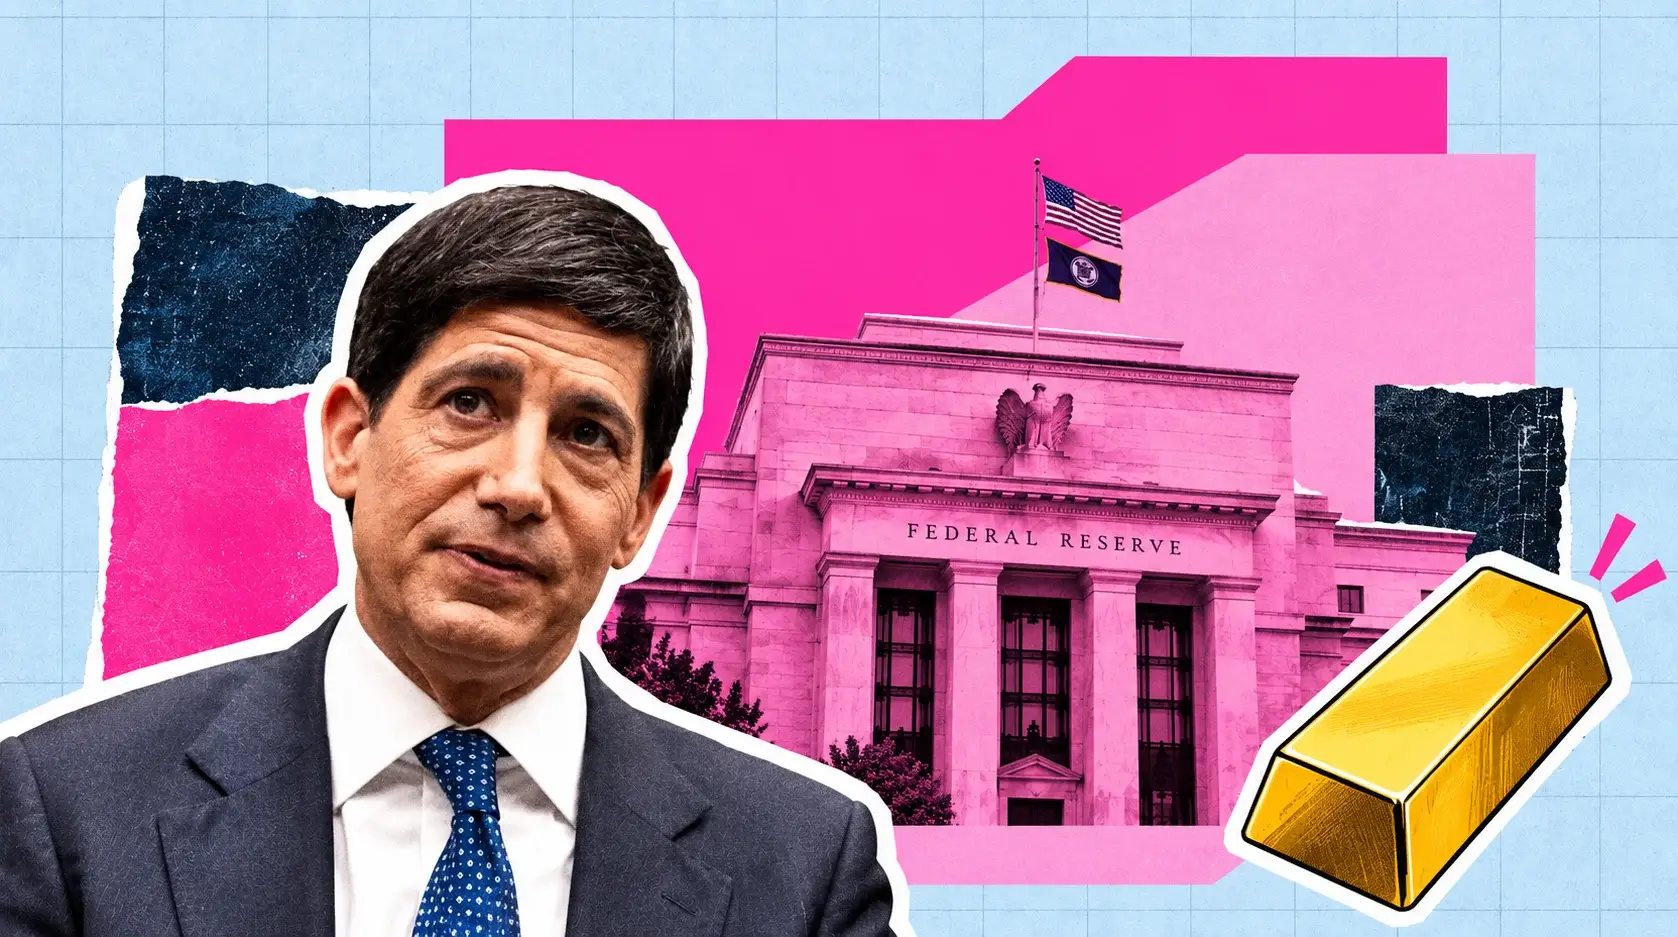
Gold ($4,158) Rebounds Off $4,110 2-Month Low but High Yields Block $4,230 — Downside Risk to $4K Before Recovery
Central banks bought a record 289 tonnes last quarter and U.S. gold ETFs added $3.8B in September | That's TradingNEWS
Key Points
- XAU/USD trades at $4,158, up 0.4%, inside a $4,110 to $4,230 range after a 2.1% weekly loss.
- The 10-year Treasury yield at 5.28% capped Friday's rally at $4,227, the head-and-shoulders neckline.
- Record central bank buying of 289 tonnes in Q2 defends the $4,000 floor, 3.8% below spot.
Spot gold trades at $4,158 an ounce, up 0.4% from Friday's close of $4,140.68, after a session range of $4,125.22 to $4,170.27. December futures on Comex are at $4,189.50, up 0.65%. The gain recovers a small part of last week's 2.1% decline, the second straight weekly loss, and leaves the metal $48 above the two-month low of $4,110 set last week.
The bounce has a plain cause. September payrolls rose by only 29,000 against 84,000 expected, and the probability of a Federal Reserve hike on October 28 fell to 20% from 70% a week ago. A lower chance of tighter policy is supportive for an asset that pays no interest. Gold rallied to $4,227 on the release.
It could not hold there, and the reason sets the forecast. The 10-year Treasury yield is at 5.28%, up 4 basis points today and inside its highest range in more than two decades. The dollar index is firmer at 102.17. Gold finished Friday $87 below its high and $2 below where it started the day. A market that gives back a rally on news that favorable has sellers waiting above.
This is the pattern of the whole decline since late August. Gold has stopped trading as a geopolitical hedge and has traded as a duration asset. War in the Gulf, a restricted Strait of Hormuz and Brent above $100 would ordinarily lift it. This year those same forces have pushed inflation expectations, yields and the dollar higher, and the rate effect has outweighed the fear bid. XAU/USD is down 6.2% over the past month and 25.7% from the January 28 record of $5,598.
Against that stands a buyer base that has not left. Central banks bought a record 289 tonnes in the second quarter. U.S.-listed gold funds took in $3.8 billion in September while the price fell. That demand has defended the $4,000 area on every test since June.
The result is a market boxed between $4,110 and $4,230, the neckline of a head-and-shoulders top on the short-term chart. The technical bias is lower. The structural bid sits $150 underneath. Wednesday's Fed minutes and the direction of long-dated yields will decide which gives first.
From $5,598 to $4,110: How Gold Got Here
The January peak at $5,598 was built on a simple premise: the Fed would cut rates through 2026 while governments kept borrowing, and real yields would fall. Exchange-traded funds bought heavily on that view, and speculative length on Comex reached extremes.
The premise broke in the first quarter. War with Iran closed the Strait of Hormuz to most traffic, crude spiked, and inflation turned higher across developed economies. Rate-cut expectations became rate-hike expectations. ETF holders who had bought the cut story sold, with outflows near 200 tonnes in the first quarter, and gold dropped through $5,000 and then $4,500. By June 25 it traded near $4,009, and the low for the year printed at $3,942.
The summer brought a recovery. A Treasury buyback announcement in August pulled yields down and sent gold up 4.3% in one session to $4,521. The metal reached the $4,700 area later that month as global gold ETFs absorbed $18 billion, the second-largest monthly inflow on record.
September undid most of it. The Fed raised rates mid-month, its first hike in more than three years. Gold absorbed the decision and bounced to $4,372 on September 18 as traders covered shorts. Then the bond market took over. A sell-off on September 28 drove benchmark yields to levels last seen before the financial crisis, and gold fell through $4,230, a level that had been support on September 16. It traded at $4,157 the next morning and touched $4,111 during the week.
The month's statistics describe a one-way move. The high was $4,443.10, the low $4,110.95 and the average $4,274.28. Gold now trades $116 below that average. Brent crude rose 14% during September, and the dollar index reached a two-month high.
Over longer horizons the picture is less severe. XAU/USD is up 4.5% from a year ago and has more than doubled since late 2022. It is down 9.8% over six months. The decline from the January record is a 25.7% drawdown, large for gold and comparable to the corrections of 2008 and 2013 in percentage terms.
The current price is 5.5% above the June low. Everything gained in the July and August recovery, a move of $750, has been surrendered except the final $216.
Friday's Rejection at $4,227
The payrolls session is the most instructive day on the chart, and it argues for caution.
Gold was at $4,140 before the release, with traders pricing a 30% chance of an October hike. The report, from the Bureau of Labor Statistics, was weak across the board: 29,000 jobs, downward revisions of 60,000 to the prior two months, unemployment up to 4.2% and average hourly earnings up only 0.1% on the month and 3.0% on the year, the slowest annual pace since 2021. Hike odds dropped to 14% within the hour.
XAU/USD ran $87 to $4,227. That high landed on the September 16 low and the underside of the broken support. Sellers responded at exactly that level, and by the New York afternoon gold was back at $4,138.
Two things happened to turn it. Treasury yields, which fell on the headline, reversed and finished the day higher at the long end. The 10-year closed near 5.24% and has added 4 basis points since. The dollar index recovered its losses as the euro weakened on concerns over French borrowing costs.
The session produced a long upper wick on the daily candle, a close near the low of the day and a lower high beneath the prior week's $4,285 peak. Each element is bearish on its own. Together they mark $4,227 to $4,230 as the level sellers are defending.
The fundamental message is harder for gold bulls to dismiss. Wage growth of 3.0% and a labor market adding 50,000 jobs a month on a three-month average are disinflationary. If any data set could have pulled long yields down, this was it. They rose. The bond market's concern is supply, oil and term premium, and none of those respond to a soft jobs print. Gold needs lower real yields to rally, and the usual trigger for lower yields has stopped working.
Friday also showed where buyers stand. The close at $4,138 held above Thursday's low of $4,139 by a margin too thin to matter, and the week's floor at $4,111 was not retested. Dip demand between $4,110 and $4,140 has been consistent for five sessions.
Monday's rebound to $4,170 has so far covered less than half of Friday's range. A session that fails to exceed $4,191 would leave the rejection intact.
A 5.28% Ten-Year Is Gold's Real Problem
Gold's relationship with interest rates has reasserted itself with force this year. The metal pays nothing. When a 10-year Treasury yields 5.28% and inflation expectations sit well below that, the real return on government debt is the highest in a generation, and every ounce held carries a visible cost.
The yield structure today is 4.79% on the 2-year, 5.28% on the 10-year and 5.63% on the 30-year. Short yields have eased as hike odds dropped. Long yields have climbed. That steepening is driven by term premium, the extra compensation investors demand to hold long bonds, and it reflects heavy issuance, doubts over fiscal discipline and inflation risk from energy.
For gold this mix cuts two ways. A rise in term premium caused by fiscal anxiety is, in principle, an argument for owning an asset no government can print. That argument is the reason central banks keep buying. In practice, the Western investors who set the marginal price respond to the level of real yields first, and those are too high for comfort.
History offers a guide. In 2022 the Fed raised rates by more than four percentage points and gold fell 21% peak to trough before bottoming once the market sensed the end of tightening. The bottom arrived months before the final hike. The current cycle may be at a similar point: one hike delivered in September, an 80% chance of a hold in October, and expectations for December little changed.
Two things would release the pressure. One is a decline in oil that pulls inflation expectations and long yields down together. The other is a policy response to the bond sell-off itself, such as the Treasury buyback in August that produced gold's best day of the year. Neither is scheduled.
The risk runs the other way if the 10-year pushes through 5.30% and toward 5.50%. Euro zone inflation is at 3.8%, a three-year high. Japanese 30-year yields are at a record. A synchronized global rise in long rates would deepen redemptions from North American gold funds and put the $4,000 floor to a test it has not faced since June.
The ISM services prices-paid index at 10:00 a.m. ET, forecast at 73.0, is the first data point of the week that could move yields, and gold will follow them tick for tick.
The Dollar at 102.17 and the Euro's Trouble
The dollar is the second weight on gold. The dollar index trades at 102.17, up 0.24% on the day and within reach of the two-month high it set in late September. Since gold is priced in dollars, a stronger currency makes it more expensive for buyers elsewhere and tends to lower the dollar price.
The dollar's strength this week owes more to weakness abroad than to conviction in the United States. The euro has dropped to $1.1206 as French government borrowing costs escalate, reviving concerns over fragmentation inside the currency bloc. The European Central Bank faces inflation at nearly twice its target while the bond market is already tightening conditions for it, which limits how far it can raise rates. The yen is at 157.96 per dollar and briefly beyond 158.00, despite expectations of further Bank of Japan tightening and a round of intervention that failed to reverse the slide.
That backdrop matters for gold in two ways. In dollar terms, the metal is being held down by the currency. In euro and yen terms it is performing better, which sustains physical and investment demand in those regions. At $4,158 and $1.1206, gold costs €3,711 an ounce. At 157.96 yen per dollar it costs ¥656,800. Investors in Tokyo and Frankfurt have seen much smaller losses than those in New York.
The currency picture also contains the seed of a reversal. The dollar is rising alongside Treasury yields because of fiscal and supply concerns. A currency supported by policy tightening is on firm ground. A currency supported by a rising risk premium on its own government's debt is not. If investors begin to treat higher U.S. yields as a sign of credit stress, the dollar and Treasuries could fall together, and gold has historically been the main beneficiary of that combination.
There is no sign of that shift yet. The dollar remains the default haven during the global bond sell-off, and it rallied on Friday afternoon even as hike odds collapsed. Until the index breaks below 101.50, the currency channel works against XAU/USD.
For the week, the levels to watch are the September high in the dollar index and $1.1200 in the euro. A break of that euro level would push the dollar higher and likely send gold back to $4,110. A recovery in the euro above $1.1300 would give gold the room it needs to challenge $4,230.
Oil, Hormuz and Why the Fear Bid Is Not Working
The Middle East conflict should be gold's strongest support. Iran has said the Strait of Hormuz will not fully reopen until Washington meets seven conditions. Tehran has warned of a stronger military response to any U.S. strike as more American troops deploy. Yemeni government forces have opened an offensive toward Houthi-held Sanaa after retaking positions around the Bab al-Mandeb Strait.
Brent crude trades at $102.90 a barrel, up 0.64%. West Texas Intermediate is at $90.68, down 0.47%. The head of Saudi Arabia's state oil producer said on Monday that the inventories protecting the world from supply shocks have become dangerously thin, that refined fuel prices have risen faster than crude, and that rebuilding stocks could take two years after the strait reopens.
Gold has not responded, and the reason is the channel through which this conflict reaches markets. A war that threatens oil supply raises energy prices. Higher energy prices raise inflation. Higher inflation brings rate hikes and higher bond yields. For gold, the rate effect has been larger than the haven effect throughout 2026. The metal peaked a month before the conflict began and has fallen 25.7% during it.
The price action around oil confirms the relationship. In May, when hopes for a U.S.-Iran deal sent Brent below $100, gold rallied 1% to $4,554 and silver jumped 3%. In late September, when Brent briefly fell under $98, gold gained. Falling oil has been bullish for gold this year, and rising oil has been bearish.
One ounce of gold buys 40.4 barrels of Brent today. In January it bought more than 70. That ratio captures how the conflict has shifted relative value from the monetary metal to the physical commodity in short supply.
This inverts the usual playbook. A peace agreement that reopens Hormuz would remove geopolitical risk and would also be the most bullish development available for gold, because it would lower oil, inflation expectations and yields at once. An escalation that sends Brent to $115 would hurt gold through the same mechanism in reverse.
Supply-side signals are mixed. Gulf exports have been recovering, Iraq has sent a supertanker through the strait for the first time in decades, the G7 is preparing a coordinated stock release and OPEC+ left November targets unchanged. Those items pressured WTI today. Brent's resilience shows the seaborne market remains tight.
A geopolitical bid does exist. It shows in the speed with which dips toward $4,110 are bought. It functions as a floor and has not provided lift.
Central Banks: 289 Tonnes and a Different Logic
The most durable source of demand is official. Central banks bought 244 tonnes in the first quarter of 2026 and a record 289 tonnes in the second, according to industry data. Those purchases run well ahead of the pace needed to match recent annual totals near 800 tonnes.
The People's Bank of China leads. It added 33 tonnes in the second quarter, its largest quarterly purchase since late 2023, lifting reported reserves to 2,346 tonnes. July marked its 21st consecutive month of buying. Poland's central bank has been the other consistent large buyer, and smaller institutions such as the Czech National Bank add steadily. Net official purchases in July were 23 tonnes.
Survey data show intent to continue. A record 45% of central banks plan to increase gold holdings over the next 12 months, and 89% expect global official reserves to grow. Three-quarters expect the dollar's share of reserves to decline over five years. Gold now makes up 27% of global central bank reserves by value against 22% for U.S. Treasuries.
Reserve managers operate on a logic unrelated to the one driving Western funds. They are not comparing gold with a 5.28% Treasury yield on a quarterly basis. They are reducing exposure to assets that can be frozen or debased, and a rising term premium on U.S. debt strengthens that case. Lower prices let them buy more ounces with the same budget. Their purchases have accelerated as gold has fallen.
That behavior explains why $4,000 has held. During the first half, North American ETF outflows of 61 tonnes and heavy speculative selling were absorbed without a sustained break below that level. Official buying of 533 tonnes over the same period was nearly nine times the fund outflow.
The limitation is equally important. Central banks are price-insensitive on the way down and do not chase rallies. They set floors and do not create momentum. The move from $3,942 to $4,700 over the summer required ETF and futures buyers to return, and the move back down began when those buyers left.
Third-quarter official data will arrive in early November. A figure above 250 tonnes would confirm that the floor is being actively defended at current prices. Monthly reserve disclosures from Beijing, due within days, give an earlier read. A 22nd and 23rd month of Chinese buying is the expectation, and a pause would unsettle a market leaning on that support.
ETF Flows: Money Arriving While the Price Falls
Investment flows through exchange-traded funds tell a story that looks contradictory at first. U.S.-listed gold ETFs took in $3.8 billion in September, a month in which the price fell 6%. That followed $7.9 billion in August. Globally, gold funds absorbed $18 billion in August, the second-largest monthly inflow on record, lifting holdings by 121 tonnes to an all-time high of 4,189 tonnes and total assets to $615 billion.
Inflows during a falling market mean a different class of buyer is active. The selling in September came from futures traders and short-term accounts responding to yields and the dollar. The buying came from allocators adding on weakness: wealth managers, pension funds and retail investors using lower-cost products.
The composition of flows supports that reading. In the week ended September 12, the largest gold fund, SPDR Gold Shares (GLD), lost $603 million while cheaper funds including SPDR Gold MiniShares and iShares Gold Trust (IAU) gained. GLD carries a 0.40% expense ratio and is the vehicle of choice for traders because of its liquidity and options market. Money leaving GLD for lower-fee funds is tactical capital being replaced by buy-and-hold capital. Total exposure to gold did not shrink.
Flows running ahead of price is a setup that has resolved upward before. Persistent accumulation tightens available supply, and once the macro headwind eases, the price adjusts quickly because holders are not looking to sell. The August session in which gold gained 4.3% happened under those conditions.
The risk in the data is the overhang. An estimated 298 tonnes of ETF gold was bought above current prices during the run to the January record. Those holders are sitting on losses, and many will sell into strength to exit near breakeven. That supply is one reason rallies have stalled at each resistance level, and it will be present at $4,330, $4,443 and $4,700.
A second risk is a change in flow direction. If the 10-year yield moves decisively higher and real returns on Treasury inflation-protected securities climb further, North American redemptions could exceed the first-half total. Central bank buying would cushion the fall and might not prevent a break of $4,000.
Weekly flow figures for the first days of October, due this week, will show whether the $3.8 billion September pace is holding. A weekly inflow above $1 billion with the price near $4,150 would be a strong sign of accumulation.
Silver at $61.34: Outperforming and Fragile
Silver is the stronger of the two metals on the day and the more volatile on the week. Spot trades at $61.34 an ounce after bouncing from $59.96. December futures are at $62.19, up 2.94%. The rebound leaves silver under resistance at $61.72 to $62.00, a zone that capped last week's attempts.
The gold-to-silver ratio stands at 67.8. It was above 80 for much of 2025 and compressed sharply during silver's run to $77.80 in May. A ratio in the high 60s is low by the standards of the past decade and shows silver has held its relative gains even as both metals corrected.
Silver's support comes from two sources gold lacks. Industrial demand, led by solar panels and electronics, has kept the physical market in deficit for several years. Recycling is increasing in response to high prices and has not closed the gap. The metal also benefits more than gold when equity markets rise, because it trades partly as an industrial commodity, and the Nasdaq reached an intraday record on Friday.
The same features make it vulnerable. Silver fell harder than gold in the September 28 sell-off and failed to hold above $62.00 afterward. The daily chart shows a triangle pattern with negative price action, and $60.00 is the level that defines it. A close below $59.96 would break the triangle to the downside and target the mid-$50s, a move that would drag gold with it.
For gold forecasting, silver serves as a leading indicator of risk appetite within precious metals. When silver leads on the upside, as it did in August, gold rallies tend to extend. When silver fails at resistance while gold is flat, as it did last Tuesday, weakness in gold follows within days.
Today's 2.9% gain in silver futures against 0.65% in gold is a constructive sign. It suggests speculative money is returning to the sector after Friday's jobs data. The confirmation would be a silver close above $62.00, which would likely coincide with gold testing $4,191 to $4,200.
Platinum-group metals and copper have traded with industrial sentiment and offer no clear read for gold.
Silver's September high near $67 and its position 21% below the May peak mirror gold's own drawdown. Both metals need lower yields. Silver simply reacts faster and further in each direction, and a break of $62.00 or $60.00 will likely front-run the resolution of gold's $4,110 to $4,230 range.
Read More
-
Yen Stalls at 160 Despite a 3% JGB and Tokyo Core CPI at 2.0% — Intervention Sits at 164, Friday's Payrolls Decide
02.09.2026 · TradingNEWS ArchiveEnergy
-
MELI Stock Gap to $1,843 High as Ibovespa Surges 8.76% and Rate-Cut Bets Lift a $16.4B Credit Book — $2,270 Upside Case
05.10.2026 · TradingNEWS ArchiveStocks
-
XRP-USD ($1.52) Coils Under a $1.55 Ceiling as Whales Add 1.6B Tokens and RLUSD Tops $2.4B — $1.60 Breakout in Focus
05.10.2026 · TradingNEWS ArchiveCrypto
-
Brent Crude Stays Above $100 and WTI Slides Toward $88 as Gulf Exports Top Pre-War Levels While Hormuz Remains Shut
05.10.2026 · TradingNEWS ArchiveCommodities
-
S&P 500, Nasdaq and Dow Futures Dip as 5.28% Yields Test Friday's Rally; PTC Soars 36%, INTC Falls 3.9%
05.10.2026 · TradingNEWS ArchiveMarkets
-
Pound Sterling at 1.3228 Pinned Near a 3-Month Low as the Dollar Index Hits 102.53
05.10.2026 · TradingNEWS ArchiveForex
Gold Miners: Newmont at $115.56 Ahead of October 22 Results
Mining equities are trading as a geared version of the metal with one difference: margins at $4,158 gold are still extraordinary.
Newmont (NEM), the largest producer and the only gold miner in the S&P 500, closed Friday at $115.56, up 0.78%, after a session range of $113.86 to $116.66. Volume of 4.0 million shares was well below the 7.4 million average. The stock sits 14.6% under its 52-week high of $135.29, set on August 25 when gold was near $4,700, and 52% above its low of $76.05 from October 2025. Market value is $121.8 billion.
Valuation is modest for a company with this profitability. Newmont trades at 14.6 times trailing earnings of $7.93 a share, with revenue of $25.8 billion and net income of $8.6 billion over the past 12 months, up 25% and 37%. It expects to sell 5.3 million ounces in 2026. Each $100 move in gold changes annual revenue by $530 million, nearly all of which reaches pre-tax profit.
The company reports third-quarter results after the close on Thursday, October 22. The quarter's average gold price was above $4,300, so earnings should be strong. The question for the stock is guidance on costs, where energy inflation from $100 oil is the main pressure, and the pace of capital returns. The large producers have been returning record cash to shareholders in preference to building new mines.
Insider activity was small and routine: the chief executive sold 3,882 shares and another officer 3,000 shares on October 1 at $114.81.
The VanEck Gold Miners ETF (GDX) traded at $86.77 on Friday, flat on the day, with a range of $86.33 to $88.69. Its 52-week range is $68.13 to $117.18, leaving it 26% below the high. Newmont is the largest holding at 11.1%.
Miners have fallen further than bullion from the August peak, which is typical. They carry equity-market risk and operating leverage, and higher bond yields raise the discount rate applied to long-lived assets. A GDX decline of 26% against gold's 12% decline from the August high implies leverage of 2.2 times.
That leverage works in both directions. If gold reclaims $4,330, miners should outperform sharply. If gold breaks $4,000, the group has room to fall toward its lows. At current prices the equities discount a gold price well below spot, and they offer better value than the metal for investors who accept the volatility.
Technical Structure: A Head-and-Shoulders Under Falling Averages
The chart is bearish on the daily and four-hour timeframes and shows early signs of selling fatigue on shorter ones.
XAU/USD trades below all of its main moving averages. The 20-day average is falling and sits near $4,285, which matches last week's high. The 50-day simple average is in the $4,330 area and was lost during the late-September decline. Price is $172 beneath the 50-day, and every average is sloping down.
The dominant pattern is a head-and-shoulders top with a neckline at $4,230. That level was the September 16 low, broke on September 28, and was retested from below on Friday at $4,227. A neckline that turns from support to resistance on the first retest confirms the pattern. Measured from the month's high at $4,443, the pattern projects to $4,017, which sits just above the $4,000 round number and the rising long-term trend line near $3,999.52.
On a shorter timeframe, gold broke below the lower boundary of a bear flag on the two-hour chart last week. A descending trend line from the August peak caps price in the $4,200 to $4,230 zone, reinforcing the neckline.
Fibonacci analysis frames the support. The 78.6% retracement of the June-to-August advance is at $4,103. Last week's low of $4,111 held $8 above it. A retracement that deep rarely holds without a full retest of the origin of the move, which in this case is the June low at $3,942.
Momentum is where the picture softens. On the four-hour chart, the relative strength index made a higher low while price made a lower low, a bullish divergence. RSI sits just below its midpoint, and the moving average convergence divergence indicator is mildly positive. The stochastic oscillator on the daily chart is turning up from oversold. These readings suggest the selling is losing force without yet indicating a reversal.
Aggregate daily signals stand at 15 sell, 2 neutral and 5 buy, an improvement from a strong-sell reading earlier last week.
Positioning adds a contrarian note. Retail traders are 65.6% short. Crowded short positioning directly above a well-tested support raises the odds of a squeeze, particularly if a macro trigger arrives.
The summary is a confirmed bearish pattern with a target near $4,017, a market that is oversold and heavily shorted above a five-session floor, and a single level, $4,230, whose recapture would invalidate the bearish setup.
The Level Map
Resistance is layered closely.
The first test is $4,160 to $4,170, today's high. Above it, $4,191 is the next reference, followed by the $4,200 to $4,204 band that combines the round number with the daily pivot resistance. A trend-line break is signaled above $4,214. The key level is $4,227 to $4,230: Friday's high, the September 16 low and the neckline. A daily close above $4,230 cancels the head-and-shoulders and shifts the near-term bias to neutral.
Beyond that, $4,246 to $4,250 is minor resistance. The falling 20-day average and last week's high coincide at $4,285. The September 25 high is at $4,315, the 50-day average at $4,330 and a broader supply zone runs from $4,365 to $4,400. The September high at $4,443 is the level that would restore a bullish trend.
Support begins at $4,139 to $4,140, the Thursday low and Friday close. Next is $4,123, which has held several intraday tests, and then the critical band from $4,103 to $4,112 containing the week's low, the two-month low and the 78.6% retracement. A daily close below $4,103 is the bearish trigger.
Under that floor, $4,073 is first support, followed by $4,050 and $4,027 to $4,030. The $4,000 to $4,017 zone holds the round number, the pattern target, the trend line and the late-July lows. It is the level central banks and long-term allocators have defended all year. Below $4,000, the June low at $3,942 and the October 2025 swing low at $3,886 are the remaining supports.
Volatility estimates put this week's expected range at $3,960 to $4,320, a span of $360.
Distances from the current $4,158: the neckline is 1.7% above, the floor is 1.2% below, and the $4,000 zone is 3.8% below. The 50-day average is 4.1% above.
The asymmetry matters for positioning. A short entered at $4,200 with a stop above $4,230 risks $30 to target $4,017, a gain of $183. A long entered at $4,115 with a stop under $4,100 risks $15 to target $4,230, a gain of $115. Both trades offer attractive ratios at the edges of the range. In the middle, where price sits now, neither does.
For holders of GLD, each $10 in spot gold is roughly $0.92 in the fund. The range edges translate to $378 and $389 per share, with the $4,000 floor near $368.
Catalysts and Scenarios for the Week
Four scheduled events will move yields and therefore gold.
The ISM services index is due at 10:00 a.m. ET today. The headline is expected at 55.2, prices paid at 73.0 and employment at 49.0. A prices reading above 73 would lift yields and press gold toward $4,123. A soft reading with weak employment would support a run at $4,191.
Wednesday at 2:00 p.m. ET brings the minutes of the September Fed meeting, at which rates were raised. The release is listed on the Federal Reserve's calendar. Markets will look for how many officials favored additional hikes and how the committee viewed the rise in long-term yields. In August, hawkish minutes failed to stop a gold rally because yields were falling for other reasons, which shows the bond market matters more than the text.
Thursday's weekly jobless claims will test whether Friday's payrolls weakness is persisting. Friday's University of Michigan survey includes inflation expectations. Three regional Fed presidents speak during the week.
The bearish scenario begins with a hot ISM prices figure or hawkish minutes sending the 10-year above 5.30%. Gold breaks $4,103 on a closing basis, stops under the two-month low are triggered, and the head-and-shoulders target near $4,017 comes into play within days. A test of $4,000 follows, where official and allocator buying is expected to appear. A close below $4,000 would open $3,942.
The neutral scenario is another week inside $4,110 to $4,230. Yields stay elevated without breaking higher, the dollar holds its range, and dip buyers and rally sellers keep trading the edges. This is the most likely outcome while the 10-year sits between 5.20% and 5.30%.
The bullish scenario needs yields to fall. A weak ISM, dovish minutes or a drop in oil on Hormuz progress pulls the 10-year under 5.20% and the dollar index below 101.50. Gold closes above $4,230, shorts cover and the 65.6% retail short position unwinds. Targets are $4,285 and then the 50-day average at $4,330. A further Treasury intervention in the bond market, as in August, would accelerate this path.
Weighing them, the range scenario carries the highest probability for the week, with the downside break more likely than the upside break while the pattern is intact. An October hold by the Fed is 80% priced, so that alone will not lift gold. The trigger has to come from the long end of the curve.
Verdict: Hold, With a Bearish Lean Below $4,230 and a Buy Zone at $4,000 to $4,030
The near-term forecast for XAU/USD is bearish to neutral. Gold is trading under a confirmed head-and-shoulders neckline, below falling 20-day and 50-day averages, with a pattern target at $4,017. It failed at $4,227 on the most supportive data of the month. The 10-year Treasury yield is at 5.28% and rising, the dollar index is firm at 102.17, and Brent at $102.90 keeps inflation pressure alive. Those conditions have defined every leg lower since August, and none has changed.
The medium-term forecast is constructive. Central banks bought a record 289 tonnes last quarter and intend to buy more. U.S. gold funds added $3.8 billion in September while the price fell. Global ETF holdings are at an all-time high of 4,189 tonnes. The Fed is 80% likely to hold in October, and gold has a record of bottoming before tightening cycles end. The $4,000 level has survived three tests this year, and the buyers who defended it are price-insensitive.
Those two views point to a specific plan. For existing holders, the call is hold. A 25.7% drawdown from the record has already been absorbed, the structural case is intact, and selling $150 above a floor backed by official demand is poor timing.
For new money, patience is the better course. The current price of $4,158 is the middle of the range and offers no edge. The preferred entry is the $4,000 to $4,030 zone, where the pattern target, the long-term trend line and the central bank bid converge. A stop on a daily close below $3,940 limits the risk to 2%. The first upside objective from there is $4,230 and the second is $4,330, gains of 5% and 8%.
The alternative entry is confirmation. A daily close above $4,230 would cancel the bearish pattern and justify buying strength with a stop under $4,160, targeting $4,285 and $4,330.
For traders, the range is the trade. Sell rallies into $4,200 to $4,227 with stops above $4,235. Buy dips to $4,110 to $4,123 with stops under $4,100. A close below $4,103 turns the tactical view outright bearish toward $4,017.
Miners offer the better risk-adjusted exposure at these levels for those willing to hold through Newmont's October 22 report, given a 14.6 multiple on earnings generated well above current cost structures.
The rating is hold on gold at $4,158, sell on rallies below $4,230 for short-term accounts, and buy between $4,000 and $4,030 for investors. The direction of the 10-year yield from 5.28% will settle the range, and a move in gold to $4,017 before $4,330 is the more probable sequence.