WTI Clears $83 and Brent $88 With the SPR at a 43-Year Low Before the EIA Revision
Trump's new demands on Tehran, including compensation for those Iran has killed | That's TradingNEWS
Key Points
- WTI at $83.33 and Brent at $88.89, a fourth consecutive gain, with the Brent-WTI spread at $5.56.
- US Strategic Petroleum Reserve below 300 million barrels, the lowest level since 1983.
- Above $86 WTI targets $90–$95; a Hormuz deal and a close below $79.50 opens the mid-$70s.
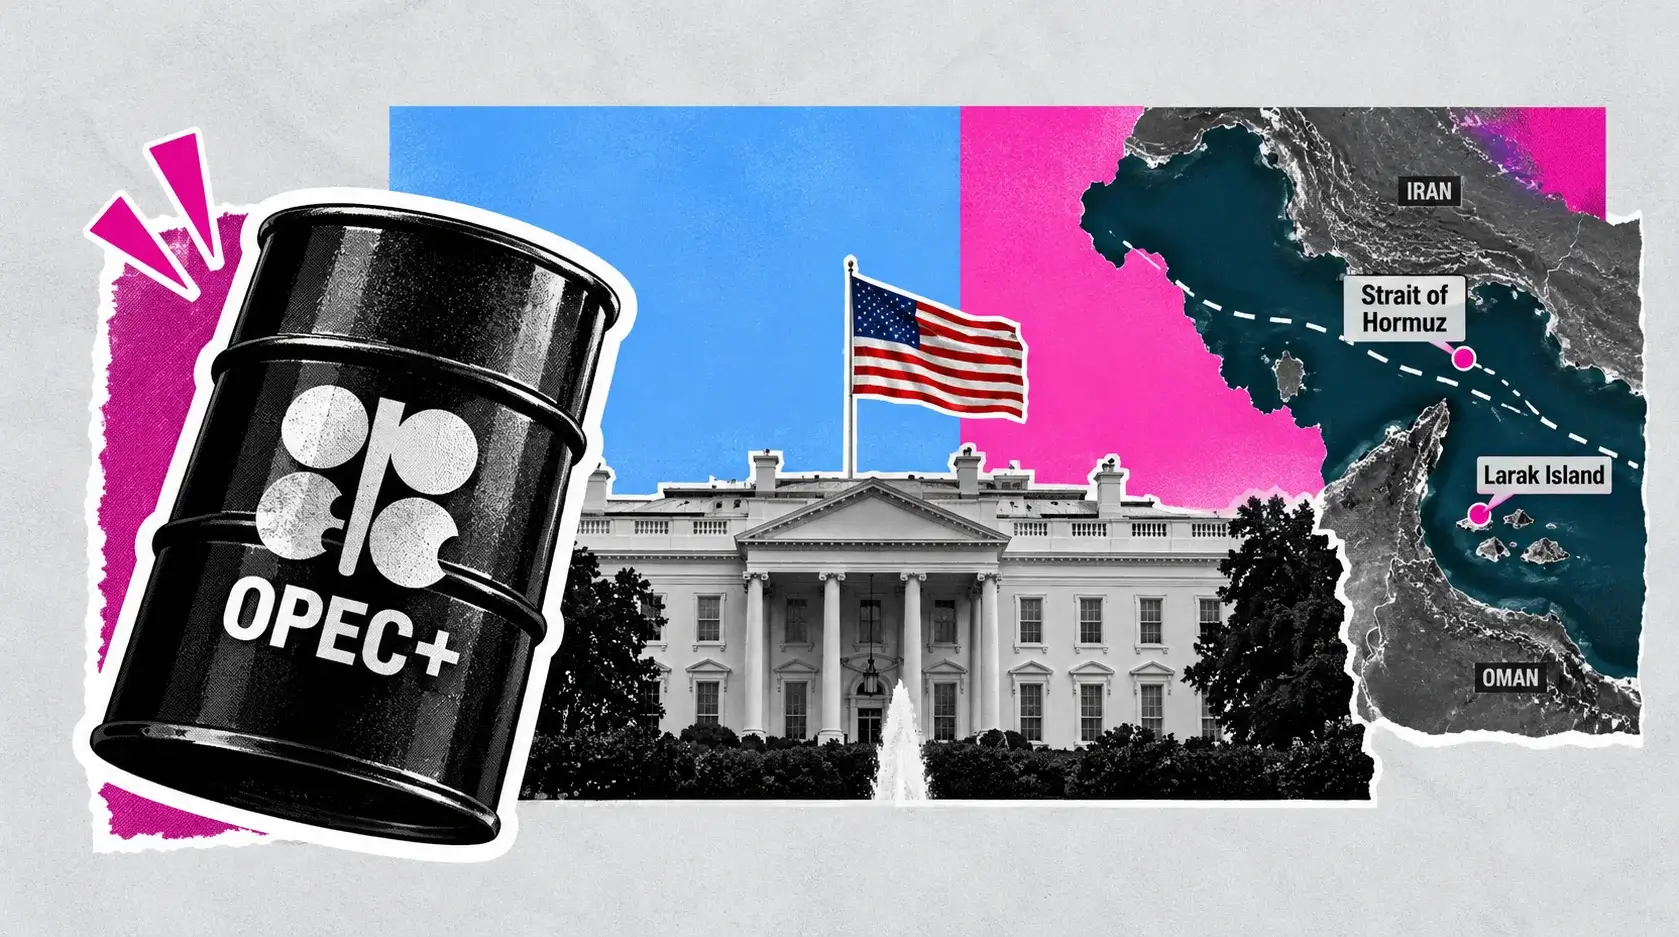
West Texas Intermediate traded above $83 a barrel on Tuesday at $83.33, up 1.45%, extending gains for a fourth consecutive session. Brent reached $88.89, up 1.33%, after clearing $86 on Monday. The move is a pure geopolitical repricing: hopes for a US-Iran agreement to fully reopen the Strait of Hormuz have continued to fade, and every attempt at a negotiated path has produced a wider gap between the two positions rather than a narrower one.
President Trump introduced sweeping new demands on Tehran, including compensation for people the Islamic Republic has killed in conflicts, after Iran reiterated its own calls for reparations as part of negotiations to wind down the war. He also indicated he was prepared to allow economic pressure on Iran to intensify rather than launch new military strikes to force the waterway open. Iranian foreign minister Abbas Araghchi stated Tehran is not currently holding direct talks with Washington and that reopening Hormuz would require the United States to lift its blockade of Iranian shipping and provide compensation for damages.
Iran and Oman have yet to finalize an agreement to reopen the strait. Over the weekend a tanker operated by Abu Dhabi National Oil Company came under attack inside Hormuz, and Houthi militants claimed responsibility for a strike on Saudi Arabia's Jazan refinery.
The inventory backdrop has become the second pillar of the bid. Crude held in the US Strategic Petroleum Reserve has fallen below 300 million barrels, the lowest level since 1983. The buffer that would ordinarily absorb a supply shock of this type has been drawn down to a four-decade low while the shock remains active.
Oil surged more than 20% during July. The path through 2026 has been violent: Brent opened the year near $62, peaked at $138 on April 7 with an April average of $117, eased below $70 by mid-June following a June 18 memorandum of understanding between the United States and Iran, and then reversed higher as renewed strikes broke the agreement in mid-July. By July 16 Brent traded near $84.50 and WTI near $79.50.
The single most consequential event on today's calendar is not a price move. The US Energy Information Administration publishes its August Short-Term Energy Outlook, and the July edition was built on an assumption that has since collapsed.
WTI Above $83 On A Fourth Straight Session Of Gains
The four-session sequence is the shortest-term evidence that positioning has shifted from fading the geopolitical premium to accumulating it.
WTI at $83.33 sits roughly $3.80 above where it traded on July 16 and $21 above the low reached in the June de-escalation. Brent at $88.89 has advanced comparably. The front-month September WTI contract traded at $82.25 in the premarket session, which places the curve in a shallow structure consistent with a market pricing near-term tightness rather than a sustained deficit.
The spread between Brent and WTI sits at $5.56, or 6.7% of WTI. That differential has widened from historical norms near $3 to $4 because the disruption is concentrated in seaborne Gulf crude, which prices off Brent, while US production remains fully available and prices off Cushing. A widening Brent-WTI spread is the cleanest single measure of how much of the current price reflects Middle East supply risk rather than global demand.
The composition of the four-day advance is informative. Each session added between 1% and 2% rather than delivering a single gap higher, which describes accumulation through negotiation headlines rather than a panic response to a discrete event. Markets that grind higher on deteriorating diplomacy carry more durable positioning than markets that spike on an attack.
Refined products confirm the move. Gasoline futures traded at $3.151, up 0.95%. Heating oil reached $4.2297, extending a rally. The strength in distillate specifically matters because heating oil functions as the diesel proxy, and diesel tightness transmits into freight, agriculture, and industrial costs faster than gasoline transmits into consumer prices.
European natural gas at €61.64 rose 1.39%, and US Henry Hub held $2.776. That divergence separates the crude story from the gas story: the Hormuz closure constrains liquids and LNG cargoes bound for Europe while leaving domestic US gas supply untouched.
Trump's New Demands Removed The Nearest Path To A Deal
The negotiating positions have moved apart rather than together, and the specifics establish why a near-term resolution is not available.
Iran's demands to reopen the waterway cover an end to hostilities, a halt to military actions, withdrawal of US forces from the region, compensation for war damages, lifting of sanctions, and release of frozen assets. Araghchi has stated Tehran is not holding direct talks and requires the United States to lift its blockade of Iranian shipping before negotiations resume.
Trump's response added a demand for compensation for people Iran has killed in prior conflicts, which introduces a claim that has no precedent in the negotiation and no mechanism for resolution. He simultaneously stated a preference for allowing economic pressure to accumulate over launching new strikes, which removes the escalation that would force a resolution in either direction.
That combination produces the specific market condition currently priced: a conflict that neither escalates toward a military resolution nor de-escalates toward a commercial one. The premium in the crude price reflects duration rather than intensity. Traders are pricing a closure that persists rather than a closure that worsens.
The June 18 memorandum of understanding demonstrates how quickly that can invert. That agreement pushed Brent below $70 in early July as traffic through the strait increased and shut-in production began returning. Renewed strikes in mid-July broke it, and the premium rebuilt within weeks.
The structural read is that any headline confirming a credible navigation system between Iran and Oman, with tanker flows increasing absent fresh attacks, removes multiple dollars from the barrel immediately. The June episode provides the real-world measurement: roughly $15 came out of Brent within four weeks of the signing.
The reverse risk is that the demands harden further. A negotiation in which each side adds conditions rather than conceding them is a negotiation that extends, and an extended closure converts a price premium into an inventory problem.
The Jazan Strike And An ADNOC Tanker Attack Widen The Risk
Two weekend incidents expanded the geography of the disruption beyond the strait itself, which is the development most likely to be underpriced.
Houthi militants claimed responsibility for an attack on Saudi Arabia's Jazan refinery. Jazan sits on the Red Sea coast, entirely outside the Strait of Hormuz, and represents Saudi Arabia's newest large-scale refining complex. A successful strike on Red Sea infrastructure demonstrates that the disruption is not confined to a single chokepoint and that Saudi export capacity routed away from Hormuz carries its own risk.
That matters specifically because Red Sea routing has been the primary mitigation for Hormuz closure. Gulf producers with pipeline access to Red Sea terminals can bypass the strait, and that capability is what allowed the market to adjust to the initial shock. Attacks on Red Sea refining and export infrastructure close the alternative.
The attack on an Abu Dhabi National Oil Company tanker inside the strait carries a different implication. ADNOC operates from the UAE, which has maintained a distinct posture from Saudi Arabia through the conflict, and targeting its vessels widens the set of parties with direct exposure. Insurance and charter markets reprice on incidents involving specific national operators rather than on aggregate risk.
Earlier in the escalation, Houthi attacks in the Red Sea and Saudi Arabia's retaliatory actions against Iran-aligned forces had already heightened risk across key maritime trade routes. The weekend incidents extend that pattern.
The mitigation that has functioned so far combined weaker demand, emergency stock releases, rerouted Gulf exports, and higher production outside the Middle East. Three of those four are finite. Emergency releases have driven the US reserve to a 43-year low. Rerouting depends on infrastructure now under attack. Demand weakness reverses when prices fall.
Only non-Middle East production growth is structural, and it is the reason the market has not priced a repeat of April's $138 print.
The Reserve Below 300 Million Barrels Is The Lowest Since 1983
The Strategic Petroleum Reserve falling below 300 million barrels is the datapoint that changes the risk distribution for the remainder of the conflict.
That level is the lowest since 1983, before the reserve reached its designed capacity. The buffer exists specifically to absorb the class of disruption currently underway, and it has been consumed defending against the first six months of it.
The consequence is asymmetric. A reserve at capacity provides the market with a credible response to a further escalation, which caps upside pricing. A reserve at a four-decade low provides no such response, which means the next incremental disruption prices directly into the forward curve rather than into an expectation of official intervention.
The rebuilding requirement compounds it. Restoring the reserve toward its historical range requires sustained purchases at prices the government would prefer to avoid, and those purchases become incremental demand in a market the EIA expects to move back toward oversupply. That creates a structural bid beneath prices in 2027 that did not exist in the pre-conflict baseline.
US commercial crude inventories provided an additional bullish catalyst during the July advance through a decline in stocks. The weekly petroleum status report arrives Wednesday, and it lands in the same window as the July CPI print, which compounds the volatility.
The interaction between the reserve level and the negotiation is direct. A negotiating position built on allowing economic pressure to accumulate assumes the United States can absorb elevated prices for longer than Iran can absorb the blockade. A reserve at 1983 levels weakens that assumption by removing the tool that would ordinarily manage the domestic cost of the strategy.
Commercial inventories, refinery utilization, and product stocks now carry the entire adjustment burden. Gasoline inventories have been running low enough to keep crack spreads elevated, which is the mechanism converting crude strength into pump prices without any further crude appreciation.
The July Outlook Assumed A Reopening That Never Happened
The EIA's most recent published forecast is built on a premise the market has since invalidated, and understanding that gap is the key to reading today's release.
Per the EIA's Short-Term Energy Outlook released July 7, 2026, the agency's global oil market assumptions began from the June 18 memorandum of understanding between the United States and Iran to end the conflict and open the Strait of Hormuz. Following the signing and increased traffic through the strait, the EIA raised its expectations for global oil production for the remainder of the year, projecting most crude production to return to near pre-conflict averages by the end of 2026 and the majority of shut-in production back online during the first quarter of 2027.
On that basis the agency cut its price path substantially. The Brent spot price averaged $85 per barrel in June, down $22 from May and $32 from the April 2026 peak. The July forecast placed Brent at an average of $74 per barrel in the third quarter of 2026, a reduction of $27 from the June outlook, with Brent falling to an average of $65 in 2027.
The full-year revisions were larger. Brent for 2026 moved to $82 from $95, a 14% reduction. The 2027 figure moved to $65 from $79, an 18% reduction. Retail gasoline for 2026 moved to $3.64 from $3.90, and 2027 to $3.09 from $3.64.
Brent currently trades at $88.89. Third-quarter to date has averaged well above the $74 projection, and the strait has not reopened. The forecast that produced those revisions rested on an agreement that renewed strikes broke within four weeks of its signing.
That is not a criticism of the modelling. It is a measurement of how much the forecast has to move. The July outlook was completed July 1, before the mid-July escalation, and it explicitly conditioned its price path on flows normalizing.
Today's August Outlook Has To Revise Brent Up From $74
The August Short-Term Energy Outlook publishes today, and the revision it must deliver is the most consequential scheduled data event in the oil market this month.
The July edition projected Brent averaging $74 in the third quarter. The quarter is now six weeks old with Brent trading at $88.89 and having spent the period between roughly $84 and $89. Reconciling the realized average with the projected average requires either a substantial upward revision to the quarter or an implausible collapse across the remaining six weeks.
The production assumption faces the same problem. The July forecast expected most crude output to return to near pre-conflict averages by the end of 2026 and the bulk of shut-in production online by the first quarter of 2027. The strait remains closed, Iran and Oman have not finalized a navigation agreement, and Red Sea alternatives are now under attack. The timeline for shut-in production returning has extended.
The inventory path follows from it. The July outlook projected global inventories falling by 2.2 million barrels per day in the third quarter, down sharply from the more than 7 million barrels per day in the June forecast and 5 million in the second quarter. That moderation depended on the reopening. Without it, the draw runs closer to the June estimate than the July one.
The 2027 framing is where the largest revision risk sits. The July outlook expected rising production to shift the market back to the pre-conflict state of oversupply, with OECD commercial crude and liquids inventories reaching 3,021 million barrels against a prior projection of 2,572 million, a 17.4% increase. World oil production for 2027 was placed at 81.4 million barrels per day against 75.7 million in 2026.
If the closure persists into the fourth quarter, the 2027 oversupply thesis moves later and the $65 Brent average becomes difficult to sustain. That single number is what determines whether the current $88.89 print is a spike inside a bear market or the start of a repricing.
Global Inventories Drawing 2.2 Million Barrels A Day
The inventory arithmetic is where the fundamental case for and against current prices resolves.
The July projection of a 2.2 million barrel per day global draw in the third quarter, against 5 million in the second quarter, described a market normalizing. A 2.2 million daily draw across a 92-day quarter removes roughly 202 million barrels from global stocks. The June forecast of more than 7 million per day would remove above 640 million barrels across the same period.
The difference between those two paths is 438 million barrels, which is larger than the entire remaining US Strategic Petroleum Reserve. That is the scale of the uncertainty embedded in the reopening assumption, and it is why the price has moved $15 in each direction on negotiation headlines.
The pre-conflict baseline makes the contrast starker. Consensus for 2026 before the conflict pointed to Brent averaging $55 to $63 with a supply surplus of 2 to 4 million barrels per day. The market has moved from a projected 3 million barrel daily surplus to a 2.2 million barrel daily deficit at minimum, a swing above 5 million barrels per day in the balance.
OECD commercial inventories for 2026 were revised to 2,604 million barrels from 2,269 million, a 14.8% increase, reflecting the expected rebuild. Realized inventories will fall short of that path if the closure extends.
The structural offset remains intact and is the reason $138 is not the current price. US shale production reached a record 13.6 million barrels per day in 2025 and is projected at 13.8 million for 2026 and 14.0 million for 2027. US LNG exports move from 15.1 billion cubic feet per day in 2025 to 17.4 billion in 2026 and 18.6 billion in 2027. Non-Middle East supply is growing through the disruption.
The demand side has also cooperated with the adjustment. Weaker consumption in response to $100-plus prices during the second quarter reduced the deficit mechanically, and that elasticity remains available at current levels.
Read More
-
Yen Stalls at 160 Despite a 3% JGB and Tokyo Core CPI at 2.0% — Intervention Sits at 164, Friday's Payrolls Decide
02.09.2026 · TradingNEWS ArchiveEnergy
-
MELI Stock Gap to $1,843 High as Ibovespa Surges 8.76% and Rate-Cut Bets Lift a $16.4B Credit Book — $2,270 Upside Case
05.10.2026 · TradingNEWS ArchiveStocks
-
XRP-USD ($1.52) Coils Under a $1.55 Ceiling as Whales Add 1.6B Tokens and RLUSD Tops $2.4B — $1.60 Breakout in Focus
05.10.2026 · TradingNEWS ArchiveCrypto
-
Brent Crude Stays Above $100 and WTI Slides Toward $88 as Gulf Exports Top Pre-War Levels While Hormuz Remains Shut
05.10.2026 · TradingNEWS ArchiveCommodities
-
S&P 500, Nasdaq and Dow Futures Dip as 5.28% Yields Test Friday's Rally; PTC Soars 36%, INTC Falls 3.9%
05.10.2026 · TradingNEWS ArchiveMarkets
-
Pound Sterling at 1.3228 Pinned Near a 3-Month Low as the Dollar Index Hits 102.53
05.10.2026 · TradingNEWS ArchiveForex
US Production At 13.8 Million Barrels Is The Structural Offset
The reason this supply shock has produced $89 Brent rather than $138 Brent is domestic American production, and the numbers are specific.
US crude oil production reached 13.2 million barrels per day in 2024 and 13.6 million in 2025, and the July outlook projects 13.8 million for 2026 and 14.0 million for 2027. That trajectory adds 400,000 barrels per day across two years from a base that was already a record.
The distinction from prior supply shocks is complete. In every Middle East disruption before 2015, US production was declining and the country was a net importer of roughly 10 million barrels per day. The 1983 reserve level currently being tested was established when that condition prevailed. Today the United States produces 13.8 million barrels daily and exports both crude and refined products.
That structural change is why the Brent-WTI spread has widened to $5.56 rather than collapsing. American crude is physically unaffected by Hormuz, which caps how far the domestic benchmark can rise relative to the international one and provides an arbitrage that pulls barrels toward the disrupted market.
Natural gas reinforces it. Record US production is projected to keep Henry Hub near $3.67 per million British thermal units in 2026 and $3.49 in 2027, against European gas at €61.64 and rising. The transatlantic gas spread is the clearest available measure of how differently the two regions experience the same geopolitical event.
Electricity pricing carries the same signature. Wholesale power is forecast to average about $45 per megawatt hour this summer, lower than last summer, primarily on reduced natural gas delivered costs. An economy experiencing an oil shock while power prices fall is an economy where the shock is concentrated in liquids and transport rather than distributed across energy inputs.
The consequence for the inflation channel is that the pass-through reaches gasoline, diesel, and jet fuel rather than electricity and heating. That distinction determines which CPI components move Wednesday.
OPEC+ Policy Is Now Entirely Downstream Of Hormuz
The producer group has lost the ability to set the market, which is a condition without recent precedent.
OPEC+ announced production increases of 206,000 barrels per day for April 2026, calibrated against pre-conflict low inventories. That figure is now immaterial against the scale of the Hormuz shut-ins, which have removed multiples of it from available supply.
The group's future decisions depend entirely on the pace of strait normalization. Adding barrels while the chokepoint restricting their delivery remains closed accomplishes nothing, since the constraint is transit rather than wellhead capacity. Withholding barrels while prices sit at $89 invites demand destruction and accelerates non-OPEC substitution.
That leaves the group without a functional policy lever until the waterway opens, at which point it faces the opposite problem: a simultaneous return of shut-in production, the resumption of scheduled unwinds, and a market the EIA expects to move back toward oversupply.
The 2030 framing has not changed. OPEC's demand projections point toward 106.5 million barrels per day by 2030, and the multi-year stock rebuilding requirement following this episode provides a structural floor beneath medium-term prices. Mainstream forecasts converge on a $60 to $75 Brent range by 2028 to 2030, with WTI $5 to $10 below, as energy transition pressures and flattening production costs cap the upside.
The near-term implication is that no producer decision arrives to change the current price. The variables that matter are the negotiation, the tanker flows, the inventory draw, and today's revised outlook. Production policy is a 2027 story.
Longer-term consensus caps Brent at $65 to $75 through 2035 on slower electric vehicle adoption combined with persistent demand from Asian emerging markets. The key risk in that framing runs both directions: adoption fast enough to accelerate the demand peak toward $50 scenarios, or slow enough to hold oil above $70 through the decade.
Gasoline At $3.15 And Distillate At $4.23 Carry The Pass-Through
The refined products complex determines whether the crude move reaches consumer prices, and the current configuration says it does.
Gasoline futures at $3.151 rose 0.95%. Heating oil at $4.2297 extended a rally. The July outlook projected retail gasoline averaging $3.80 per gallon in the third quarter, down from more than $4.20 in the second quarter, falling to around $3.40 in the fourth quarter and below $3.10 as a 2027 annual average.
Those projections assumed crude declining. With Brent at $88.89 against a $74 third-quarter forecast, the retail path shifts higher. The EIA identified the mechanism explicitly: the crude-driven decrease in pump prices would be partly offset by rising wholesale and retail margins, with low gasoline inventories keeping crack spreads elevated.
Low product inventories combined with elevated crude produces the worst configuration for the consumer. Crack spreads that were expected to narrow as inventories rebuilt and summer demand ended instead stay wide, which means the retail price captures both the crude increase and the margin expansion.
Heating oil at $4.2297 is the number that reaches the broader economy. Distillate prices set freight rates, agricultural input costs, and industrial fuel expense. American Airlines fell 5.90% to $15.00 on Monday, which is the equity market's direct read on jet fuel at these distillate levels.
The 2026 retail gasoline projection of $3.64 per gallon, against $3.10 in 2025 and $3.31 in 2024, already implies a 17.4% year-over-year increase. Realized prices tracking above the third-quarter forecast push that figure higher.
For the July CPI print arriving Wednesday, the relevant question is whether energy stabilized or rose during the month. June delivered a 0.4% monthly decline in headline US prices, the largest since April 2020, driven entirely by falling energy costs. July removes that contribution. Consensus places headline at 0.2% month over month and 3.4% annually, with core at 0.2% and 2.5%.
The $138 April Peak And The $62 January Low Frame The Range
The 2026 price history establishes the boundaries within which any forecast must operate, and the range is extraordinary.
Brent opened the year near $62 in a market pricing structural oversupply. It peaked at $138 on April 7 following the US-Israeli military operation against Iran that began in late February, averaging $117 for that month. Crude traded at or above $100 for most of the second quarter. Prices eased through May and June on de-escalation, falling below $70 by mid-June after the June 18 memorandum. Renewed strikes in mid-July pushed the market higher again, and Brent reached $84.50 by July 16 before advancing to $88.89.
That is a 123% peak-to-trough range within a single calendar year. Brent at $88.89 sits 35.6% below the April peak and 43.4% above the January low, roughly at the midpoint.
The projected August range for WTI spans $67.93 to $106.74, a spread of 57% measured from the low. WTI at $83.33 sits 22.7% above the projected floor and 21.9% below the projected ceiling, which is close to exact symmetry.
That symmetry is the honest characterization of the current setup. The market has priced a persistent closure without pricing an escalation, and it has not priced a resolution. Both tails remain open and roughly equally distant.
The technical structure has confirmed the regime change. Monthly indicators on both Brent and WTI flipped from a strong negative reading in early 2026 to a positive one by July, and moving averages across all timeframes now signal upward momentum on the monthly chart. That is the trend-following confirmation of a geopolitical reversal rather than an independent signal.
The counterfactual matters for risk management. Removing the war premium entirely from a market where the EIA expects supply to exceed consumption and inventories to build sharply produces a plausible WTI level below $60. That is not a forecast; it is the measure of how much of the current price is conflict.
Energy Equities Led The Dow While Semiconductors Bled
The equity market's response identifies where the crude move is being monetized and where it is being paid for.
Chevron rose 4.38% Monday, the largest gain among Dow components. Exxon Mobil added 4.41% to $159.79. Transocean climbed 8.75% to $5.72. National Energy Services Reunited gained 23.33% to $35.79. Against that, Nvidia fell 2.88%, Intel dropped 4.06%, and the Nasdaq Composite gave back 0.32%.
The Dow declined just 61 points to 53,976 because those two forces cancelled. The S&P 500 closed at roughly 7,753, five points below its record. That is not a market pricing an energy crisis. It is a market rotating into crude-linked cash flow while marking down duration.
The mechanism connecting the two is the rate path. Money markets now price 22 basis points of Federal Reserve tightening by the end of 2026, up from 17 basis points on Friday, and that five-basis-point shift occurred entirely because of crude. The 10-year Treasury yield at 4.726% approaches a seven-month high. The Dollar Index holds 99.826.
Oil at $89 Brent is therefore doing two things simultaneously: transferring cash to producers and raising the discount rate applied to everything else. Energy equities capture the first effect. Semiconductors pay for the second.
For the oil market itself, the equity signal carries information about expected duration. Integrated producers rallying 4% in a single session indicates the market expects the price to persist long enough to affect reported earnings, not merely to spike. Oilfield services gaining 8% to 23% indicates expectations of capital spending responding, which is a multi-quarter view.
The Federal Reserve's position completes the loop. Cleveland Fed President Beth Hammack stated Monday that bringing inflation down will take more than a single rate increase. A supply shock that monetary policy cannot address at its source, met with a central bank signalling tightening, is the configuration that produced the June de-escalation rally and would produce its reversal.
Technical Structure: $80 Support, $86 Resistance, $106 Ceiling
The chart structure is straightforward because the range boundaries are recent and well tested.
WTI at $83.33 sits above the $82 area that contained the market during the last week of July and below the $86 level that capped the mid-July advance. That $4 corridor, representing 4.8% of price, is the operative box, and Tuesday's move above $83 places price in its upper half.
Immediate support sits at $82.25, the front-month premarket level, then $80, which is both a psychological reference and the area from which the current four-session advance began. Below $80, the July 16 level near $79.50 provides the next reference. Losing $79.50 opens the mid-$70s, which is where the EIA's third-quarter Brent forecast of $74 implies WTI should trade.
Resistance runs from $86 through the July high. Above that, the $90 handle for WTI has not been tested since the second quarter, and $100 marks where the market traded for most of that period. The projected August ceiling at $106.74 sits above every level touched since April.
Brent's structure mirrors it with different levels. Support at $86, the Monday breakout level, then $84.50, the July 16 reference. Resistance at $90, then the $100 area. The April peak at $138 is a historical reference rather than a live target.
The variable that overrides all of it is a single headline. A confirmed navigation agreement between Iran and Oman, with tanker traffic increasing and no fresh attacks, removes the premium in days rather than weeks. The June episode measured that at roughly $15 on Brent within four weeks, and the current premium is larger than it was then because the reserve buffer is smaller and the Red Sea alternative is under attack.
The inverse holds for escalation. An attack that closes Red Sea export capacity, or a strike on Saudi production rather than refining, removes the substitution that has capped this market. That scenario prices toward $100 rather than toward $106.
Oil Price Forecast: Levels, Scenarios And Invalidation
The base case holds WTI between $79.50 and $90 and Brent between $84.50 and $95 through the August outlook release and Wednesday's inventory report, with the closure persisting and neither side conceding.
The bullish path requires two confirmations. First, a close above $86 on WTI and $90 on Brent, which clears the mid-July highs and establishes the four-session advance as a trend rather than a retracement. Second, evidence that the inventory draw is running closer to the June projection of more than 7 million barrels per day than the July projection of 2.2 million. Clearing both opens $90 to $95 on WTI and $100 on Brent, with the projected August ceiling at $106.74 requiring an escalation beyond the current pattern of tanker and refinery attacks.
The bearish path requires one event and one confirmation. The event is a credible Iran-Oman navigation agreement with tanker flows increasing and no fresh attacks. The confirmation is a close below $79.50 on WTI. That sequence delivers the mid-$70s within days, aligning price with the EIA's $74 third-quarter Brent projection, and a full unwind of the war premium into a market the agency expects to move toward oversupply prices WTI below $60 across quarters rather than weeks.
Invalidation for the bullish case is a WTI close below $80. Invalidation for the bearish case is a WTI close above $86.
The medium-term structure remains bearish on fundamentals and bullish on geopolitics, and the tension is unresolved. US production at 13.8 million barrels per day in 2026 and 14.0 million in 2027, LNG exports rising to 18.6 billion cubic feet per day, OECD inventories projected to reach 3,021 million barrels in 2027, and Brent forecast to average $65 next year all describe a market that returns to surplus. Monthly technicals flipping positive, a reserve at 1983 levels, an active closure, and attacks extending into the Red Sea all describe a market that does not.
The resolution runs through today's August Short-Term Energy Outlook. The July edition conditioned a $27 cut to its third-quarter Brent forecast on a reopening that did not occur, and the revision it delivers will reset the fundamental anchor every trader is working against.
The trade into Wednesday is the $82.25 to $86 box on WTI. Above $86, the geopolitical premium extends and $90 becomes the target. Below $82.25, the market begins discounting a negotiated path and $79.50 comes into play. Today's outlook revision and Wednesday's inventory report determine which, with the July CPI print arriving in the same window to price the consequence.