Crude Rips To 4-Month Highs As The Bypass Line Stays Dark — 10M Barrels A Day Still Shut In
The IEA sees world oil demand falling 2.5 million barrels per day in 2026 while supply drops 5.7M | That's TradingNEWS
Key Points
- Brent traded at $108.15 and WTI at $103.59, both four-month highs, after a 9% rally last week.
- Global oil inventories have drawn 507 million barrels since February, averaging 2.8 million per day.
- Saudi output sits at its lowest since 1990 with the 7 million barrel per day East-West pipeline shut.
Oil opened the week with a gap and never filled it. Brent crude traded at $108.15 a barrel through the European session, up more than 2% and reaching a four-month high, after starting Monday at $104.60. West Texas Intermediate traded between $102.64 and $103.59, up 2.78% to 3.54%, after opening the day at $100.00. The November Brent contract was quoted at $107.54, up 2.8%, with WTI for October at $102.34, up 2.3%.
Neither move came from a data release. Both came from two separate de-escalation paths closing over the same weekend.
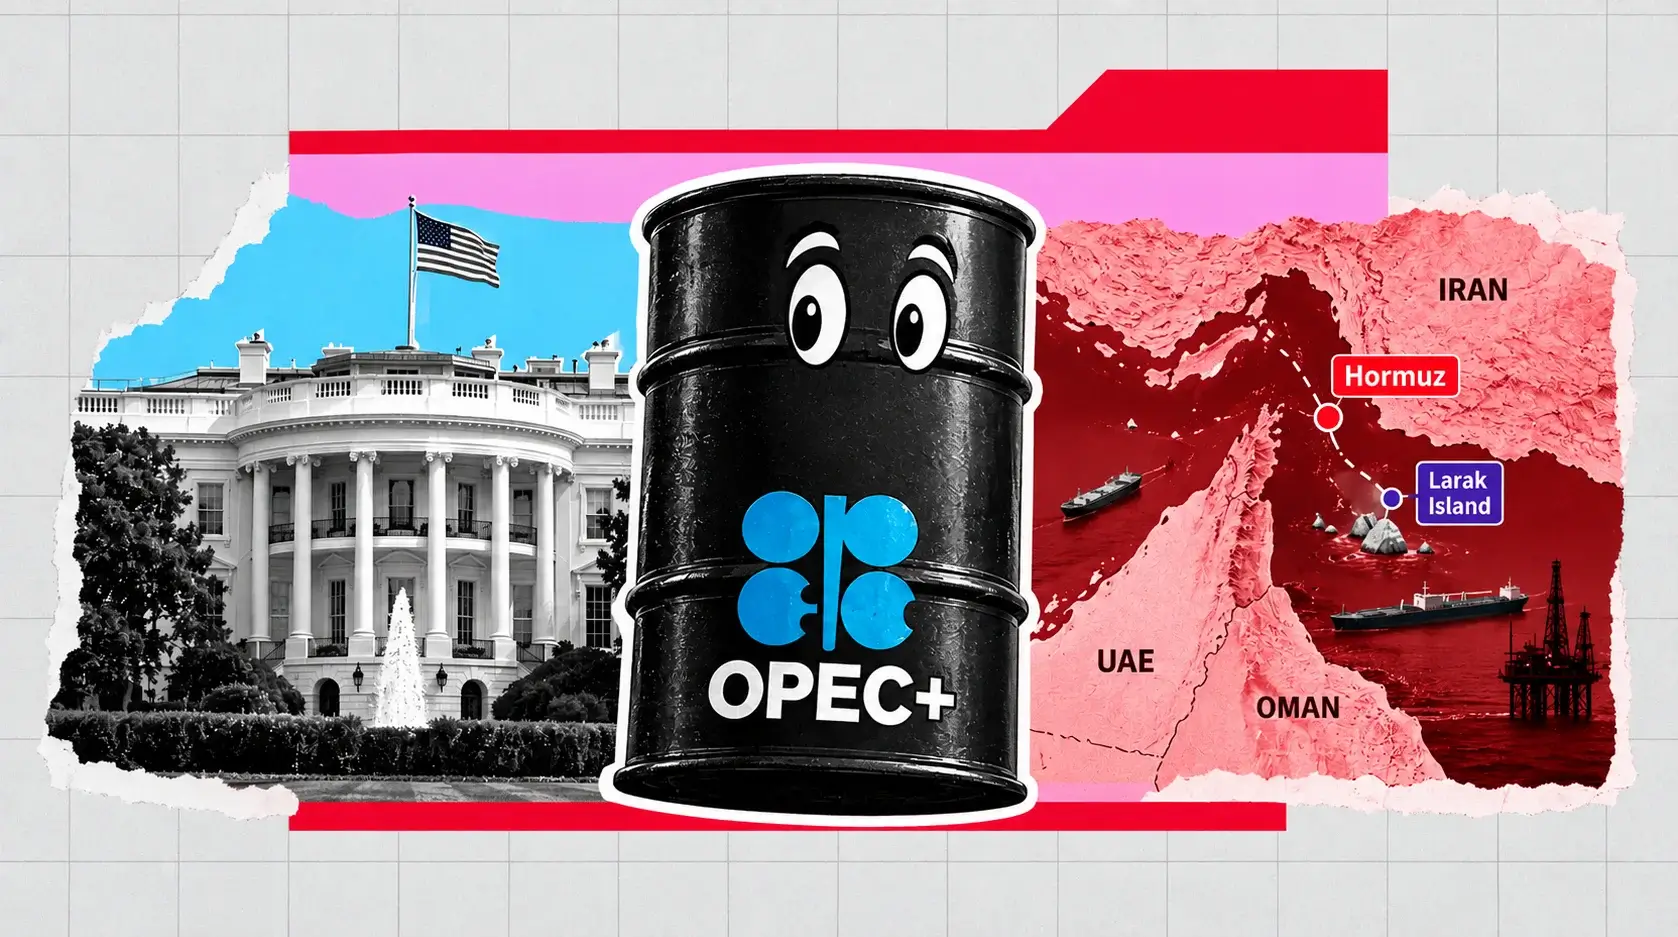
The first was Saudi Arabia's East-West pipeline, which remains shut after drone strikes on September 10 and 11 that the kingdom's foreign ministry attributed to drones originating from Iraq. That line carries crude across Saudi Arabia to the Red Sea port of Yanbu, has a nameplate capacity near 7 million barrels per day, and had been moving roughly 5 million barrels per day of crude rerouted away from the Strait of Hormuz. It is the primary bypass for a chokepoint that is already effectively closed. There has been no indication of when operations resume, with early assessments running three to five weeks.
The second was diplomatic. Oman's Foreign Minister Badr Albusaidi confirmed that a planned meeting between Gulf Cooperation Council states and Iran on establishing a temporary shipping corridor through Hormuz — due to be held in Salalah — had been postponed without a new date. Reports indicated Saudi Arabia held concerns over the proposal, and Bahrain said it would not participate.
That was the one event on the calendar capable of pulling the geopolitical premium out of crude. It was cancelled, and crude went up rather than down.
The cumulative picture is severe. Crude rallied more than 9% last week. WTI has gained 52.9% since the conflict began at the end of February and is up 78.5% year-to-date. Saudi crude output has fallen to its lowest level since 1990. The US Strategic Petroleum Reserve sits near a record low. China, dealing with dwindling domestic stockpiles, raised orders in August.
This is no longer a risk premium sitting on top of a balanced market. It is a physical shortage being rationed by price.
More Than 10 Million Barrels Per Day Of Gulf Output Is Shut In
The supply loss underneath this market is larger than almost any comparable disruption in the modern era, and the numbers deserve stating precisely.
Global oil production fell by 1.6 million barrels per day month-over-month to 100.1 million barrels per day in August, with more than 10 million barrels per day of Gulf output remaining shut in amid heightened security risks, according to the International Energy Agency's September Oil Market Report. Total oil supply is set to fall by 5.7 million barrels per day to 100.7 million barrels per day this year, with the expected recovery in the Gulf now deferred until 2027.
Ten million barrels per day is roughly 10% of global supply. For context, the 2019 Abqaiq attack disrupted approximately 5.7 million barrels per day and produced the largest single-day crude price increase in a decade — and that outage was resolved in weeks. This one has run since February.
The reason those barrels cannot move is not production capacity but export capability. The Iranian blockade on GCC oil exports through Hormuz forced producers to shut in wells because there is nowhere to send the crude. The East-West pipeline existed specifically to route around that problem, which is why its closure matters disproportionately: it removes the workaround rather than the primary route.
Tanker owners and exporters have grown increasingly cautious about transiting Hormuz following direct strikes on vessels in the area, with a vessel reported struck over the weekend. Iran-aligned Houthi forces have compounded the problem from the Red Sea side, targeting Saudi shipments, striking the King Khalid Air Base at Khamis Mushait, seizing the island of Perim in the Bab al-Mandab Strait and capturing the Greater and Lesser Hanish islands.
Both exits from the Gulf region are now contested simultaneously. That is the structural fact the market repriced on Monday.
Non-OPEC+ supply is growing but cannot fill the hole. The Americas add 1.4 million barrels per day in 2026 and 1 million in 2027 — meaningful, and roughly a seventh of what is offline. Production is set to rebound by 8 million barrels per day in 2027 on the IEA's forecast, which is the recovery everything downstream depends on.
Global Inventories Have Drawn 507 Million Barrels Since February
Inventories are what has kept this market functioning, and the buffer is visibly disappearing.
Global observed oil inventories fell by a further 95 million barrels in August — a draw rate of 3.1 million barrels per day — taking cumulative draws since February to 507 million barrels, or 2.8 million barrels per day on average. Oil on water volumes declined by 65 million barrels as tanker traffic out of the Middle East came under renewed pressure. Full detail is published in the IEA Oil Market Report.
The US Energy Information Administration puts the year-to-date global inventory decline at 400 million barrels and expects the drawdown to continue through the end of 2026, which is the agency's stated reason for holding its price forecast near recent levels rather than assuming normalization.
A 507 million barrel draw over seven months is the market financing a 10 million barrel per day supply loss out of storage. Storage is finite. Once the draw rate exceeds what commercial and strategic stocks can sustain, price becomes the only rationing mechanism available, and the move from $94 in March to $108 in September is that transition happening in slow motion.
The strategic buffer offers no help. The US Strategic Petroleum Reserve sits near a record low after years of drawdowns and incomplete refills, which removes the policy tool that has historically capped price spikes of exactly this type. China's inventory position has deteriorated enough that the country raised import orders in August — adding demand to a market already short rather than releasing supply into it.
The IEA's own framing is unusually blunt for an agency that writes carefully: with buffers shrinking and the global refining system stretched to its limit, the need for progress in resolving the Middle East conflict and the Russia-Ukraine war, now in its fifth year, is greater than ever to avoid further market tightening and demand destruction.
That is an institution saying the market has run out of shock absorbers.
Diesel Is The Real Crisis And US Distillate Stocks Fall Below 100 Million Barrels
The product market is tighter than the crude market, and diesel is where the shortage becomes a macroeconomic problem rather than a commodity story.
US distillate fuel oil inventories are forecast to fall below 100 million barrels in September and to remain beneath the 2021-2025 five-year low through the end of 2026 and most of 2027, according to the September Short-Term Energy Outlook. Distillate stocks fell below the five-year range in April and have not recovered since. The full document is published by the Energy Information Administration.
The cause is a loss of refined supply rather than a loss of crude. Large volumes of distillate output from the Middle East, Russia and China have come off the market simultaneously, and high US net exports of the fuel have drained domestic tanks to fill the international gap. Global distillate prices climbed throughout the summer in response to lower international refinery production, and tightness in the global market raises US prices while incentivizing more US exports — a feedback loop that keeps domestic inventories falling.
Refinery throughputs reached a summer peak of 81.4 million barrels per day in August, up 960,000 barrels per day month-over-month but 4.2 million barrels per day below the comparable prior period. Running refineries harder cannot close a gap created by refineries that have been taken offline entirely.
US diesel prices have set record highs on consecutive days. The EIA's own consumer forecast has retail diesel at $5.07 per gallon for 2026, easing to $4.40 in 2027, with retail gasoline at $3.84 per gallon for full-year 2026 against $3.10 in 2025 and a projected $3.35 in 2027.
Diesel matters more than crude for inflation transmission because it prices freight, agriculture, construction and rail. It is the input with the shortest lag into consumer prices, and it explains why the August energy index rose 2.1% on the month and sits 16.3% above year-ago levels — more than a third of the entire CPI gain.
The EIA assumes diesel cracks ease through mid-2027 only if Hormuz traffic normalizes enough for Saudi and Kuwaiti refineries to raise distillate exports. That assumption got weaker over the weekend.
The IEA Now Expects Global Oil Demand To Fall 2.5 Million Barrels Per Day In 2026
The demand side is where this market becomes genuinely confusing, and it is the reason forecasters keep calling for lower prices that keep not arriving.
World oil demand is forecast to decline by 2.5 million barrels per day in 2026 — a downgrade of 940,000 barrels per day from the prior month's estimate — as the continuing impasse between the United States and Iran delays any normalization of flows into next year. Losses are concentrated in middle distillates and petrochemical feedstock products, especially across Asia. Demand is projected to recover by 2.6 million barrels per day in 2027, narrowly offsetting this year's losses.
OPEC has cut its own demand-growth forecast for a fifth consecutive month.
A 2.5 million barrel per day demand contraction is a recession-scale number, and in any normal cycle it would collapse prices. It has not, because supply has fallen further and faster. Demand is down 2.5 million barrels per day; supply is down 5.7 million. The market is short by the difference regardless of how weak consumption gets.
That relationship creates the defining feature of this cycle: high prices are destroying demand, and demand destruction is the mechanism balancing the market rather than supply recovery. Asian petrochemical feedstock demand and middle distillate consumption are being priced out, which is a transfer of real income from importing economies to producers and a drag on global growth.
It also creates the trap. If the conflict resolves, 10 million barrels per day of shut-in Gulf output returns into a demand base that has already contracted by 2.5 million barrels per day, and prices collapse toward the $67 to $74 range the official forecasts carry for 2027. If it does not resolve, prices keep grinding higher and demand keeps contracting.
There is no gradual middle path in that setup. The market is binary on a diplomatic outcome nobody can forecast, which is why implied volatility in crude options has stayed elevated even during quiet weeks.
Every Official Forecast Is Now Behind The Tape
The forecasting record through this episode is worth examining, because it says something about how far this market has moved past the models.
In March the EIA revised its 2026 Brent average to $79 per barrel from $58 issued one month earlier, with 2027 raised to $64 from $53. Brent settled at $94 on March 9, roughly a 50% increase since the start of the year and the highest level since September 2023.
By September the EIA had raised its second-half 2026 Brent forecast to around $90 per barrel, $8 higher than the prior month's outlook, noting that global prices averaged $91 in August — $7 above July. The agency expects prices to fall to an average of $77 by the second quarter of 2027, with most shut-in production restored in the second half of 2027 and inventories rebuilding, taking Brent to roughly $67 in the second half of 2027 and $74 for 2027 as a whole.
Published December 2026 Brent forecasts in the market cluster around $85 with WTI at $80, raised by $5, with 2027 targets of $80 and $75. Quarterly estimates have Brent averaging $86 in the third quarter and $80 in the fourth. One scenario has Brent exceeding $120 in the fourth quarter of 2026 and averaging near $100 through 2027 if the chokepoint problem persists into next year, and another notes that a further month of Hormuz closure would keep Brent above $100 for the remainder of 2026.
Every one of those numbers sits below spot. Brent is at $108.15. The consensus fourth-quarter estimate is $80.
The structural problem with the official numbers is disclosed in the fine print: the September STEO was completed on September 3, before the pipeline strikes and before the Oman postponement. The official forecast is already stale by two escalations. That pattern has repeated all year — the forecast gets revised up, the conflict escalates again, and the revision is obsolete before publication.
The honest read is that no institution has an edge on the diplomatic variable, so the forecasts are all mechanically anchored to an assumed normalization date that keeps moving.
The Term Structure And What Backwardation Is Pricing
The shape of the curve carries more information than any single forecast, and right now it is telling a specific story.
November Brent trades at $107.54 against a spot quote of $108.15, and October WTI at $102.34. Front-month prices trading above deferred contracts is backwardation, and steep backwardation in crude is the market's direct statement that physical barrels are scarce today and expected to be less scarce later.
That structure does two things mechanically. It penalizes storage — nobody builds inventory when forward prices are lower than spot, because the trade loses money — which accelerates the 507 million barrel drawdown already underway. And it rewards holding long futures positions through roll, which attracts financial length into a market that is already physically tight.
The curve is simultaneously the symptom and an accelerant. Backwardation exists because inventories are drawing; it then discourages restocking, which draws inventories further.
The deferred pricing tells you what the market believes about resolution. Forward curves that flatten toward the $80s in 2027 are pricing the same normalization the official forecasts assume, which means the market and the agencies agree on the destination and disagree only on the path. The disagreement is entirely about how long the front stays elevated before the curve rolls down.
The practical consequence for positioning is that being short the front of this curve requires being right on timing, and every timing assumption this year has been wrong in the same direction. Being long the front costs nothing to carry and is compensated by roll yield. That asymmetry is part of why rallies have been persistent rather than spiky.
Freight is the overlooked component. High tanker rates function as a hidden tax on every imported barrel and keep diesel expensive even when US crude is plentiful. When voyage lengths shorten, effective fleet supply rises, Gulf product movements resume, and the final stage of rebalancing can begin. None of that has started.
US Production At 13.6 Million Barrels Per Day Cannot Solve A Refining Problem
American supply growth is the strongest bearish argument available, and it is weaker than it looks.
The EIA forecasts US crude output averaging 13.6 million barrels per day in 2026 and rising in 2027, with the latest revision lifting the 2027 estimate toward 14.3 million barrels per day. Producers responded to $80-plus crude, the Permian continues growing, and Gulf of Mexico projects are adding volume. That is a genuine strategic asset and a real supply response.
It does not fix 2026 for three reasons.
First, the shortage is not only crude. It is Middle East refining capacity and product exports, and a barrel of Permian light sweet does not become diesel without a refinery configured to make it. Global refinery throughput running 4.2 million barrels per day below the comparable prior period is a processing constraint, not a wellhead constraint.
Second, the logistics are wrong. Longer tanker voyages and war-risk premia are embedded in every barrel that still has to move, and US barrels displacing Gulf barrels in Asian markets means longer voyages, not shorter ones. That raises delivered cost even when the marginal barrel exists.
Third, the timing. The EIA's own consumer relief path — gasoline falling from $3.84 to $3.35 and diesel from $5.07 to $4.40 — arrives in 2027, not this year. US production growth is a 2027 story arriving against a 2026 problem.
OPEC spare capacity, the traditional shock absorber, is largely the thing that is shut in. Saudi Arabia historically held the majority of the world's surplus production capacity, and Saudi output has fallen to its lowest since 1990 because the barrels cannot reach the water. Spare capacity that cannot be exported is not spare capacity in any operational sense.
That is the difference between this episode and 2019. Abqaiq removed production while the export system stayed intact, so inventories and spare capacity absorbed it in weeks. This has removed the export system while production capacity stays intact, and there is no buffer for that.
What The Energy Equity Complex Is Telling You
The equity market has been the more reliable read on this cycle than the commodity forecasts, and it turned bullish months before the sell-side did.
Energy has been the S&P 500's leadership sector for most of the third quarter, entering September up 21% quarter-to-date, the widest margin of any group, against industrials trailing at -7.1%. It was also the only sector to advance during last week's rotation as healthcare and financials surrendered the leadership they held through August.
On Monday, with the S&P 500 down 0.75% and the semiconductor index off 5.7%, energy equities caught genuine flow. That matters because energy was one of only two places money actually stuck on a day when capital tried small caps, failed, tried enterprise software, partially held, and left the balance in cash.
The margin arithmetic explains the persistence. Producers with cost bases set when crude traded in the $60s are realizing $100-plus, and the free cash flow conversion at that spread is enormous. Refiners with access to non-Gulf crude are capturing distillate cracks that have widened all summer on international refinery outages. Integrated majors capture both.
The counterweight is the one the market keeps underweighting: an energy sector that leads on a supply disruption is leading because the economy is getting worse, not better. Energy outperformance driven by a chokepoint closure is a terms-of-trade transfer from consumers and importers to producers, and the same barrel price lifting energy equities is what took the University of Michigan sentiment reading to 47.8 from 51.7 and pushed July retail sales down 0.6%.
The positioning risk is symmetrical to the commodity. Energy equities have already priced a substantial amount of sustained elevated crude. A Hormuz reopening announcement collapses the sector faster than it collapses the barrel, because equities carry embedded expectations of duration that futures do not.
Read More
-
Yen Stalls at 160 Despite a 3% JGB and Tokyo Core CPI at 2.0% — Intervention Sits at 164, Friday's Payrolls Decide
02.09.2026 · TradingNEWS ArchiveEnergy
-
Marvell Loses 7% As The Chip Complex Gets Smoked — Does A Two-Year Guidance Raise Survive An AI Slowdown?
14.09.2026 · TradingNEWS ArchiveStocks
-
XRP Pinned At $1.39 As Bitcoin Dominance Hits 58.9% — Can A 60-Vote Threshold Unlock The Institutional Bid?
14.09.2026 · TradingNEWS ArchiveCrypto
-
Gold Sinks To $4,295 With Brent Above $109 — Why A Regional War Is Now Bearish For Gold
14.09.2026 · TradingNEWS ArchiveCommodities
-
S&P 500 Slides 0.80%, Nasdaq Loses 1.03% And Dow Drops 0.54% As Chips Get Smoked And Oil Rips To $109
14.09.2026 · TradingNEWS ArchiveMarkets
-
Pound Loses 1.3500 With Gilt Yields At A 19-Year High — Why Rising UK Borrowing Costs Are Hurting Sterling
14.09.2026 · TradingNEWS ArchiveForex
Oil Is Now The Dominant Input Into Federal Reserve Policy
The macro transmission is the reason this article matters beyond the commodity desk, and Wednesday makes it concrete.
The Federal Open Market Committee meets Tuesday and Wednesday, with the decision, projections and Chair Kevin Warsh's press conference on September 16. CME FedWatch prices a 25-basis-point increase between 86% and 88%, up from roughly 59.4% a week ago. The target range has been 3.50% to 3.75% since December. Materials are published by the Federal Reserve.
Crude is the proximate cause. August headline CPI rose 0.4% on the month with the annual rate at 3.4%, and the energy index contributed more than a third of the entire gain with gasoline up 3.9% and energy up 2.1%. Core CPI rose 0.3% against a 0.2% forecast. August producer prices rose 0.4% with annual producer inflation accelerating to 5.4%, above the 5.3% consensus, driven by wholesale energy costs. The consumer release comes from the Bureau of Labor Statistics.
The 10-year Treasury yield breached 5% on Monday for the first time since October 2023 as Brent cleared $108. That sequence — crude up, breakevens up, nominal yields up — has repeated weekly since August, and it is why market pricing now carries a base case of four Federal Reserve hikes by July 2027 after a 200-basis-point hawkish repricing.
Europe is in the same position with less room. The European Central Bank raised its deposit rate to 2.50% on September 10, its second increase of 2026, with euro area headline inflation at 3.3% and energy inflation running 14.3% while core eased to 2.4%. A net energy importer is being forced to tighten into a terms-of-trade shock.
The feedback loop this creates is what makes an oil forecast a macro forecast. Higher crude lifts inflation, forces tightening, raises real yields, slows growth, and destroys demand — which is the mechanism currently taking 2.5 million barrels per day out of consumption. The market is solving its own imbalance through recession risk rather than through supply.
The Levels That Matter: $100 Support, $109 Resistance And $120 On The Scenario
The technical map is less developed than in other markets because price discovery here is event-driven, but the reference points are clear.
On the downside, $100 is the level that matters for WTI and it has now been defended three separate times. WTI opened Monday at $100.00 and rallied to $103.59 without hesitation. Crude paused its rally to settle around $100 on Friday when Iranian state media indicated Tehran would meet Gulf states in Oman — and then reclaimed it immediately when the meeting was cancelled. That is a level buyers are defending on headlines rather than on charts.
Below $100 for WTI, the reference is the $94 Brent print from March 9, which marked the prior structural high before this leg. A move back through there would require an actual resolution rather than a de-escalation rumor.
On the upside, Brent at $108.15 marks a four-month high, placing the May 2026 peak as the next reference. Above that, the scenario pricing takes over: a sustained Hormuz disruption running into 2027 with Gulf output held 4 million barrels per day below pre-war levels supports Brent above $120, with an average near $100 through 2027. That is explicitly not the base case in any published framework, but it is the scenario every desk is now modeling.
The asymmetry in the near term favors the upside. The market just lost its only scheduled de-escalation catalyst, the pipeline bypass is offline with no restart date, inventories are drawing at 2.8 million barrels per day, refining is stretched to its limit, and the SPR cannot respond. There is no identifiable bearish catalyst on the calendar before the fourth quarter.
The asymmetry over any longer horizon favors the downside just as sharply. Ten million barrels per day of shut-in capacity returning into a demand base that has contracted 2.5 million barrels per day is a violent repricing, and the forward curve already points there. The question is entirely one of timing, and nobody has an edge on it.
Weekly US inventory data arrives Wednesday at 10:30 a.m. ET, published by the EIA, roughly three and a half hours before the Federal Reserve decision. A distillate print confirming the sub-100 million barrel forecast lands in the same session as a rate hike.
The Two Scenarios That Actually Matter
Everything reduces to a binary on diplomacy, and the intermediate outcomes are narrower than they appear.
The escalation path requires nothing new. It requires only that the current situation persist. The East-West pipeline stays offline past three to five weeks, Hormuz talks remain postponed without a new date, Houthi operations continue from the Red Sea side, and inventories keep drawing at 2.8 million barrels per day into a winter when distillate demand seasonally peaks with stocks already below the five-year low. On that path Brent clears the May high, $115 becomes reachable inside a month, and the $120 scenario stops being a scenario. US diesel sets new records weekly, headline CPI runs above 3.5%, and the Federal Reserve hikes again in December.
The resolution path requires a specific, identifiable event: a rescheduled and successful GCC-Iran meeting producing a temporary shipping corridor, or a US-Iran breakthrough on the underlying impasse. The mechanics of the unwind would be fast and brutal. Shut-in Gulf production restarts within weeks rather than months because the wells were never damaged. Tanker voyage lengths shorten, effective fleet supply rises, freight rates collapse, Saudi and Kuwaiti refineries raise distillate exports, and the crack spreads that have carried refiner margins all summer compress. Brent moves toward $85 and then toward the $74 average the official 2027 forecasts carry.
The probability weighting is uncomfortable because it is not a market judgment. Saudi Arabia reportedly held concerns over the shipping corridor proposal and Bahrain declined to participate, which means the postponement reflects a substantive disagreement among Gulf states rather than a scheduling problem. Disagreements about substance take longer to resolve than calendar conflicts.
The middle path — gradual normalization with prices drifting lower — is what every official forecast assumes and what has not happened once in seven months. The September STEO assumes constraints persist through year-end with Middle East production below pre-conflict averages until the second quarter of 2027, and that forecast was finalized before the last two escalations.
Verdict: Long The Front, But Understand What You Own
Oil is a buy on the structure and a sell on the resolution, and the entire trade is a bet on how long a diplomatic deadlock lasts.
The bullish case is physical and it is documented rather than narrative. More than 10 million barrels per day of Gulf output is shut in. Global supply falls 5.7 million barrels per day this year. Inventories have drawn 507 million barrels since February at 2.8 million barrels per day, with August alone at 3.1 million. US distillate stocks fall below 100 million barrels this month and stay beneath the five-year low through 2027. Refinery throughput runs 4.2 million barrels per day below the prior comparable period. Saudi production sits at a 35-year low. The SPR is near a record low. The bypass pipeline that was carrying 5 million barrels per day is shut with no restart date, and the one meeting that could have started de-escalation was cancelled Sunday night.
Against that, demand is contracting 2.5 million barrels per day, OPEC has cut its demand forecast for five straight months, US production is heading toward 14.3 million barrels per day, and every published forecast for the fourth quarter sits between $80 and $90 — $18 to $28 below spot. Those forecasters are not stupid. They are assuming a normalization that is genuinely likely at some point and that has been wrong on timing all year.
Base case into the fourth quarter: Brent holds a $100 to $115 range with the bias higher while the pipeline stays offline and Hormuz talks stay postponed. WTI holds $98 to $110. The floor is $100 on WTI, defended three times and reclaimed within hours each time. The ceiling is the scenario level at $120 Brent, which requires only that nothing improves.
Verdict on Monday specifically: bullish, and the composition confirms it. Crude rallied 2% to 3.5% on the cancellation of a peace meeting rather than on an attack. A market that rises when de-escalation fails to arrive, rather than falling when it does, is a market where the premium has moved from speculative positioning into physical scarcity. That is a different regime, and it does not unwind on a headline. It unwinds on a tanker actually transiting Hormuz.