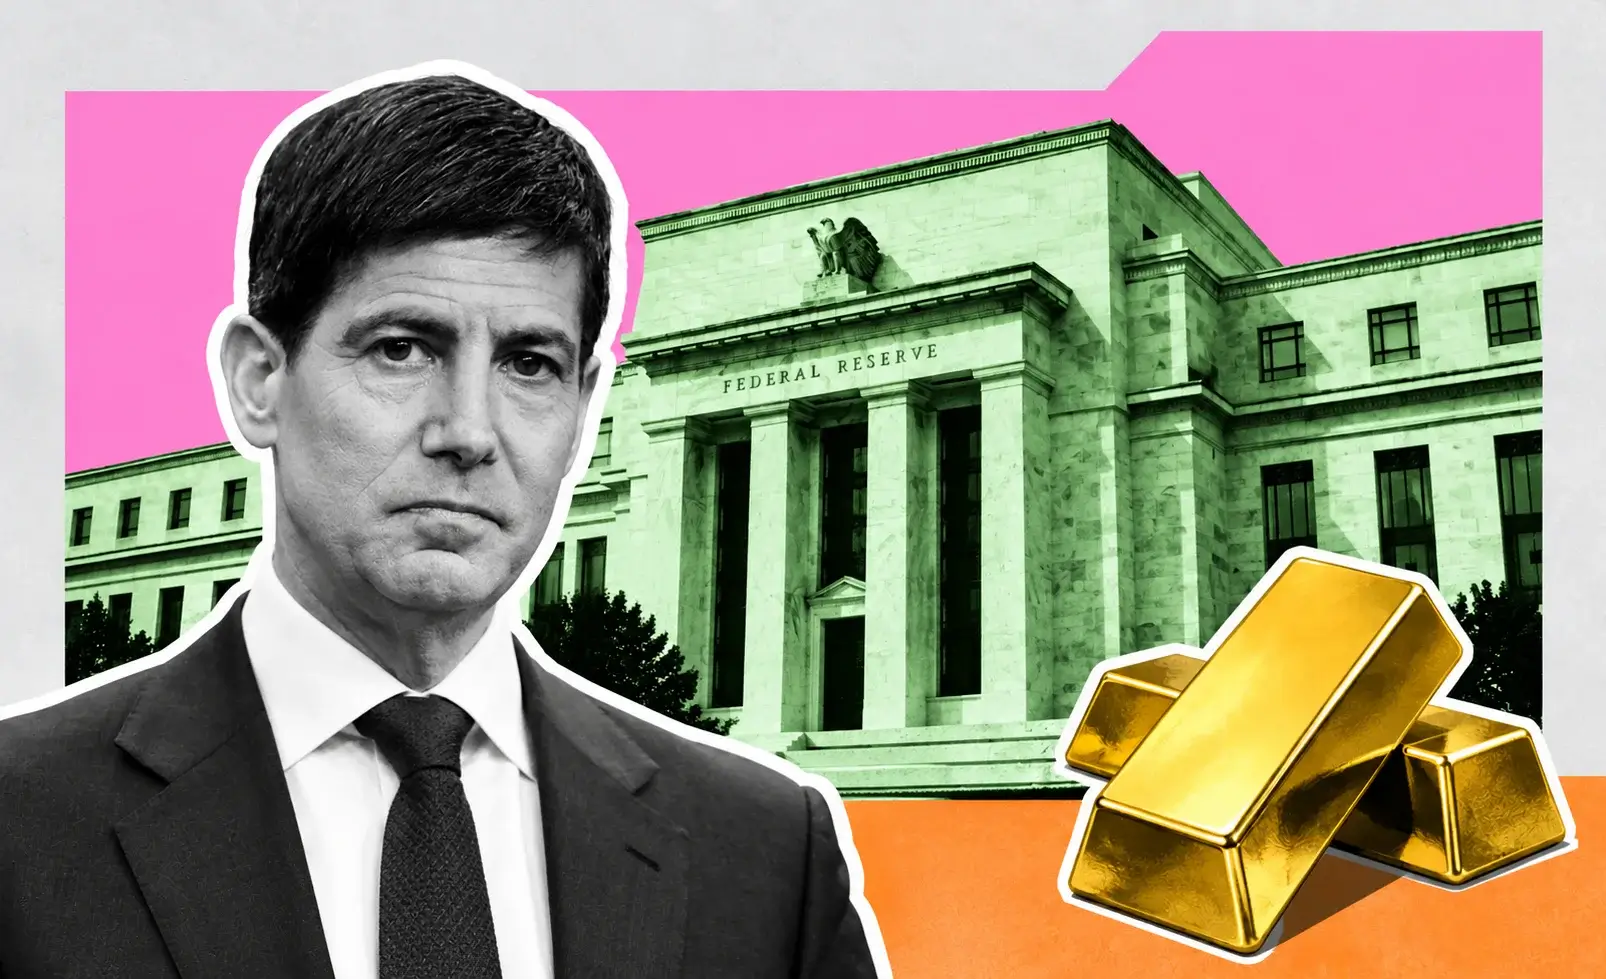
Gold Sinks To $4,295 With Brent Above $109 — Why A Regional War Is Now Bearish For Gold
Gold sits 23.2% below its January 28 record of $5,589.38 while ETFs absorbed $2B in a falling week | That's TradingNEWS
Key Points
- Gold fell 1.23% to $4,295 with an intraday low of $4,278, the weakest print since August 7.
- The 10-year Treasury yield hit 5% and the dollar index rose to 99.42, its biggest gain since June.
- Support sits at $4,292 and $4,271, with $4,166 and the $4,000–$4,100 shelf beneath.
Gold opened the Federal Reserve's policy week by giving up its August recovery. Spot XAU/USD traded at $4,295 through the London-New York overlap, down 1.23% on the session and $90.61 from Friday's $4,385.61 close, after printing an intraday low of $4,278 — the weakest level since August 7. December futures opened at $4,375, off 0.8%, and slid to $4,319.40, a decline of $89.50 and 2.03%.
The path of the session matters. Gold started Asian hours at $4,331.84, down 0.4%, held that level through the European open, then broke as US traders arrived and the 10-year Treasury yield punched through 5%. The break came with the dollar index at 99.42, up 0.3% on the day and posting its largest single-session advance since June. That sequence — a slow bleed followed by a decisive break on a yield print — is a rates story, not a positioning story.
This is the third consecutive weekly decline for bullion. Gold lost 1.8% in the week ended September 11 and has fallen 2.94% over the past four weeks. It remains higher by 16.49% over twelve months, which captures how far the metal has come and how much of that gain is now being handed back.
The context that makes Monday genuinely unusual is what happened over the weekend. Saudi Arabia shut its East-West pipeline after drone strikes, a vessel was hit in the Strait of Hormuz, Houthi forces struck the King Khalid Air Base at Khamis Mushait, and Oman postponed talks with Iran over the Strait's future without setting a new date. Brent crude pushed above $109. Every one of those headlines is textbook safe-haven fuel, and gold fell 2%.
The metal is now 23.2% below its record of $5,589.38, set on January 28, 2026, and sits directly on top of the technical confluence that has defined the second half of the year. The 61.8% Fibonacci retracement sits at $4,292. The 50-day simple moving average sits at $4,271. Monday's low of $4,278 landed between them.
That $21 band is the entire near-term argument. Hold it into Wednesday and gold has a base to work from. Lose it on a hawkish Federal Reserve and the next reference is the July 22 high near $4,166, with the $4,000 to $4,100 shelf beneath that. Two days decide it.
A Regional War Is Pushing Gold Down, And That Inversion Is The Whole Story
For four decades, Middle East conflict has been among the most reliable upside catalysts for bullion. In 2026 it has become the opposite, and understanding why is the foundation of any forecast from here.
The transmission runs through three steps and every one of them is negative for gold. Escalation shuts export infrastructure and lifts crude. Higher crude lifts headline inflation directly — the August energy index rose 2.1% on the month with gasoline up 3.9%, accounting for more than a third of the entire CPI gain, and the energy index sits 16.3% above year-ago levels. Higher inflation forces the Federal Reserve toward tightening, which lifts nominal and real yields, which raises the carrying cost of an asset that pays nothing.
The geopolitical bid exists. It is simply smaller than the rates drag. That is the inversion, and it has now been tested repeatedly. Gold fell during the escalation that pushed Brent from $101 to $105 in the week ended September 11. It fell again Monday when Brent cleared $109. The conflict began at the end of February and WTI has gained 52.9% since, with the metal down materially over the same stretch.
The producer price data reinforced it. August PPI rose 0.4% on the month with annual producer inflation accelerating to 5.4%, above the 5.3% consensus, driven by energy costs feeding through wholesale channels. That print did as much damage to gold as the consumer number did — silver dropped roughly 4% to $64.50 on the PPI release alone.
What this means for positioning is specific. The war is not a gold trade right now. It is an oil trade and a rates trade, and gold sits downstream of both. A ceasefire or a reopening of Hormuz would cut crude, cut inflation expectations, cut hike odds and lift gold — the exact reverse of the intuitive relationship. The metal is currently short-geopolitics through the rates channel.
That does not invalidate the structural case, which rests on central bank accumulation and reserve diversification rather than on headlines. But it does mean anyone buying gold this week as a war hedge is fighting the actual mechanism operating in the market.
The Federal Reserve Delivers Its First Hike Since 2023 On Wednesday With 88% Priced
The Federal Open Market Committee convenes Tuesday for a two-day meeting, with the policy statement, updated Summary of Economic Projections and Chair Kevin Warsh's press conference scheduled for Wednesday, September 16. CME FedWatch puts the probability of a 25-basis-point increase between 86% and 88%, up from 59.4% a week ago and roughly 70% before Friday's inflation data. Meeting materials are published by the Federal Reserve.
The federal funds target range has sat at 3.50% to 3.75% since December and has not moved once in 2026. A quarter-point increase would be the first hike in three years and would complete a policy reversal that began the year with futures pricing cuts and virtually no probability of tightening.
August's consumer price index did the work. Headline CPI rose 0.4% on the month — the strongest increase in three months, accelerating from 0.1% in July — with the annual rate holding at 3.4%. Core CPI rose 0.3% against a 0.2% forecast, its fastest pace in four months, though the annual core rate eased to 2.4%, the lowest since March 2021. Shelter re-accelerated to 0.3% after cooling for two months and transportation services climbed 0.5%. The full release comes from the Bureau of Labor Statistics.
For gold the hike itself is largely absorbed at 88% priced. The variable is the guidance and the dot plot. Market pricing has shifted by 200 basis points across the curve and now carries a base case of four Federal Reserve increases by July 2027, a complete inversion of the easing cycle consensus from earlier in the year. A 2026 median dot near 4.125% confirms a second move before year-end and would push gold through the $4,271 support.
The constructive scenario for bullion is narrow but real. Warsh framing this as an isolated adjustment rather than the start of a cycle would cap the front end and allow a relief rally. A surprise hold — currently a 12% to 14% outcome — would hit the dollar and yields simultaneously and produce the sharpest upside move gold has seen since August.
August retail sales land Wednesday at 8:30 a.m. ET, ahead of the decision. July retail sales fell 0.6% and preliminary September consumer sentiment collapsed to 47.8 from 51.7.
A 5% Ten-Year Against 2.4% Core Inflation Is The Highest Real Yield Of This Cycle
The single number that explains gold's 2026 is the real yield, and it just reached its most hostile level of the entire cycle.
The 10-year Treasury yield breached 5% on Monday for the first time since October 2023, trading at 4.963% in the premarket and 4.97% through mid-morning before pushing through. The 30-year held between 5.35% and 5.38%. The 2-year advanced to 4.666% after touching its highest level since July 2024 last week.
Set a 5% nominal 10-year against a 2.4% annual core inflation rate and the implied real yield runs above 2.5%. That is the opportunity cost imposed on every ounce of gold held, expressed as an annual figure, and it is the highest reading of this cycle by a meaningful margin. In February the 10-year traded at a low of 3.97%. Moving from 3.97% to 5.00% adds 103 basis points of forgone return to the gold holding decision, and the metal has repriced almost exactly in proportion.
The path to 5% was built over two weeks rather than delivered in one session. The 10-year reached 4.857% on September 9 after the Treasury tripled its buyback operation of longer-dated debt to $6 billion. Thursday's crude spike pushed it above 4.95%. Friday's CPI print confirmed the hike. Monday's oil move and the AI-driven equity selloff completed it.
The nuance that matters for the structural case is what drives the yield rather than the yield itself. Rising real yields from stronger growth are unambiguously bearish for gold. Rising nominal yields from term premium expansion — investors demanding more compensation for holding sovereign duration amid fiscal deterioration — historically coincide with gold strength, because the same forces that widen term premia erode confidence in the currency the bonds are denominated in.
Right now both are operating. The front end is rising on Federal Reserve expectations, which hurts gold. The long end is rising on inflation compensation and sovereign risk, which eventually helps it. The front-end effect dominates while the Federal Reserve is actively hiking. The long-end effect dominates afterward. That sequencing is the timing argument for the entire gold trade from here.
The Dollar Index At 99.42 Posts Its Biggest Advance Since June
Currency is the second half of the drag, and it strengthened materially on Monday. The US dollar index traded at 99.42, up 0.3% on the session and registering its largest single-day gain since June.
The mechanism is arithmetic. Gold is quoted in dollars and purchased globally, so dollar appreciation raises the local-currency cost for every buyer outside the United States. That compresses physical demand at exactly the moment paper demand is being squeezed by yields. The combination has been the defining feature of gold's year: the dollar eased briefly at the start of the second quarter and then spent most of the period gaining against major trading partners, which is precisely when gold suffered its worst quarterly performance in thirteen years.
Monday's dollar strength has four separate sources stacked on top of each other, which is why the move was as large as it was. Federal Reserve tightening expectations widen the rate differential against every other major central bank. The 10-year at 5% pulls foreign capital into Treasuries. The energy shock damages importing economies — Japan, the eurozone, India, China — far more than it damages the United States, which is now a net exporter of refined product. And the AI-safety selloff in global equities produced a flight into dollar cash, with the Nikkei down 0.81%, the Kospi off 3.26% and the German DAX losing 128 points.
The rupee sat at 95.70 against the dollar, which compounds the local-price problem for the world's second-largest physical gold market during Ganesh Chaturthi, a period that normally supports jewelry and bar demand. Indian commodity traders were also waiting for the Multi Commodity Exchange evening session to reopen after the holiday closure, thinning the bid further.
The dollar is the variable most likely to reverse first. Positioning is stretched, the move is four days old, and a Federal Reserve that hikes while signalling a pause would take the rate-differential leg out immediately. Gold's fastest route back above $4,400 runs through a softer dollar rather than through any change in the geopolitical picture.
The Technical Map: $4,331 Caps It, $4,292 And $4,271 Hold It, $4,166 Is Next
The daily chart has produced an unusually clean set of levels, and Monday's session tested three of them inside six hours.
Overhead, the 100-day simple moving average sits at $4,331. Gold traded at $4,331.84 in Asian hours, failed there, and has not reclaimed it. That average is the first genuine resistance and the level that has to give way before any recovery narrative is credible. Above it, the 20-period exponential moving average at $4,393.82 caps the next leg, and a sustained break above that EMA would be required to ease downside pressure and reopen the path toward the August highs near $4,400.
Underneath, the immediate pivot is the 61.8% Fibonacci retracement at $4,292. Gold is trading marginally above it. Beneath that, the 50-day simple moving average at $4,271 provides underlying trend support. Monday's low of $4,278 split the two, which is the tightest possible definition of a market at a decision point.
The broader structure remains heavy because price sits well below the 200-day simple moving average. A market trading beneath its 200-day with a declining 100-day directly overhead is in a downtrend regardless of what the two-week bounce off August lows looked like. That is the honest read.
Momentum is not yet stretched. The relative strength index sits at 46, leaning bearish without approaching oversold. That combination — bearish structure, neutral momentum — indicates sellers retain control with room left to press. Gold does not have the oversold condition that would argue for a mechanical bounce.
The downside map beneath $4,271 runs to the July 22 high near $4,166, which becomes support on any retest, and then to the $4,000 to $4,100 zone that has been identified as firm structural support and held through the second-quarter collapse. Gold briefly traded below $4,000 on June 24 for the first time since November 2025 and spent the rest of that quarter oscillating around the level before closing at $4,008.
Projected trading bands for the session ran $4,202.40 on the downside against $4,509.74 on the upside — a $307 range that captures how much event risk is embedded in this week.
From $5,589.38 To $4,295: The Complete Arc Of Gold's 2026
The drawdown deserves stating in full, because the size of it explains both the bear case and the bull case.
Gold gained roughly 60% in 2025, its best annual performance since 1979, setting 53 separate record highs along the way. It crossed $5,000 for the first time in late 2025 and peaked at $5,589.38 in spot terms on January 28, 2026. Futures printed $5,586.20 and the LBMA PM benchmark reached $5,405, producing a record zone rather than a single universal figure. Some references recorded prints as high as $5,608.35.
Then it broke. March 2026 delivered a $611 decline, the largest absolute monthly drop on record for the metal. That month also produced the largest single-day outflow from the world's biggest gold ETF in more than a decade, with $2.91 billion pulled on March 4 alone. The second quarter compounded it: gold entered April near $4,700 and exited June at $4,008, a 14.1% quarterly decline and the worst three-month performance since the second quarter of 2013, when the taper tantrum took 22.7% out of the metal.
Depending on the measure applied, the second-quarter fall ran between 11.7% and 16%, with year-to-date losses at the halfway mark in the 6.5% to 7.5% range. Silver fared worse, dropping 22.2% over the same three months. Bitcoin fell 20.4%.
The recovery attempt began in July from just above $4,000 and carried gold to roughly $4,400 by mid-August on renewed central bank buying and softer economic data. That rebound has now failed. Three consecutive weekly declines have taken the metal from $4,400 to $4,278, and the August low at $4,278 has been matched.
At $4,295 the drawdown from the January record stands at 23.2%. That is a bear market in the technical sense and it happened over seven and a half months while the world's largest oil chokepoint was closed and a regional war expanded.
The speed of the original ascent is what created the vulnerability. Gold needed 32 years to move from the 1980 peak to the 2011 record, then roughly 15 months to travel from late-2024 levels to the January 2026 high. Moves that fast leave positioning extended, and extended positioning liquidates on the first genuine policy shock.
Read More
-
Yen Stalls at 160 Despite a 3% JGB and Tokyo Core CPI at 2.0% — Intervention Sits at 164, Friday's Payrolls Decide
02.09.2026 · TradingNEWS ArchiveEnergy
-
Crowdstrike Breaks $233 On A 14.52% Rip As Chips Get Smoked — Is 40x ARR The Price Of The AI Security Trade?
14.09.2026 · TradingNEWS ArchiveStocks
-
Ethereum Clears $2,500 As Capital Rotates Out Of Bitcoin — Can Staking Yield Beat A 5% Treasury?
14.09.2026 · TradingNEWS ArchiveCrypto
-
Crude Rips To 4-Month Highs As The Bypass Line Stays Dark — 10M Barrels A Day Still Shut In
14.09.2026 · TradingNEWS ArchiveCommodities
-
S&P 500 Slides 0.80%, Nasdaq Loses 1.03% And Dow Drops 0.54% As Chips Get Smoked And Oil Rips To $109
14.09.2026 · TradingNEWS ArchiveMarkets
-
Euro Loses 1.1550 As Both Central Banks Hike — Why The Fed's Remaining Runway Beats The ECB's
14.09.2026 · TradingNEWS ArchiveForex
Silver At $63.22 And A Gold/Silver Ratio Widening To 68.15
Silver is transmitting the same signal with more amplitude, which is what it does at every turning point. XAG/USD traded at $63.22, down 2.14% from Friday's $64.60, with futures printing $63.33 in early trade. Silver has declined 11.06% since the start of the year and is down three consecutive sessions.
The gold/silver ratio widened to 68.15 from 67.31 on Friday. A widening ratio during a selloff means silver is falling faster than gold, and that is the standard pattern when the driver is monetary rather than industrial. Silver carries a dual identity: roughly half its demand is industrial, concentrated in electronics and solar, and the balance is monetary. When rate expectations tighten, both legs get hit — the monetary leg through carrying cost, the industrial leg through capital expenditure sensitivity.
Monday's equity tape made the industrial leg worse. The semiconductor index fell 5.7% on AI development-slowdown calls, and the solar and electronics complexes that consume silver sit directly downstream of that capex. Silver's decline was not a precious metals move on Monday. It was a precious metals move plus an industrial demand move.
The 52-week range tells you how violent this asset has been: $41.12 to $121.67. Silver is trading at roughly half its 52-week high while sitting 53.7% above its low. It gained 52.29% over twelve months and dropped 22.2% in the second quarter alone. That volatility profile explains why the ratio at 68.15 is not yet stretched by historical standards — the long-run average sits between 40:1 and 80:1, placing the current reading squarely inside normal.
Platinum diverged, gaining 0.2% to $1,802.94. A platinum bid alongside silver and gold weakness points to industrial and automotive substitution flows rather than any monetary signal.
The structural argument for silver has not changed: the metal has entered its sixth consecutive year of supply deficit. Deficits matter over years rather than weeks, and a 2.14% down day two sessions before a Federal Reserve hike is a rates event, not a supply event.
Gold ETFs Absorbed $2 Billion In A Week While The Price Fell
The flow data delivers the most genuinely bullish piece of information available on gold right now, and it runs directly against the price action.
In the five trading days ended September 8, the largest gold ETF took in $1,378 million and its lower-cost sibling added $590 million. Together those two vehicles absorbed nearly $2 billion — 93.9% of the $2,101 million that flowed into the entire focused precious-metals ETF category that week. That buying occurred while gold was falling toward its third consecutive weekly loss.
Silver told the opposite story. The largest silver ETF recorded a $29 million outflow over the same five days. The direction matters more than the size: investors were net sellers of the silver vehicle in a week when gold's vehicles saw some of their strongest buying in months.
That split is informative. Capital is separating the monetary asset from the industrial one, buying the first and selling the second, which is consistent with allocators positioning for a policy environment rather than trading a commodity cycle.
The regional dimension complicates the simple bearish narrative further. Gold ETF outflows in 2026 were not a global verdict on the metal. North America was the only region in net outflow across the first half, while Asia recorded its strongest first half on record. The third quarter has extended an accumulation cycle that began in May 2024. Global physically backed holdings stood at 4,121 tonnes with total assets under management at $604 billion, sitting just below the February peak of 4,176 tonnes. Regional flow data is published by the World Gold Council.
Derivatives positioning shifted in the same direction during August, when skew richened for calls versus puts across both over-the-counter and ETF markets, flipping gold derivative investors from put-biased to call-biased flows.
So the paper market is accumulating into weakness. That does not stop a hawkish Wednesday from breaking $4,271. It does mean the bid underneath any break is deeper than the price chart implies.
Central Banks Bought 244 Tonnes In Q1 And Gold Passed Treasuries As The Largest Reserve Asset
The structural demand layer is the reason the second-quarter collapse stopped at $4,000 rather than continuing, and the numbers behind it have not deteriorated.
Global central banks purchased a record 1,136 tonnes in 2024, led by China, Poland and India, marking the third consecutive year above 1,000 tonnes against a 2010-to-2021 average near 473 tonnes. Buying moderated to 863 tonnes in 2025 — below the record pace but dramatically above the pre-2022 annual average of 400 to 500 tonnes — with more than 22 institutions reporting meaningful reserve increases rather than one or two dominant buyers. Poland's National Bank led at 102 tonnes, lifting its total to 550 tonnes. Kazakhstan set a record year. Brazil re-entered after a four-year absence.
The pace carried into 2026 with 244 tonnes purchased in the first quarter. China's central bank extended a 14-month consecutive buying streak through 2025, building reserves beyond 2,303 tonnes.
The milestone that reframes the asset class: gold has surpassed US Treasuries as the world's largest reserve asset by the European Central Bank's accounting. The dollar's share of global central bank reserves has fallen from approximately 72% in 2000 to around 58% by 2024 on IMF COFER data. Global debt stands near $353 trillion with US federal debt at $39 trillion and zero sovereigns holding AAA ratings across the major agencies.
Central bank demand is price-insensitive in a way private demand is not. Reserve managers buy against policy mandates on multi-year schedules rather than against Fibonacci levels, and a 23% drawdown from January lowers their average cost rather than triggering stops. That is the floor beneath this market, and it sits well below current pricing — which is exactly why it failed to prevent the drop to $4,278.
Physical demand from Asia has tracked the same logic. Chinese consumer gold imports averaged roughly 158 tonnes per month from March through July, up from approximately 104 tonnes per month in January and February, with the increase beginning after the onset of the Iran conflict.
Newmont Realized $4,414 Against $1,621 All-In Costs And The Miners Still Have Margin
Producer economics remain the most underappreciated part of this market, because the spread between realized prices and cost bases stayed wide through the entire drawdown.
Newmont reported a second-quarter realized gold price of $4,414 per ounce against byproduct all-in sustaining costs of $1,621, producing a 33% year-over-year gain on realized price and a record $2.2 billion in quarterly free cash flow. Agnico Eagle generated $1.3 billion in second-quarter free cash flow at $1,459 all-in sustaining costs.
Run the arithmetic at current spot. At $4,295, Newmont's margin over that cost base is $2,674 an ounce. Gold would need to fall to roughly $2,600 — another 39% from here — before that producer's marginal economics came under genuine pressure. The gap between the gold price and the gold cost curve has never been wider in dollar terms.
That is why the mining equities have held up better than the metal's chart implies. The VanEck Gold Miners ETF produced a total return of 34.36% over the past year including dividends, outperforming bullion's 16.49% twelve-month gain by roughly 18 percentage points. Operating leverage cuts both ways, and with margins this wide the leverage has been working in the producers' favor even through a 23% metal drawdown.
Concentration is the risk inside that exposure. Newmont and Agnico Eagle together anchor more than a quarter of the largest miners fund, with a major streaming name rounding out the top holdings. When the top names beat, the fund moves. When one stumbles, the same concentration works against holders.
The variable driving the sector over the next twelve months is the gold price itself, and specifically the real yield backdrop underneath it. With the 10-year at 5% and sitting in the highest percentile of its trailing twelve-month range, that backdrop is currently as hostile as it has been at any point in the cycle. Bearish technical patterns have appeared in both the miners fund and in Newmont's individual chart.
The margin cushion means the producers survive a move to $4,000. It does not mean their equities avoid the drawdown on the way there.
What Breaks Gold Below $4,166 And What Takes It Back Above $4,400
The downside scenario requires only that Wednesday go as the market expects. A 25-basis-point hike accompanied by hawkish guidance and a 2026 median dot near 4.125% takes out the 50-day average at $4,271 on the close. Below that, gold has nothing meaningful until the July 22 high near $4,166 — a $105 air pocket with no structural support inside it. Momentum at an RSI of 46 leaves room for the move without triggering oversold conditions.
Beneath $4,166 the market reaches the zone that actually matters. The $4,200 to $4,300 band has been described as the real test of whether central banks and long-term investors are absorbing the first serious selloff since the record high, and gold is trading inside it right now. Losing it makes the January record look considerably more fragile. The next firm shelf is $4,000 to $4,100, which held through the second-quarter collapse and represents a further 6.9% decline from current levels.
The upside scenario needs a policy surprise rather than a geopolitical one. A surprise hold would hit the dollar and Treasury yields simultaneously and give gold room to rebound hard — the 12% to 14% tail that nobody is positioned for. Short of that, Warsh explicitly framing Wednesday's move as a one-off adjustment rather than the opening of a cycle would cap the front end and allow a recovery through the 100-day average at $4,331, then toward the 20-period EMA at $4,393.82 and the August highs near $4,400.
Published year-end targets still cluster well above the market. The range in circulation runs from $4,900 at the conservative end through $5,800 to $6,300 at the aggressive end, with $4,000 to $4,100 widely identified as firm structural support. Those targets have persisted through a 23% drawdown, which says something about conviction in the structural thesis even as it says nothing about the next two weeks.
Verdict: bearish into Wednesday, structurally intact beneath it. Gold at $4,295 sits $3 above the 61.8% retracement and $24 above the 50-day average, with a declining 100-day directly overhead and price well below the 200-day. The metal cannot rally on a shut oil pipeline, a struck tanker and a missile attack on a Saudi air base, which is the clearest possible evidence that real yields are running this market. Base case is a break of $4,271 on a hawkish print with $4,166 as the objective and $4,000 to $4,100 as the zone where central bank and Asian physical demand actually shows up. The structural case — 244 tonnes of official buying in a single quarter, $2 billion of ETF inflows in a falling week, gold surpassing Treasuries as the largest reserve asset, and a producer cost base 39% below spot — is a 2027 argument. This week is a rates trade, and the rate is 5%.