Crude Rolls Over to $85 as Hormuz Moves 660M Barrels
The third-quarter global balance shows a 1.8 million bpd deficit while the SPR sits at 293.4M barrels | That's TradingNEWS
Key Points
- WTI trades $85.65 and Brent $93.09, down 1.62% and 1.38% after two weekly gains above 5%.
- Hormuz throughput of 4.9M bpd is 77% below the 21.6M pre-war baseline, driving a 1.8M bpd Q3 deficit.
- A break above $87.42 targets $91; a loss of $84.03 exposes $80.82 on Hormuz normalisation.
West Texas Intermediate is trading at $85.65 per barrel, down 1.62%, after touching $84.99 intraday for a 2.38% loss. The October contract sits at $85.63, off $1.43. Brent crude has given back 1.38% to $93.09. Friday closed with WTI at $87.06 and Brent at $94.39, both up on the session and both capping a second consecutive weekly gain of more than 5%.
The pullback is positioning, not repricing. Crude gained over 5% last week for the second week running as the breakdown in US-Iran efforts deepened fears of a prolonged disruption to Gulf shipping. Monday's decline arrives hours before the Treasury Secretary unveils what Washington has billed as its toughest-ever sanctions campaign against Tehran — described publicly as an economic offensive of unprecedented scale against an adversary.
The Brent-WTI spread sits at $7.44, an unusually wide gap that reflects exactly where the shortage lives. The scarcity is waterborne and international, not landlocked American. US barrels have nowhere near the same access premium as barrels that can reach Asian refiners.
Context for how far this market has travelled in 2026: Brent traded as high as $118 on April 29 and as low as $72 on June 26 within a single quarter. It fell to $69 on July 2 after the June 17 memorandum with Iran, then reached $105 on July 23 following renewed tanker attacks. Dated Brent briefly printed above $140 earlier in the conflict, the highest since 2008. A $93 handle today sits in the middle of a range that has been $70 wide.
The cross-asset tape supports the pullback. Gold has ripped to $4,645.90, Bitcoin to $78,766.61, and the 10-year yield fell 3 basis points to 4.708%. Softer crude is easing the inflation path that has been capping every risk asset for two weeks.
The question this forecast has to answer is narrow. Iran is already among the most sanctioned economies on earth. What can a new package actually remove from the market that is not already gone? And against that, the physical balance is running a deficit that just doubled.
Those two facts point in opposite directions, and the resolution sits at $87.42 on WTI and $94.78 on Brent.
What the Sanctions Package Targets — and Why Tehran May Not Blink
The measures land Monday afternoon and the design is broader than a typical oil-export sanction.
The package is expected to cut Tehran off from international financial and commercial channels — banks, businesses, shipping registries, cash transfers and smuggling networks. The stated aim is to increase pressure sufficiently to push Iran toward negotiations covering the conflict, its nuclear programme and control of the Strait of Hormuz. The framing has been explicit: the toughest measures pursued since the sanctions of the 1980s, targeting not only Iran but the countries and companies that purchase its crude.
The President has separately warned nations and firms maintaining economic ties with Iran that they face consequences. That secondary-sanctions dimension is the part with genuine price relevance, because China is by far the largest buyer of Iranian crude and Beijing has rejected the pressure campaign while calling for a diplomatic solution.
The skeptical case is strong and deserves equal weight. Iran already ranks among the most heavily sanctioned countries in the world. Whether additional measures change behaviour is genuinely uncertain, and Tehran appears to believe it can outlast the campaign. The critical unknown is whether Washington actually moves against Chinese and Russian entities — Iran's principal partners — because sanctioning Iran alone adds little to an existing framework, while sanctioning Chinese refiners escalates into a different confrontation entirely.
Iran has already begun limiting the crude it offers to China, which suggests either voluntary restraint ahead of the announcement or logistical constraint from existing measures.
The diplomatic signal cuts the other way. Iran's president has stated a preference to conclude the war while Tehran remains in a position of strength, describing the existing memorandum with Washington — signed June 17, allowing Iran to determine Hormuz administration through negotiations with Oman and Gulf states — as a victory for the Islamic Republic. That is the language of a country positioning for settlement, not escalation.
For price, the asymmetry is important. A sanctions package that spares China is already discounted at $93 Brent. One that targets Chinese buyers directly is not, and would remove meaningful Iranian export volume from a market already running a deficit.
660 Million Barrels Through Hormuz Since May — the Strait Is Not Closed
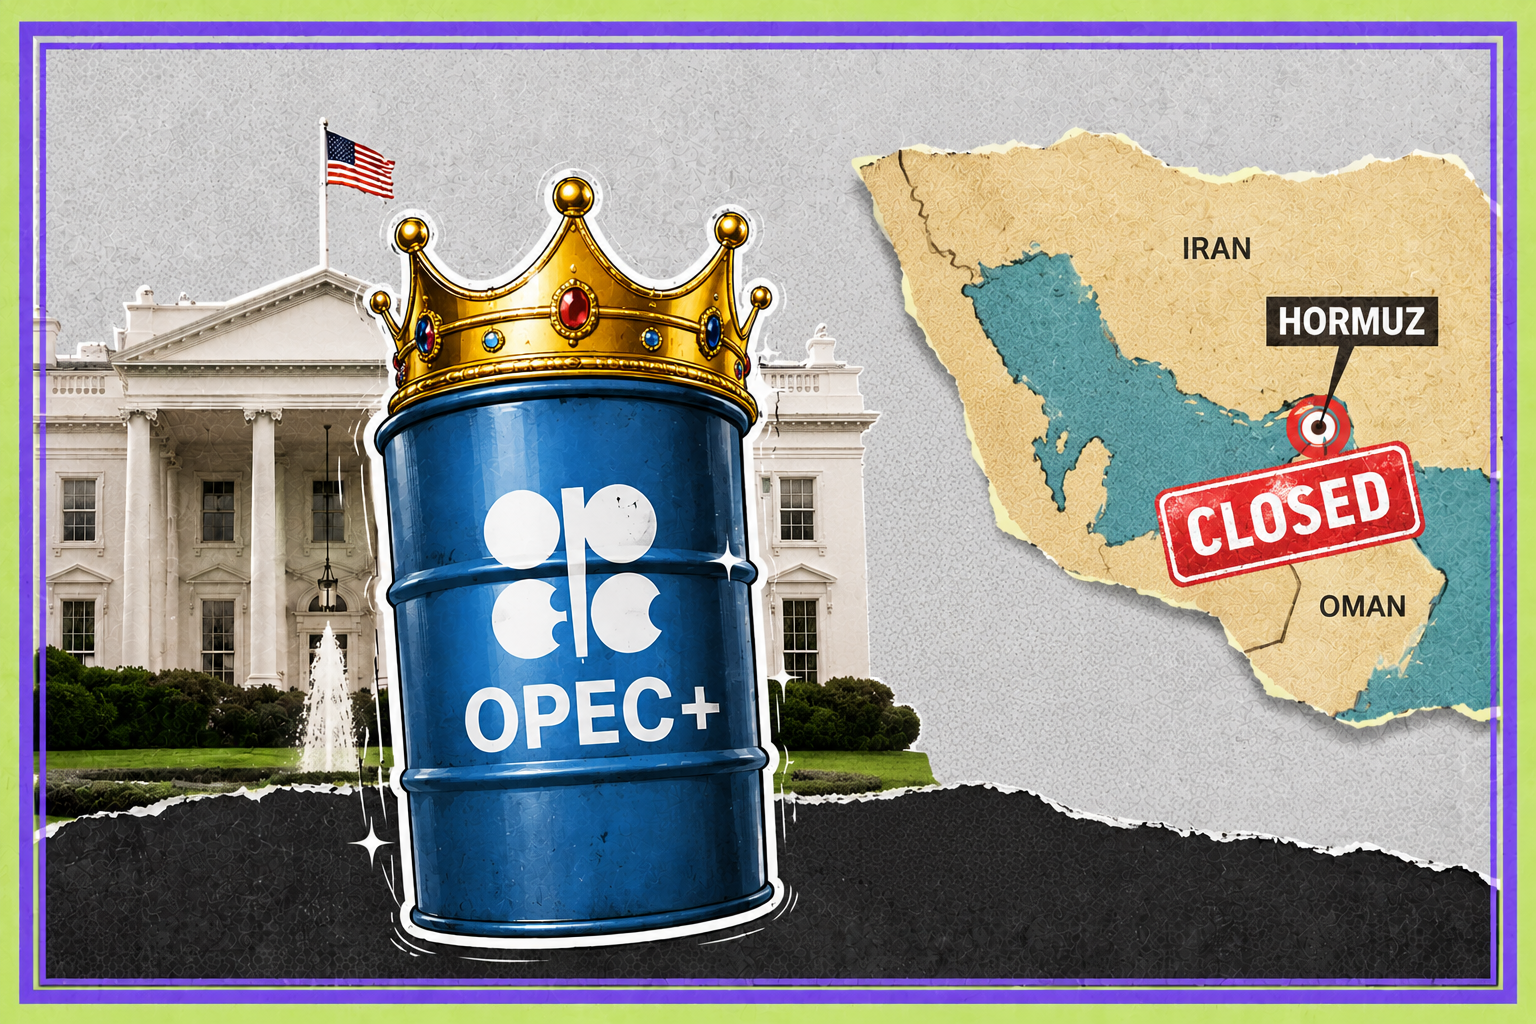
The single most underpriced fact in this market is that Hormuz is functioning, and functioning better than the headlines suggest.
The US military has confirmed helping tankers transport more than 660 million barrels of crude through the Strait since early May. Based on prior statements, that implies at least 160 million barrels — more than 7 million barrels per day — exited the waterway in a recent three-week window. The Strait is not closed. It is escorted, constrained and expensive, but it is moving product.
That contradicts the risk premium embedded in a $93 Brent price. It also explains why crude has repeatedly failed at higher levels through August despite escalating rhetoric.
The counterweight is scale. Even with those flows, the war is still removing roughly 8 million barrels per day from the market by credible estimates. Gulf exports sit approximately 8.3 million barrels per day below pre-war levels. Both figures can be true simultaneously: substantial volumes transit the Strait while the aggregate shortfall remains historic.
The rerouting has done real work. Saudi Arabia has ramped its East-West pipeline to Yanbu on the Red Sea, and the UAE has pushed volumes through Fujairah. Total crude and liquids through Bab el-Mandeb averaged 8.1 million barrels per day in the second quarter, up from 5.4 million in the fourth quarter of 2025 — a direct measure of barrels diverted away from Hormuz. Those alternative routes carry mostly lighter grades, leaving heavier crude disproportionately stranded.
Production shut-ins averaged 5.5 million barrels per day in July, and the working assumption in official forecasts is that shipments remain severely constrained through August with flows slowly increasing in September.
For the forecast, the read is that the risk premium is currently priced against a worst-case that is not occurring. If escort operations continue at 7 million barrels per day and Iranian rhetoric softens, the premium compresses fast — which is exactly what Monday's 1.62% decline is beginning to express.
4.9 Million Barrels a Day Versus 21.6 Million: the Real Supply Number
Strip out the rhetoric and one comparison defines this entire market.
Crude oil and petroleum liquids transiting the Strait of Hormuz averaged 4.9 million barrels per day in the second quarter of 2026. In the fourth quarter of 2025, before the conflict began, that figure was 21.6 million barrels per day. The waterway is operating at 22.7% of its pre-war throughput.
That is a 16.7 million barrel-per-day reduction in the flow through the world's most important energy chokepoint — roughly 16% of global daily consumption rerouted, shut in or destroyed as demand.
The supply-side arithmetic follows. Middle Eastern producers cut output by over 11 million barrels per day at the peak of the disruption. Global supply plummeted 10.1 million barrels per day to 97 million in March, the largest single-month disruption in history, with OPEC+ production falling 9.4 million to 42.4 million. Supply rebounded 4.1 million to 98.8 million in June as flows partially resumed, but world output remained roughly 9.4 million barrels per day below pre-war levels.
Full-year projections have supply declining an average of 3.7 million barrels per day to 102.6 million in 2026, contingent on de-escalation, with a 7.5 million barrel-per-day expansion possible next year if transit volumes normalise.
The Strait closed on February 28, 2026. Six months later the market is still operating with roughly a fifth of the pre-war flow through it and has not experienced the price catastrophe that arithmetic implies. The reason is on the demand side and in the inventory buffer, and both are covered below.
What matters for the forecast is that a $93 Brent price already embeds a 77% reduction in Hormuz throughput. The upside from here requires either the escort operations to stop or the sanctions to remove Iranian barrels that are currently reaching China. The downside requires only that transit continues improving on the September timeline that official forecasts already assume.
The IEA Just Doubled Its Deficit Forecast to 1.8 Million Barrels a Day
The physical balance is the strongest bull argument available, and it deteriorated sharply in the most recent assessment.
The global oil balance is now projected to show a deficit of 1.8 million barrels per day in the third quarter of 2026 — more than double the roughly 800,000 barrel-per-day estimate carried a month earlier. That revision happened while crude prices went essentially nowhere, which is the classic setup for a market that has stopped listening to fundamentals and is trading headlines instead.
The inventory evidence backs it. After brief relief in June, global observed oil inventories plunged by 69 million barrels — 2.2 million barrels per day — in July, dragged almost entirely by a decline in oil on water. By the end of July, observed stocks had fallen below 7.9 billion barrels for the first time since April 2025. Cumulative stock draws between the end of February and the end of July reached 410 million barrels, averaging 2.7 million barrels per day across five months.
OECD inventories now sit at their lowest level since 2003. That is a 23-year low in the buffer stock of the world's developed economies, reached while the market was drawing at 2.7 million barrels per day.
The assessment explicitly flags that the market is projected to return to surplus toward the end of this year, but that risks remain substantial and the urgency of reopening the Strait has increased as inventory buffers deplete.
That last clause is the crux. A market can run a 1.8 million barrel-per-day deficit indefinitely as long as it has stock to draw. What it cannot do is run that deficit after the stock is gone, and the buffer has been spending itself for five straight months.
Global refinery crude throughputs in July, despite a 1.8 million barrel-per-day monthly increase, remained nearly 5 million barrels below year-earlier levels. Capacity elsewhere in the system cannot offset the product bottleneck.
That combination — record draws, 23-year-low OECD stocks, a doubled deficit forecast — argues that $93 Brent is too low, not too high.
428.8 Million Barrels Looks Comfortable — the Distillate Number Does Not
The American inventory picture tells two completely different stories depending on which barrel you look at.
For the week ending August 14, commercial crude inventories rose 4.4 million barrels to 428.8 million against expectations of a modest draw. At that level, US crude inventories are matching the five-year average for this time of year. Cushing, Oklahoma — the WTI delivery hub — fell 1.3 million barrels to 21.3 million. Gasoline inventories rose 0.7 million barrels and sit 5% below the five-year average.
A larger-than-expected crude build is conventionally bearish. Prices held firm and moved higher after the release, which tells you the crude number is not what this market is trading.
Distillate is. Diesel inventories fell a further 1.5 million barrels and now sit approximately 13% below the five-year average for the period. That is the shortage. Crude at the five-year average alongside diesel 13% below it describes a refining bottleneck, not a crude bottleneck.
The refinery data confirms the strain. US refineries operated at 97.2% of operable capacity in that week — an extraordinary utilisation rate that leaves essentially no slack. Gasoline production averaged 9.7 million barrels per day. Crude imports averaged 6.6 million barrels per day, down 746,000 on the week.
Across the broader picture, US commercial crude stocks fell by more than 57 million barrels across a thirteen-week stretch earlier in the summer before the recent builds, while total US crude inventories were down only about 7 million barrels year-to-date because SPR draws kept the headline in check.
The next Weekly Petroleum Status Report lands Wednesday, August 26. It arrives on the same day as the July PCE inflation print and Nvidia earnings, which means the crude reaction to it will be filtered through whatever the macro tape is doing.
The signal to watch is not the crude number. It is whether distillate draws a third consecutive week with refineries already at 97.2%.
The SPR at 293.4 Million Barrels Is the Buffer Nobody Can Refill
The most consequential number in American energy policy has almost no coverage, and it is deteriorating weekly.
The Strategic Petroleum Reserve stands at approximately 293.4 million barrels following a 5.3 million barrel weekly draw — its lowest level in more than four decades. The reserve has been drawn down roughly 122.0 million barrels since the Strait closed on February 28, as part of a coordinated international release totalling 172 million barrels. A broader emergency release exceeding 400 million barrels from government stockpiles was announced after the closure, of which 301 million barrels were crude.
The operational floor matters more than the headline. The generally accepted minimum for the SPR sits between 250 and 300 million barrels, below which the reserve struggles to pump and process oil efficiently. At 293.4 million, the United States is already inside that band. The reserve is roughly 420 million barrels below maximum capacity.
Read that plainly: the primary tool the US government holds for suppressing an oil price spike is approaching the level at which it stops functioning as a tool.
The coordinated release provided around 2.5 million barrels per day of relief across a four-month window — a meaningful buffer that helps explain why a disruption on the order of 16% of global supply has not produced catastrophic prices. That buffer was always time-limited. Any additional emergency release now draws from reserves that are already at operational minimums.
This is the asymmetry that should worry anyone short crude. The market has absorbed the largest supply disruption in history because it had 410 million barrels of global stock and a 172 million barrel coordinated release to spend. Both are largely spent. The next disruption — a tanker strike, a refinery attack, a failed negotiation — hits a market with no buffer.
Refilling the SPR is itself a demand source. Any scenario where prices fall meaningfully creates government buying that limits the decline, which puts a soft floor under the entire complex somewhere in the low $70s Brent.
Read More
-
Yen Stalls at 160 Despite a 3% JGB and Tokyo Core CPI at 2.0% — Intervention Sits at 164, Friday's Payrolls Decide
02.09.2026 · TradingNEWS ArchiveEnergy
-
Apple ($333.38) Loses $103B in Value as Memory Costs Squeeze Margins to 47–48%
09.10.2026 · TradingNEWS ArchiveStocks
-
XRP ($1.38) Slips Below Its 50-Day Average at $1.42 While Fund Buyers Keep Adding — 200-Day at $1.28 Is the Floor
09.10.2026 · TradingNEWS ArchiveCrypto
-
WTI ($91.63) Erases a 1.1% Loss on Gulf Shut-Ins, Brent Holds $100 After Iran Pledge — $104.26 in View Above $95.06
09.10.2026 · TradingNEWS ArchiveCommodities
-
S&P 500 +26 Points, Nasdaq +0.40%, Dow +0.34% as HUM Hits $433.77 and T Drops 6.81%
09.10.2026 · TradingNEWS ArchiveMarkets
-
Sterling Steady at 1.3240 After 5 Tests of 1.3182 as BoE Hike Bets Hit 85% — Budget on October 28 Decides the Break
09.10.2026 · TradingNEWS ArchiveForex
Diesel Cracks at Record Highs — the Product Market Is the Real Bull Case
The refining margin data is the clearest evidence that this shortage is structural rather than speculative.
Atlantic Basin refining margins reached all-time highs in July as diesel, jet fuel and gasoline cracks surged simultaneously on seasonally higher demand, supply shortfalls and depleted stocks. Diesel cracks specifically hit record levels. Cracks and margins had already touched four-year highs in early July.
The second-quarter comparison quantifies it. The average gasoline crack spread ran 60% above the year-ago level. Distillate and jet fuel crack spreads were more than double their year-earlier readings, driven by tight international supply. US refineries responded by running at unseasonally high levels, processing the most crude for a second quarter since 2019 — a year when American refining capacity was 4% higher than it is today.
US distillate and jet fuel exports reached record highs in the second quarter as international buyers, cut off from Middle Eastern product, sought alternative sources.
That is the mechanism keeping crude bid despite comfortable crude inventories. Middle East export refineries have yet to restart. Russian throughputs are curtailed by attacks on energy infrastructure, with a series of Ukrainian strikes causing fuel shortages in some Russian regions. Asian refiners are running at reduced rates. Global refinery runs are expected to decline 2.4 million barrels per day this year before rebounding 3.1 million in 2027.
The disconnect between an apparently well-supplied crude market and a genuinely tight product market has defined 2026. When refined products are scarce and margins are at records, refiners bid aggressively for crude regardless of what tank inventories say — which is precisely why a 4.4 million barrel crude build produced no price decline.
For the forecast, cracks are the leading indicator. If diesel margins hold at records into September, crude has a floor well above $80 WTI regardless of the Hormuz headlines.
Demand Destruction Is Real: Consumption Falling 1.6 Million Barrels a Day
The bear case has nothing to do with supply and everything to do with the fact that $93 crude is destroying the demand that justifies it.
Global oil demand is now expected to decline by an average of 1.6 million barrels per day this year. The quarterly path is brutal: a contraction of 4.9 million barrels per day in the second quarter and 2.8 million in the third, before flipping to growth of 580,000 barrels per day in the fourth. The forecast for second-half demand was cut by roughly 550,000 barrels per day in the most recent revision as the Hormuz closure disrupted international supply chains and curtailed product availability.
Elevated fuel prices are the mechanism. High prices, reduced availability and government conservation initiatives have curbed consumption particularly sharply in Asia, with the world consuming roughly 1 million fewer barrels per day on average than last year.
The deepest cuts arrived first in Middle East and Asia Pacific naphtha, LPG and jet fuel — the most price-elastic barrels in the complex. Demand destruction then spreads as scarcity and elevated prices persist.
That is the self-correcting mechanism in every oil shock, and it is running. A 1.6 million barrel-per-day demand contraction against a 1.8 million barrel-per-day third-quarter deficit means the balance is being closed roughly half by consumers not buying rather than by producers supplying.
The forward projections turn decisively bearish. Global inventory builds of 2.7 million barrels per day are forecast for the fourth quarter of 2026 and 5.0 million barrels per day in 2027 if production recovers faster than consumption. Demand is projected to increase 2.5 million barrels per day in 2027 as prices decline and Middle Eastern production gradually rises.
The trap for bulls is the timing. A market that runs a deficit through the third quarter and a 2.7 million barrel-per-day surplus in the fourth does not wait for the calendar to reprice. Futures curves discount the transition, and backwardation flattens before the surplus arrives.
WTI at $87.42 and Brent at $94.78: the Double-Top Problem
The technical picture is the most concerning element for anyone long crude here.
WTI has been rejected repeatedly at $87.42, and that repetition raises the risk of a double-top formation. The contract remains technically constructive above $84.03, which is the level that separates a consolidation from a breakdown. Mid-August price action stalled near $84.30 while attempting to push toward $85–86, and the market has since made the round trip without clearing the highs.
Brent shows the same shape one benchmark higher. It was rejected at $94.78 and is currently testing rising support between $90.60 and $91.00. The contract trades above both its 50-period EMA at $90.73 and its 100-period EMA at $88.92, so the uptrend structurally holds — but the recovery becomes invalid if those supports flip to resistance. Immediate support sits at $90.73 and $88.92, with resistance at $94.78 and then $97.84.
Momentum has cooled materially. Brent's RSI has dipped to 44, meaning bullish momentum has faded to neutral despite two consecutive weekly gains above 5%. An asset that rallies 10% across two weeks and finishes with an RSI in the mid-40s is an asset where the buying is not broad.
The failure pattern is what defines the setup. WTI reached $87.42 and failed. Brent reached $94.78 and failed. Both failures occurred with maximum sanctions rhetoric in the market — the President describing the campaign as the most crushing economic operation ever undertaken, the Treasury Secretary promising the toughest sanctions in history. If that headline flow could not clear the highs, the technical read is that the risk premium has found its ceiling.
Monday's decline into the actual announcement fits that reading exactly. Traders are selling the fact.
The levels are clean enough to trade against. Above $87.42 WTI and $94.78 Brent, the breakout resumes toward $91 and $97.84. Below $84.03 WTI, the double top confirms.
$84.03 and $80.82 — Where the Bull Case Breaks
The downside architecture is well defined and closer than the fundamentals suggest it should be.
WTI holds a bullish structure only above $84.03, currently 1.9% beneath spot. A clear break of that support zone invalidates the pattern and exposes $80.82 — a 5.6% decline from $85.65. On Brent, a loss of the $90.60 to $91.00 shelf targets the 100-period EMA at $88.92, roughly 4.5% below current levels.
What makes those levels reachable is the demand-side arithmetic already discussed, and one specific threshold that could trigger the move in a single session.
Under a credible framework, Brent trades between $70 and $100 across the second half of 2026, with prices falling toward the bottom of that range if Hormuz flows recover even modestly. The specific estimate is that just 50% to 60% of pre-war transit quantities would be enough to revive expectations of an oversupplied global market.
That number deserves emphasis. Pre-war Hormuz throughput was 21.6 million barrels per day. Fifty to sixty percent of that is 10.8 to 13.0 million barrels per day. Current escorted flows are running above 7 million barrels per day. The market is roughly 4 million barrels per day of restored transit away from the level at which the entire narrative flips from deficit to glut.
That is not a distant scenario. Official forecasts already assume flows slowly increase in September. A negotiated settlement — and Iran's president has publicly signalled a preference to end the war while in a position of strength — accelerates it.
The rebuild demand provides the floor. Replenishing strategic and commercial reserves would absorb part of any surplus and temper the decline, with the SPR alone 420 million barrels below capacity. Government buying does not stop a repricing, but it limits how far it runs.
Practical read: $80.82 WTI and $88.92 Brent are the realistic downside targets on a Hormuz normalisation headline. Below that requires the surplus to actually materialise, which is a fourth-quarter story rather than an August one.
PCE Wednesday, EIA Wednesday, Warsh Friday
Three scheduled events sit between Monday's sanctions announcement and the weekend, and each can move crude independently.
Wednesday delivers the July Personal Consumption Expenditures price index and core PCE alongside the second estimate of second-quarter GDP, July personal income and spending, and July durable goods orders. The same morning brings the weekly Petroleum Status Report covering the week ending August 21.
The inflation print matters to crude through a second-order channel. Elevated energy prices have been the primary input keeping inflation risk alive, which has kept the long end of the Treasury curve under pressure — the 30-year touched above 5.33% this month, its highest since June 2007. A hot core PCE reading reinforces the higher-for-longer path, strengthens the dollar and pressures crude. A soft print does the opposite.
The dollar channel is live right now. The dollar index has fallen to 98.723, its lowest since May 14, following the Treasury's decision to double long-dated bond buybacks from $2 billion to at least $4 billion per operation. A weaker dollar mechanically supports dollar-denominated crude, and that tailwind has been active through the August rally.
Friday brings the Federal Reserve Chair's first Jackson Hole keynote in the role. The energy relevance is indirect but substantial: a hawkish message strengthens the dollar and compresses commodity prices across the board, while confirmation that the Fed will tolerate the Treasury's yield management extends the weak-dollar bid that has lifted gold to $4,645.90 and crude alongside it.
Add the trade file. Fifty percent US tariffs on $20 billion of Canadian goods took effect Saturday, with Canadian retaliation scheduled for September 8. Energy was explicitly carved out of the US measures, which removes the most direct crude impact — but tariff escalation between the two largest bilateral trading partners is a growth negative, and growth negatives are demand negatives.
The sanctions detail Monday afternoon remains the largest single-day catalyst.
Verdict and Price Forecast: WTI $91 on Escalation, $80.82 If Hormuz Normalises
WTI at $85.65 and Brent at $93.09 sit in the middle of a range defined by a physical deficit that keeps widening and a technical structure that keeps failing at the highs.
The bull case rests on five verifiable numbers. The third-quarter global balance shows a 1.8 million barrel-per-day deficit, more than double the prior month's estimate. Global observed inventories plunged 69 million barrels in July and fell below 7.9 billion for the first time since April 2025, with cumulative draws of 410 million barrels since February. OECD stocks sit at their lowest since 2003 and the SPR at 293.4 million barrels is inside its operational minimum band. Hormuz throughput at 4.9 million barrels per day remains 77% below the 21.6 million pre-war baseline. And distillate inventories are 13% below the five-year average with refineries already running at 97.2% utilisation and diesel cracks at record highs.
The bear case rests on four equally verifiable numbers. Global demand is contracting 1.6 million barrels per day this year, closing roughly half the deficit through consumption rather than supply. Escorted transit is already moving more than 7 million barrels per day through the Strait, against a 10.8 to 13.0 million threshold that would restore oversupply expectations. US commercial crude at 428.8 million barrels matches the five-year average after a 4.4 million barrel build. And forward projections show inventory builds of 2.7 million barrels per day in the fourth quarter and 5.0 million in 2027.
The forecast: WTI holds $84.03 to $87.42 and Brent $90.60 to $94.78 through Wednesday. A sanctions package that targets Chinese buyers of Iranian crude breaks WTI above $87.42 toward $91 — a 6.2% advance — with Brent clearing $94.78 for a run at $97.84. Escalation beyond that puts $105 Brent back in play, a level reached as recently as July 23.
Downside: a package that spares China, or any credible signal that Hormuz transit is normalising toward 50% of pre-war volumes, breaks WTI beneath $84.03 and targets $80.82, a 5.6% decline, with Brent falling to the 100-period EMA at $88.92.
The verdict is neutral-to-constructive with the risk squarely on the headline rather than the balance sheet. The physical market says higher. The chart says the premium has topped. Sell WTI strength above $87.42 until it closes through it, buy weakness at $84.03, and treat Monday afternoon as the binary.
That's TradingNEWS