Ethereum Fixed Its Network and Broke Its Money — 41M Staked Coins Now Carry the Entire Case
BitMine's 5,797,813 ETH and exchange balances at multi-year lows have defended $1,750 | That's TradingNEWS
Key Points
- ETH trades $1,913 after opening at $1,908.93, still 61.4% under its $4,951.66 all-time high.
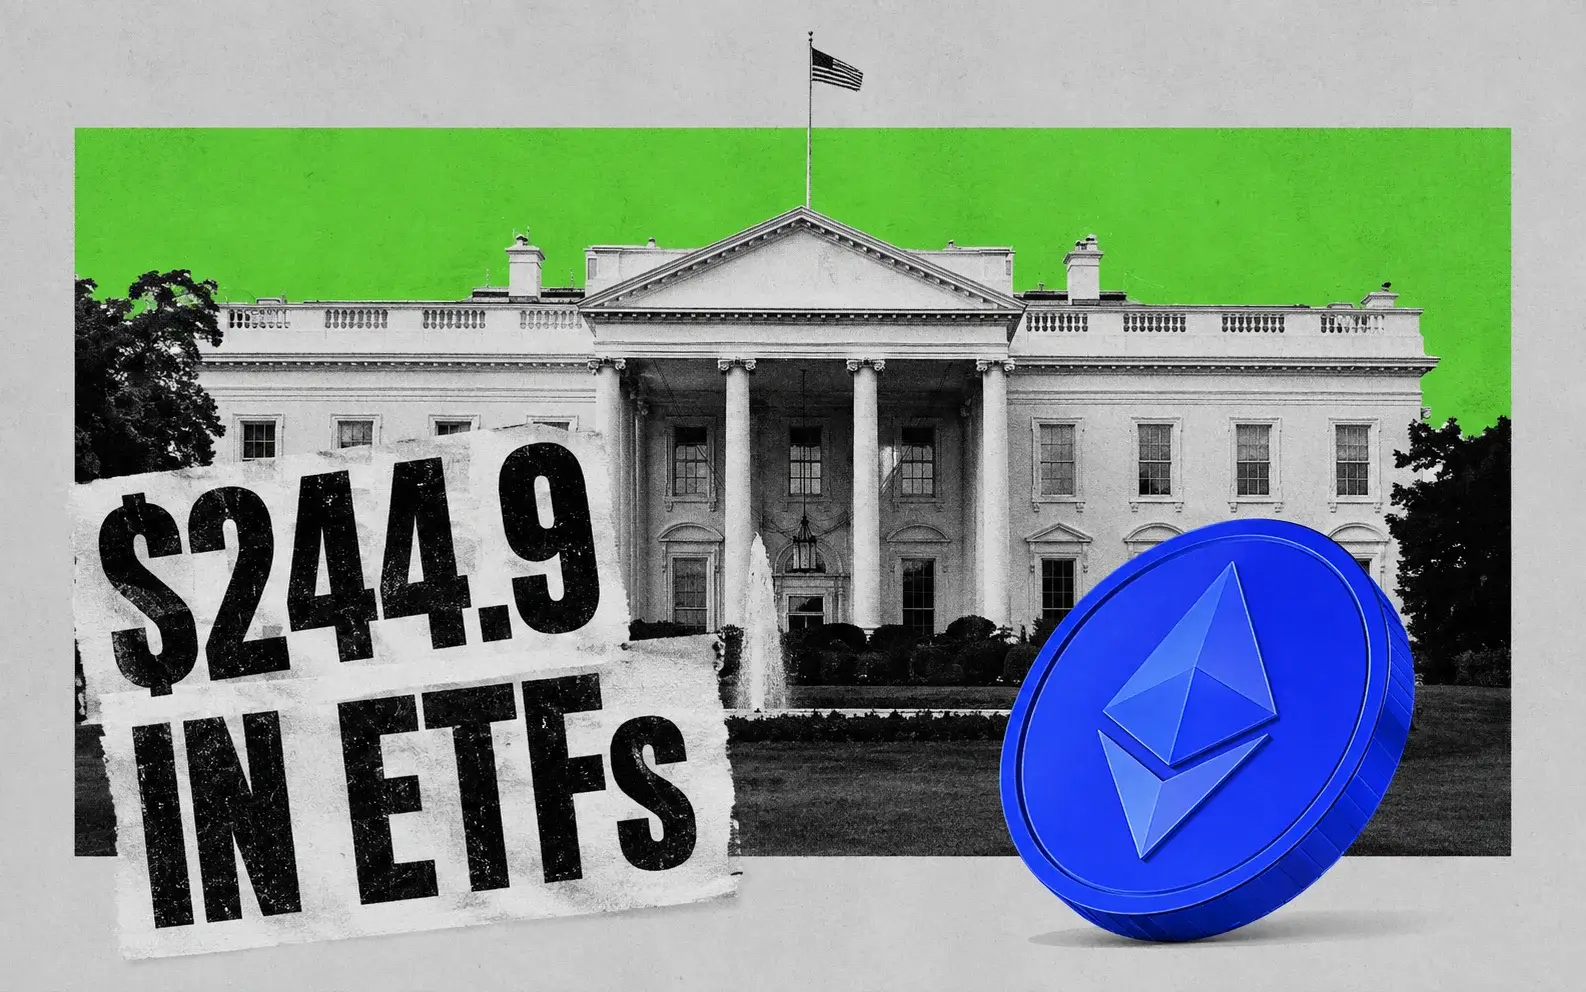
- Spot Ethereum ETFs took $244.9 million last week, a fifth straight positive week and 2026's longest run.
- Median mainnet fees fell over 99% to under $0.02, gutting the burn that made ETH deflationary.
Ethereum opened Monday at $1,908.93, down 0.3% from Sunday's open, and traded up to $1,913.13 by 8:46 a.m. ET. Sunday's session had it between $1,915.52 and $1,925.46. Against a circulating supply of 120.47 million coins, that puts market capitalisation near $230 billion.
The number that frames everything: ETH reached an all-time high of $4,951.66 on August 24, 2025. At $1,913, the asset sits 61.4% below that peak. Bitcoin, at $64,935, sits roughly 48% below its own record. That 13-point gap in drawdown is the entire Ethereum story of 2026, and it has pushed the ETH/BTC ratio to 0.0295 — the weakest sustained reading in over a year.
The forecast rests on a tension that most ETH analysis treats as two separate stories when it is actually one. On the demand side, the institutional bid has genuinely repaired: U.S. spot Ethereum ETFs took $244.9 million in the week ending August 7, marking five consecutive weeks of positive flows and the longest such run of 2026, with Thursday's $92.2 million the largest single day of that stretch. Cumulative net inflows have reached $11.46 billion. The staking ratio has climbed to 34.23% of total supply, roughly 41 million coins with a staked market capitalisation above $77 billion.
On the value-accrual side, the network broke its own economics. Median mainnet transaction fees fell more than 99% from above $2 in early 2024 to under $0.02 by March 2026 while throughput doubled. That is an enormous engineering achievement and it destroyed the fee burn that made ETH structurally scarce during the previous cycle.
So Ethereum has fixed adoption and broken monetisation at the same time. The 61% drawdown is the market pricing that trade honestly. Whether $1,913 is the bottom depends on whether staking yield can replace fee burn as the reason to hold the asset — and on Wednesday's U.S. CPI print, which governs every risk asset this week.
The $1,900 Line Is Where the Entire Structure Sits
Technical structure first, because the levels here are unusually well defined and the market is pinned against one of them.
ETH is trading near a key support zone at $1,900, and traders have been watching it closely because it also lined up with the max pain price for the August 9 options expiry on Deribit. Max pain converging with horizontal support is the configuration that produces pinning behaviour — market makers hedging short gamma defend the strike into expiry, which is a mechanical explanation for why the coin has traded a $17 band between $1,908.93 and $1,925.46 across two sessions.
With that expiry now behind the market, the pinning force is gone. That matters for the week ahead: the artificial stability that held ETH within 1% of $1,913 has expired, and the next macro catalyst is Wednesday.
The 2026 range gives the wider context. Since the start of the year Ethereum has traded between $1,505.68 and $3,402.61, remaining within a prolonged downtrend. Current price at $1,913 sits 27% above the low and 44% below the high of that range — the lower third, which is where a downtrend spends most of its time before it either bases or resumes.
The downside map is specific. Holding $1,750 permits a bounce toward $1,800; losing it opens a test of support near $1,540, which is effectively the 2026 low at $1,505.68. That means the gap between current price and the next genuine structural support is roughly 19% — a wide air pocket with nothing between $1,750 and $1,540.
The upside map is heavier. Before ETH can approach its all-time high it needs to reclaim the $2,400 to $2,500 zone, then clear the $3,000 psychological level, before the $4,500 to $5,000 range even comes into view. The top of that range carries heavy overhead supply from everyone who bought near the $4,953 peak and is waiting to exit at break-even.
Practically: ETH has to travel 25% to reach its first meaningful resistance zone and 19% to reach its first meaningful support. That asymmetry favours neither side and describes an asset in genuine equilibrium at $1,913. Direction comes from outside the chart.
Five Consecutive Weeks of ETF Inflows Is the Longest Positive Run of 2026
The demand data is the strongest pillar of the constructive case, and the sequence matters more than any single number.
U.S. spot Ethereum ETFs drew $244.9 million in the week ending August 7, extending their positive run to five weeks — the longest of 2026. Thursday's $92.2 million was the largest single-day intake of that period. On August 5 the funds recorded $60.8 million, with BlackRock clients accounting for roughly $50.3 million of it. Cumulative net inflows across the complex have reached $11.46 billion since launch, with weekly value traded at $2.38 billion.
The monthly progression is what makes this credible rather than noise. July delivered over $365 million of net additions according to SoSoValue tallies. That followed June, which shed $528 million, and May, which shed $540 million. Going from two consecutive months of half-billion-dollar redemptions to a $365 million inflow month, then extending into five straight positive weeks, is a regime change in allocator behaviour rather than a bounce.
The precedent from earlier in the year is instructive about durability. April 2026 produced $356 million of net inflows led by BlackRock and Fidelity, ending a six-month negative streak — and that reversal did not hold, giving way to the May and June bleed. So the market has already seen one false dawn in 2026, which is why the current streak needs to extend before it can be treated as structural.
The composition shows the same concentration problem visible across crypto ETFs. BlackRock's ETHA has driven the bulk of the demand, taking $58.3 million on July 14, $52.8 million on July 21 and $31.7 million on July 17 during a $196.4 million six-session stretch. Fidelity's FETH has attracted substantial capital. Beyond those two, the picture thins dramatically: Franklin's EZET has accumulated roughly $66 million of net inflows since launch, and Invesco's QETH considerably less.
A recovery that depends on one product is a recovery with one point of failure. That said, $244.9 million in a week against a $230 billion market capitalisation is real capital, and exchange balances have fallen to multi-year lows, which means the coins being bought are leaving liquid supply rather than circulating.
34.23% of Supply Is Staked and That Is the Whole Bull Case Now
The structural argument for Ethereum has migrated from fee burn to staking yield, and the numbers behind that migration are substantial.
The staking ratio has risen to 34.23% of total ETH supply. Total staked ETH stands at roughly 41 million coins, with a staked market capitalisation above $77 billion. That is up from approximately 30% and 35.8 million coins earlier in the year — meaning roughly five million additional coins were locked into validators during a period when the price fell.
Locking supply while price declines is the behaviour of holders who are not price-sensitive, and it is the closest Ethereum has to the central bank demand that underpins gold. Forty-one million coins removed from liquid float against 120.47 million total supply means less than two-thirds of the asset is available to trade. When demand returns, the float that has to clear it is materially smaller than the market capitalisation suggests.
The institutional channel for that yield is arriving. An SEC filing for BlackRock's proposed staked Ethereum product reported an activation queue of roughly four million ETH — approximately 70 days — as of February 5, 2026, against an exit queue of only around 20,700 coins. A queue ratio of nearly 200 to 1 in favour of entry is about as clear a demand signal as validator mechanics can produce. A staking mini ETF filing has followed.
Why this matters more than any other Ethereum development: the first generation of spot ETH ETFs asked institutions to hold a non-yielding asset that competes against Treasuries paying real returns while the Federal Reserve sits at 3.75% and debates hiking. That was never going to work, and the $11.46 billion of cumulative inflows across two years reflects it. A staking-enabled wrapper converts ETH from a zero-coupon speculation into a yield-bearing allocation, which is a fundamentally different product for a fixed-income or multi-asset mandate.
Two caveats belong in the analysis. Staking ETFs do not pass 100% of gross staking rewards to investors — issuer fees and operational costs take a cut, which compresses the yield advantage. And the most successful products will need to balance staking yield against reliable daily liquidity, a genuine engineering problem given entry queues measured in months.
The 99% Fee Collapse Fixed Adoption and Broke the Burn
This is the part of the Ethereum story that gets celebrated without being priced, and it explains the 61% drawdown better than any macro variable.
Median Ethereum mainnet transaction fees fell more than 99% from above $2 in early 2024 to under $0.02 by March 2026, while network throughput doubled. Measured as a usability outcome, that is one of the most successful scaling programmes in the history of distributed systems. Ethereum became cheap enough for ordinary use.
Measured as a monetary outcome, it removed the mechanism that made ETH appreciate. Under the fee-burn design, every transaction destroyed ETH, and during periods of high activity the network burned more than it issued — making the asset deflationary. That property was the core of the "ultrasound money" thesis that carried ETH toward $4,951.66 in August 2025. Fees under $0.02 burn almost nothing. Issuance to validators continues. The asset is inflationary again.
So Ethereum executed a strategy that maximised network utility at the direct expense of token scarcity, and the token repriced accordingly. That is not a market failure or a mispricing. It is the market correctly identifying that a cheaper network is worth less per unit of settlement even as it settles more.
The activity data confirms adoption is real. DeFi total value locked on Ethereum rose above $40.6 billion in July, up from a June low of $36 billion. Lido's TVL gained 20% during the month, with Aave adding 16%, Binance Staked ETH 16.2% and Sky 6.5%. Exchange balances sit at multi-year lows. The network is being used more, not less.
The unresolved question is whether growing stablecoin, tokenization and Layer 2 activity creates economic value for ETH itself. Layer 2 networks settle to mainnet but pay a fraction of what equivalent mainnet activity would have generated, which means Ethereum has successfully outsourced its transaction volume and its fee revenue simultaneously.
That is the bear case in one sentence, and it is why staking yield now has to carry the entire valuation argument. If validator rewards are the only cash flow, ETH is a bond-like instrument yielding a few percent — and that gets valued very differently from a deflationary monetary asset.
EIP-8363 Threatens the One Thing Holding the Thesis Together
A governance risk emerged over the weekend that deserves more attention than it received, because it targets precisely the mechanism the bull case now depends on.
A controversial proposal designated EIP-8363 risks reducing validator rewards, which would dampen institutional appeal for staking products. A chief executive in the ecosystem issued a public warning about it on August 9. Related earlier discussion around EIP-8361 estimated that Ethereum staking rewards could drop 13% on day one under implementation.
Work through the implication. If staking yield is the replacement for fee burn as ETH's reason to exist, and a protocol change cuts that yield by a double-digit percentage, the asset loses its second value-accrual mechanism in two years. Institutional allocators building models around staked ETH ETFs are underwriting a specific yield. A 13% haircut to that yield does not just reduce returns proportionally — it may push the net-of-fee return below the threshold at which a regulated product makes sense against Treasury alternatives.
The timing is what makes it dangerous. BlackRock's staked product has a four-million-coin activation queue. A staking mini ETF filing is pending. The entire institutional pipeline is being built on the assumption of a stable reward schedule, and a proposal that changes that schedule arrives just as the products approach launch.
The counterweight is that Ethereum's governance process has historically been slow and consensus-driven, and Bitcoin's BIP-110 episode over the same weekend demonstrated what happens to protocol changes that lack broad support — that soft fork attempt secured 2.53% miner backing against a 55% threshold and produced a two-block chain before stalling. Controversial proposals fail more often than they pass.
There is also the Glamsterdam upgrade ahead, which the market has been treating as a positive catalyst alongside ETF flows and staking growth. Upgrade cycles cut both ways: they deliver capability and they introduce reward-schedule uncertainty.
For the forecast, EIP-8363 is a tail risk with an outsized impact function. It is unlikely to pass and it would be materially damaging if it did. Position sizing should reflect that shape rather than the probability alone.
BitMine Holds 5,797,813 ETH and That Concentration Is a Two-Sided Risk
Corporate treasury demand has become a meaningful component of Ethereum's float, and it is concentrated in one name.
BitMine Immersion, associated with Tom Lee, holds 5,797,813 ETH valued at roughly $11 billion. The company purchased over 87,000 coins during July, bringing holdings from prior levels toward a stated six-million-coin target. On August 9 it confirmed a treasury pivot that stakes over 5.7 million ETH to generate yield.
Scale the position properly. At 5,797,813 coins against 120.47 million circulating supply, BitMine controls 4.8% of all Ethereum. That is a larger share of ETH than any single entity holds of Bitcoin outside the exchange-traded complex. The company is roughly 202,000 coins from its six-million target, which implies continued buying.
The bull reading is straightforward. A corporate treasury accumulating 4.8% of supply and staking essentially all of it removes those coins from liquid float permanently and adds to the 41 million already staked. Combined, staked and BitMine-held coins account for a large majority of the supply that theoretically could be sold. Price-insensitive accumulation of that magnitude is why $1,750 has held and why the 2026 low at $1,505.68 has not been retested despite a 61% drawdown from the peak.
The bear reading is the same fact viewed as concentration risk. A single entity holding $11 billion of an asset with a $230 billion market capitalisation is a single point of failure. If BitMine's own equity funding conditions deteriorate — and treasury companies fund purchases through capital markets that close when their share prices fall — the coins become a forced seller rather than a structural holder. That dynamic has played out repeatedly in the corporate crypto treasury model.
The staking pivot cuts against that risk in one way and sharpens it in another. Staked ETH generates yield that services operations without selling principal, which reduces liquidation pressure. But staked ETH also faces exit queues, and a treasury that needs liquidity quickly cannot access it quickly.
For the forecast, BitMine is the reason the floor has held and the reason the floor could fail. It is not a neutral factor and it should not be modelled as one.
The ETH/BTC Ratio at 0.0295 Is the Cleanest Statement of Underperformance
Cross-asset positioning tells the story more honestly than the dollar price.
At $1,913 against Bitcoin's $64,935, the ETH/BTC ratio sits at 0.0295. Ethereum is down 61.4% from its August 2025 all-time high of $4,951.66 while Bitcoin is down roughly 48% from its own record of $126,000 set in October 2025. Earlier in the cycle ETH was described as the deepest underperformer of 2026, down 66% from its peak and 32% year-to-date, with the ratio at a ten-month low.
That relative weakness has persisted through conditions that should have favoured Ethereum. ETH held above $1,700 through a second Iran strike night and recovered its dip faster than Bitcoin, which suggested at the time that the downtrend was maturing. Spot ETH ETFs have now run five consecutive positive weeks while Bitcoin ETFs, despite a strong $853.54 million week, remain roughly $4.5 billion in the red year-to-date after $5.4 billion of first-half outflows. On a flow basis Ethereum's institutional trend is arguably better than Bitcoin's, and the ratio has not responded.
The explanation is the one this analysis has traced throughout: Bitcoin's monetary properties are unchanged, and Ethereum's were altered by its own roadmap. Bitcoin's supply schedule is fixed and its consensus rules have not changed since Taproot activated in November 2021. Ethereum's issuance is dynamic, its burn has collapsed with fees, and its reward schedule is subject to proposals like EIP-8363. An asset whose scarcity is a governance variable trades at a discount to one whose scarcity is a constant.
For a forecast, the ratio provides a usable signal. A sustained move above 0.032 would indicate the market is beginning to price staking yield as an adequate replacement for fee burn, which is the precondition for ETH outperformance. A break below 0.028 would confirm that capital rotating into crypto continues to prefer the simpler monetary asset.
The practical read for this week is that ETH will not decouple. With Wednesday's CPI governing all risk assets and Bitcoin correlation to U.S. equities running high, ETH is a higher-beta expression of the same macro trade. It falls further on a hot print and rallies further on a cool one.
Wednesday's U.S. CPI Is the Only Catalyst on the Calendar
Everything converges on one release, and Ethereum has no crypto-specific event capable of overriding it.
July CPI publishes Wednesday, August 12 at 8:30 a.m. ET, with PPI Thursday and retail sales Friday. Consensus expects the headline annual rate to step down to 3.4% from 3.5% in June and 4.2% in May.
The rate context is what gives the print its force over a non-yielding, high-beta asset. July nonfarm payrolls contracted by 23,000 against a consensus near 80,000, June was revised to 20,000 from 57,000, and revisions removed a combined 103,000 jobs. That cut September Federal Reserve hike odds to roughly 44% to 46% from about two-thirds a week earlier. Ethereum's move from the $1,860s toward $1,925 came directly off that repricing, and demand weakened toward the weekend as the market digested it.
Note the direction of Fed risk. This is a hiking debate, not a cutting cycle — the policy rate sits at 3.75% and officials remain divided on whether to raise as they monitor the oil shock from the Middle East war. For an asset with no cash flow competing against a 4.226% two-year Treasury, every basis point of expected tightening is a direct valuation headwind.
The scenarios are clean.
At or below 3.4%: hike odds fall further, the ten-year retreats from 4.666%, and the ETF bid gets a lower discount rate to buy against. That is the sequence that takes ETH through $1,964 — the upper end of the August range most models project — and opens a path toward the $2,240 area where Citi's revised target sits.
At 3.6% or higher: hike odds return toward 67% with Brent near $85, and ETH loses $1,900 immediately. The next reference is $1,750, and below it the air pocket toward $1,540.
The disinflation arithmetic argues for caution. June's headline reached 3.5% on a negative 0.4% monthly print driven by energy base effects that do not repeat with September WTI at $80.90. Moving from 3.5% to 3.4% is a rounding error with a wide distribution around it.
Ethereum's correlation to U.S. equities has run high through 2026, so the coin gets no independent verdict. It gets whatever the rates market decides, amplified.
Read More
-
Yen Stalls at 160 Despite a 3% JGB and Tokyo Core CPI at 2.0% — Intervention Sits at 164, Friday's Payrolls Decide
02.09.2026 · TradingNEWS ArchiveEnergy
-
QQQ ETF ($739) Fades From an Early Tech Rally as a 77.9 ISM Prices Index Meets Micron's $61.5B Guide — $760 Record Test Ahead
01.10.2026 · TradingNEWS ArchiveStocks
-
XRPR and XRPI Follow XRP's $1.49 Test as Spot Funds Hold 1.16B XRP and a 1 Billion Token Escrow Release Lands — $1.70 in Play
01.10.2026 · TradingNEWS ArchiveCrypto
-
November NG Slips Below $3 as Decade-High Storage Meets Capped LNG Exports — $2.75 in Sight
01.10.2026 · TradingNEWS ArchiveCommodities
-
Dollar-Yen at 158 Presses Toward 160 as a 363 bp Carry Gap Meets Katayama-Bessent Intervention Risk — 159 in Sight
01.10.2026 · TradingNEWS ArchiveForex
Citi at $2,240 Against Standard Chartered at $7,500
The analyst dispersion on Ethereum is the widest in major crypto, and the gap encodes exactly the tension this forecast has been tracing.
Citi cut its 12-month Ether target to $2,240 from $3,175, citing negative ETF flows, weaker investor demand, limited regulatory momentum and broader risk-off conditions. Standard Chartered's Geoff Kendrick has forecast that Ethereum could reach $7,500 by end-2026, with CLARITY Act passage as the key upside trigger. Prediction market traders sit closer to the middle, with most positioning for a year-end finish between $3,000 and $3,500 rather than anything near five figures.
Model-driven estimates cluster low. One forecast set puts August 2026 between a $1,736.35 minimum and a $1,964.01 peak, with end-of-summer near $1,850.18 and December between $1,837.32 and $1,922.38. Another projects the second half reaching $2,582.92 to $2,792.54, with a more conservative path toward $2,423.35. Base-case ranges of $1,700 to $3,300 appear repeatedly, with bull cases of $6,000 to $10,000 predicated on increased spot ETF inflows, monetary easing and network upgrades.
A range from $2,240 to $7,500 on the same asset over the same twelve months is a 3.3x spread, and the two ends are not analysing different data. They are weighting the same facts differently: Citi is pricing the fee-burn collapse and choppy flows, Standard Chartered is pricing regulatory clarity unlocking institutional allocation at scale.
The regulatory leg has already slipped. The Senate left Washington for its August work period without voting on the CLARITY Act, pushing the vote to September. That removes the specific catalyst Standard Chartered's target depends on from the near-term calendar, which is one reason ETH has not participated in the risk rally that carried the S&P 500 to 7,757.64.
The honest synthesis for a near-term forecast: the low end of the range is currently better supported by observable data. Five weeks of inflows totalling $244.9 million in the most recent week is a positive trend, but $11.46 billion of cumulative flows across two years is not the institutional wave the bull targets require. The $2,240 to $2,500 zone is the realistic upside for 2026 absent legislation.
Exchange Balances at Multi-Year Lows and Whales Still Accumulating
The on-chain picture supports the floor argument even where it cannot support a breakout.
Exchange balances have fallen to multi-year lows, meaning the ETH held in venues where it can be sold immediately has contracted materially. Combine that with 41 million coins staked and BitMine's 5,797,813 held off-market, and the liquid float is a fraction of the 120.47 million total supply.
Whale behaviour reinforces it. One tracked address withdrew 10,500 ETH — roughly $20.06 million — from OKX within a single hour in early August, and that transaction followed several other large over-the-counter purchases reported across recent weeks. The pattern is high-net-worth buyers accumulating during consolidation rather than chasing strength, which is the same behaviour visible in Bitcoin's mid-sized wallet cohort.
The DeFi data shows the coins are being deployed rather than parked. Total value locked crossed $40.6 billion in July from a $36 billion June low, with Lido up 20%, Aave 16%, Binance Staked ETH 16.2% and Sky 6.5%. Rising TVL during a price drawdown means participants are earning yield on holdings rather than exiting them.
Options positioning has been tilted bullish. Recent readings showed 24-hour call volume of 76,494 contracts against 34,443 puts for a put/call ratio of 0.45, with call open interest at 7,708 against 3,771 puts and total open interest of 11,479. Weekly value traded reached $2.38 billion.
Set that against the price and the conclusion is uncomfortable for bulls. Exchange balances at multi-year lows, 34.23% of supply staked, a 4.8% corporate holder still buying, whales accumulating, DeFi TVL up 13% month-over-month, five consecutive weeks of ETF inflows, options skewed toward calls — and ETH trades at $1,913, up roughly 3% from where it sat in early July.
Every available demand and supply-restriction metric is constructive and the price is flat. That combination has one honest interpretation: continuous issuance to 41 million staked coins is supplying the market at a rate that absorbs all of it. The inflationary reality of post-burn Ethereum is showing up in the tape even though it does not show up in the sentiment data.
What Would Actually Break the Downtrend
For a forecast to be useful it has to specify the conditions that change the regime rather than restate the range.
Three developments would matter, in order of tractability.
First, staking ETF launches with meaningful assets. The four-million-coin activation queue on BlackRock's proposed staked product against a 20,700-coin exit queue quantifies latent demand. If those products launch and accumulate assets without creating visible liquidity strain, ETH acquires the institutional identity it has lacked — a regulated, yield-bearing digital asset rather than a non-yielding speculation. That is the single most important structural development available, and it is a matter of when rather than whether.
Second, ETF inflows extending past a handful of weeks into a sustained trend. Five consecutive positive weeks is meaningful and it is not yet decisive. The April 2026 reversal, which delivered $356 million after a six-month negative streak, subsequently gave way to $540 million and $528 million of May and June outflows. The current streak has to survive a hot CPI print to be treated as structural. Monthly inflows of $365 million need to become monthly inflows above $1 billion before they can drive a re-rating.
Third, a demonstration that Layer 2, stablecoin and tokenization activity creates economic value for ETH itself. This is the hardest and most important. Ethereum has succeeded at moving activity to cheaper execution layers and has not yet shown that the value migrates back to the base asset. Until a mechanism exists that converts L2 volume into ETH demand at scale, the asset is a claim on validator rewards rather than on network usage.
The CLARITY Act vote in September is the fourth item, and it is the one Standard Chartered's $7,500 target rests on. Federal market-structure rules would define jurisdictional treatment and potentially open bank balance-sheet access to digital assets. That is a genuine catalyst and it is legislative rather than analytical, which means it cannot be forecast — only positioned around.
Absent all four, ETH trades its range. The technicals reclaiming the 50-EMA and 200-DMA, multiple days of ETF inflows and multi-year-low exchange balances are the fingerprints of a maturing downtrend, not a confirmed reversal.
Levels, Scenarios and Position Discipline Into Friday
The forecast resolves into three paths with defined triggers and probabilities.
Base case, roughly 55%: ETH holds the $1,750 to $1,964 range through Wednesday and into next week. A CPI print at 3.4% in line with consensus confirms a Fed on hold without cutting, the ETF streak extends at the current $200 million to $250 million weekly pace, staking absorbs incremental supply at 34.23% and rising, and BitMine continues buying toward its six-million target. Expect chop between $1,850 and $1,950, consistent with model projections putting end-of-summer near $1,850 and the August peak near $1,964.
Bull case, roughly 25%: CPI prints at or below 3.2%. September hike odds fall below 25% from the current 44% to 46%, the ten-year breaks 4.60%, and ETF inflows accelerate past $92.2 million single-day readings. That takes $1,964, then the $2,000 psychological level, and opens the path toward Citi's revised $2,240 target. The $2,400 to $2,500 zone is the level that has to be reclaimed before any $3,000 discussion is credible, and that requires either staking ETF launches with real assets or a September CLARITY Act passage.
Bear case, roughly 20%: CPI prints 3.6% or higher with Brent above $85. Hike odds return toward 67%, ETH loses $1,900 immediately, and the five-week ETF streak breaks as it did in May and June. First target $1,750. Below it there is very little structure until $1,540 and the 2026 low at $1,505.68 — a 19% air pocket from current levels. EIP-8363 gaining traction alongside would compound it by threatening the staking yield the entire remaining thesis depends on.
Discipline: $1,900 is the line and it just lost the mechanical support of the August 9 max-pain pin. $1,964 is the first genuine resistance and $2,240 is the first credible target. Below $1,750 there is no support to lean on, which means stops belong above that level rather than below it.
Ethereum is a higher-beta expression of the same macro trade governing Bitcoin and equities this week. It has better flow data and worse monetary properties than Bitcoin. Size for the beta, not for the narrative, and do not carry leverage into Wednesday at 8:30 a.m. ET.