Euro Slides to 1.1184 as Hot US CPI Lifts Fed Half-Point Odds to 15% — Bulls Need 1.1350
The pair failed at 1.1252 before the CPI release and now sits 79 pips above its 1.1105 yearly low | That's TradingNEWS
Key Points
- EUR/USD fell to 1.1184 after failing at 1.1252, leaving it 79 pips above the 1.1105 low of 2026.
- The US 2-year Treasury yield jumped 19 basis points to 4.736% after October core CPI rose 0.3%.
- Eurozone inflation rose to 4.0% in October while core held at 2.5%, keeping the ECB at a 2.50% deposit rate.
EUR/USD traded at 1.1184 at 14:50 UTC, down 0.34% on the day, after the US October CPI report pushed the pair back through 1.1200. Before the data, the pair had climbed to 1.1251 and then 1.1252 in the European morning, its best level in six sessions, as falling oil and weaker US yields pressured the dollar. That rally reversed in two steps. Fed Governor Christopher Waller’s hawkish speech in London knocked the pair back to 1.1220. The CPI release at 13:30 UTC then sent it through 1.1200 to an initial low of 1.1180. That leaves the day’s range at 72 pips from top to bottom, with the euro giving back all of the morning’s gains and more.
The pair opened Tuesday at 1.1224, the same level it closed at Monday after a 0.69% gain that recovered more than half of Friday’s drop. On Friday, the euro fell 0.67% to 1.1144 after a strong US jobs report, touching 1.1131. Monday’s low of 1.1136 and high of 1.1226 set up Tuesday’s test of 1.1250, which failed.
The broader picture is weak. EUR/USD is down 2.9% from 1.1557 a year ago and sits 7.4% below its 52-week high of 1.2081, set on January 27, 2026. The pair’s 2026 low is 1.1105, printed on October 29, and the current price is just 79 pips above it. The 2026 average stands at 1.1560, which means spot trades 376 pips below its own average for the year. Over the past 90 days, the pair has traded between 1.1127 and 1.1688, and the lower end of that range is now back in reach.
The dollar index rose 0.3% to trade near 102.00 after the CPI print, recovering from 101.408 earlier in the session. On Monday the index fell 0.56% to 101.71 as oil dropped. Friday’s jobs data had pushed it up to 102.32. That round trip between 101.4 and 102.3 in three sessions matches the euro’s swing between 1.1131 and 1.1252.
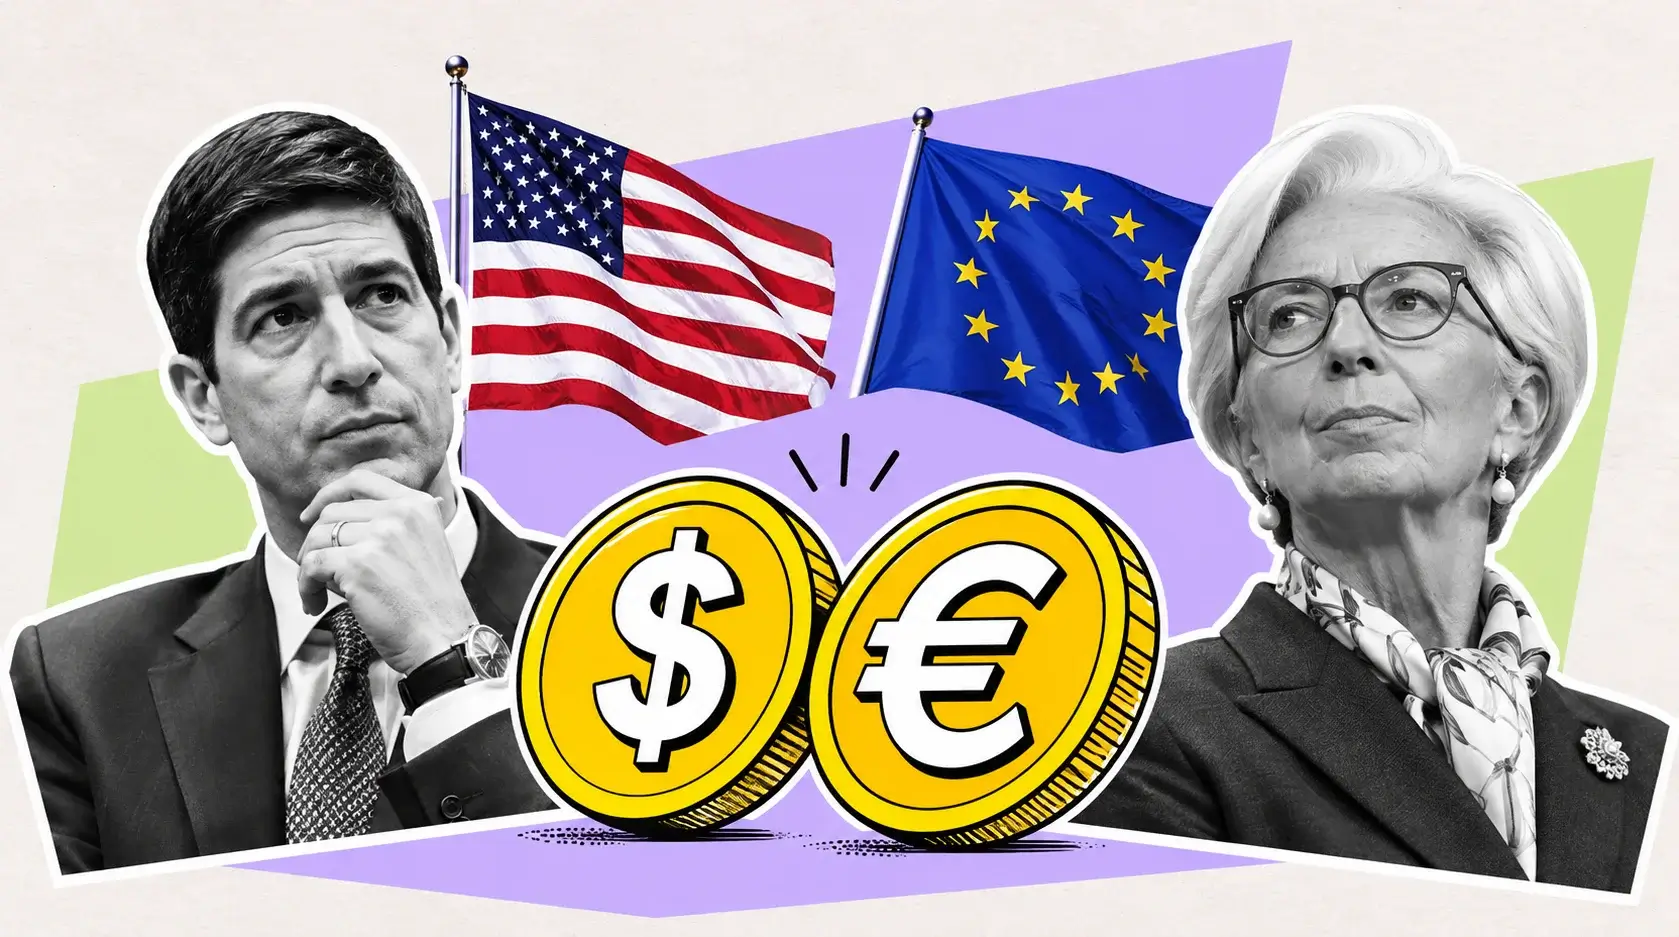
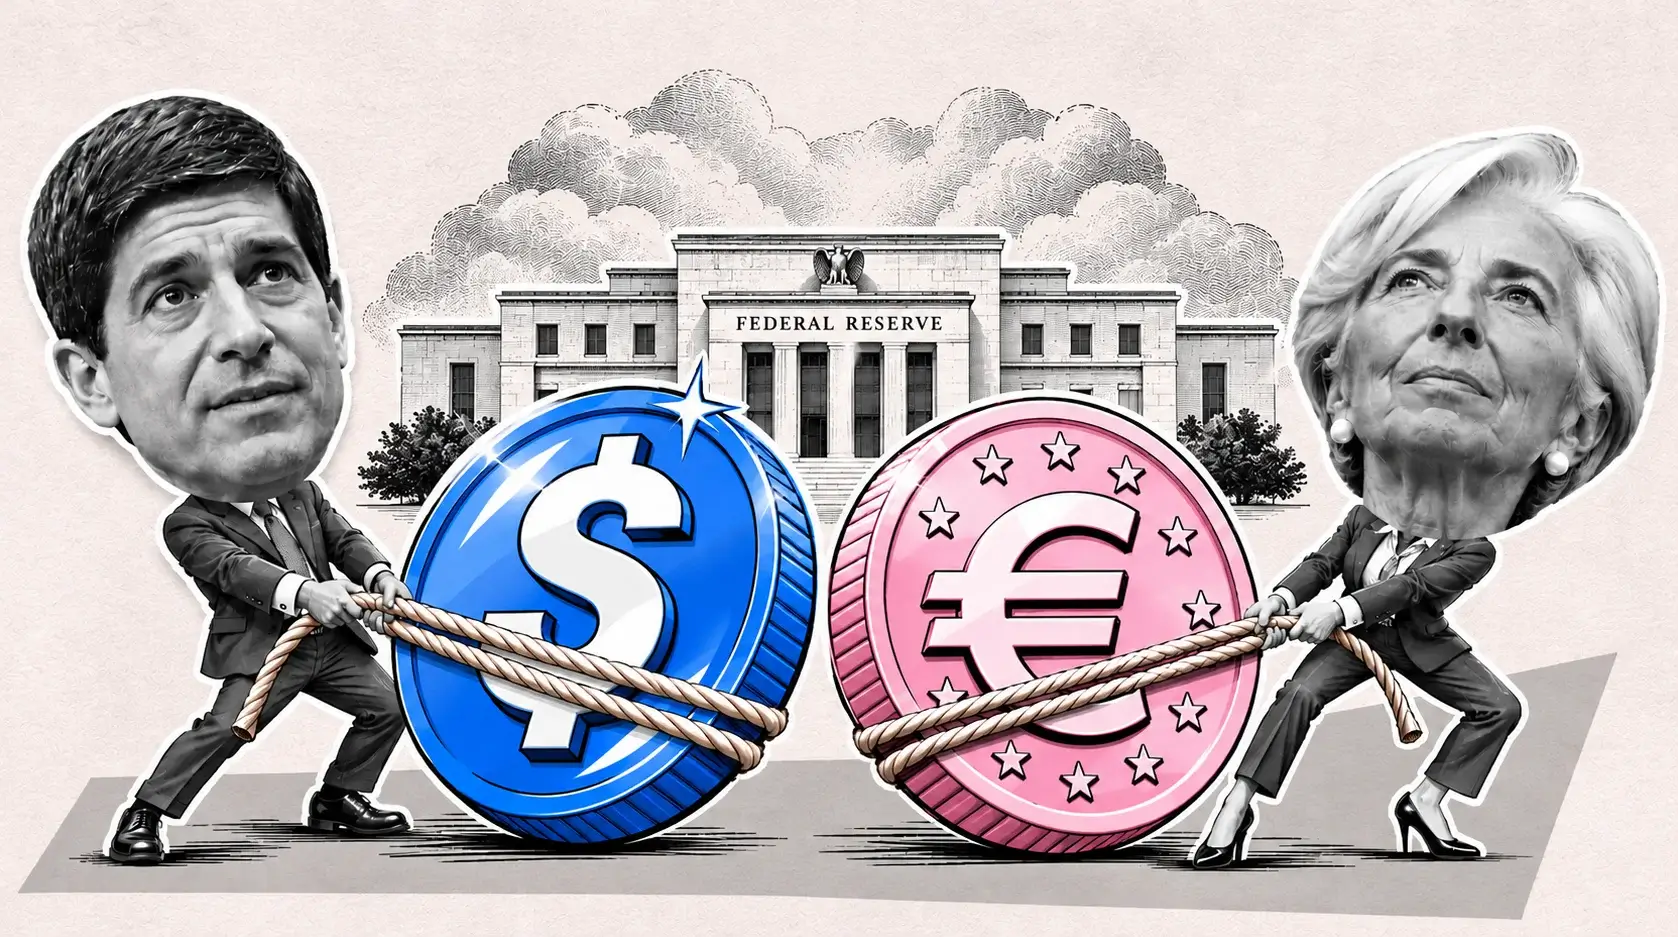
This article’s thesis is that the Fed-ECB rate gap still favors the dollar, and today’s data widened it. The ECB is stuck at a 2.50% deposit rate with a weak economy and French fiscal stress. The Fed is debating a half-point hike. Falling oil helps the euro as an energy importer, but it isn’t enough to offset a 19-basis-point jump in the US 2-year yield. The near-term bias is bearish, with 1.1105 the first target. The upside target for a recovery is 1.1350, 1.5% above 1.1184, which requires a reversal in US yields.
The US CPI Print: 0.4% Headline, 0.3% Core, and a Live Half-Point Debate
The Bureau of Labor Statistics October 2026 CPI release is the main reason the euro reversed. The all-items index rose 0.4% in October against a 0.3% forecast, slowing from September’s 0.6%. Core CPI rose 0.3% against a 0.2% forecast, matching September and August. October was the third straight 0.3% core print and the fifth month of 2026 with core at 0.3% or higher.
The details show broad price pressure. Shelter rose 0.3% and accounted for more than 30% of the headline gain. Food rose 0.5%. Energy rose 0.7% after a 5.2% surge in September, and gasoline rose 1.0% after a 9.1% jump. Medical care, auto insurance, recreation and airfares pushed core higher. Used cars fell 1.2%. There’s no official annual rate this month because October 2025 prices weren’t collected during last year’s shutdown.
Waller had set the bar before the data. He said he leaned toward a 25-basis-point December hike even if inflation cooled, and that a 50-basis-point hike should be considered if core came in around 0.3% or higher. He added that hiking only 25 basis points would put the Fed’s credibility at risk. Core hit exactly 0.3%. Dallas Fed President Lorie Logan said two more hikes will be needed and warned that the PCE inflation gauge could also come in hot later this month.
Fed funds futures adjusted fast. Odds of a December hold dropped to zero from more than 30% a week earlier. Odds of a 25-basis-point hike rose to 85%, and odds of a 50-basis-point hike rose from 0% on Monday to 15%. A quarter-point hike would lift the Fed’s target range from 3.75%–4.00% to 4.00%–4.25% at the December 9 decision. Among economists, 56 of 101 expect the Fed funds rate to peak at 4.00%–4.25%, a thin majority that leaves room for more tightening.
The timing matters for EUR/USD. The November CPI is due December 10, the day after the Fed decides, so October’s report is the last inflation reading the committee sees. That locks in a hawkish backdrop for the next four weeks. For the euro, that means every US data release between now and December 9 carries upside risk for the dollar.
US Yields Reprice: the 2-Year Jumps 19 Basis Points to 4.736%
Short-dated Treasury yields did most of the work against the euro. The US 2-year yield rose 7.8 basis points in the first minutes after the CPI release and approached 4.70%. At 8:35 a.m. ET it was at 4.69%, up 14 basis points. By 10:18 a.m. ET it reached 4.736%, up 19 basis points on the session. The 10-year yield rose from 4.93% after the print to 4.99% by 10:18 a.m., up 13 basis points, and was quoted at 4.992% just after 11 a.m. The 30-year rose a smaller 3 basis points to 5.29%.
Currency markets follow the short end of the curve because it tracks expected central bank policy over the next two years. A 19-basis-point move in the US 2-year in a single morning shifts the yield gap against the euro by a similar amount, unless European yields move too. German yields didn’t keep pace. The German 10-year Bund traded at 3.3414%, down 1.35 basis points. That puts the US-German 10-year spread at 165 basis points, up roughly 14 basis points on the day.
That spread is the core of the dollar’s edge. An investor choosing between US and German government bonds earns 165 basis points more by holding Treasuries at the 10-year point. At the 2-year point, the gap is wider still, because the Fed is hiking from a higher base than the ECB. That yield advantage pulls capital toward dollar assets and supports the greenback against the euro.
Before today, the euro had a tailwind from falling US yields. Monday’s oil slide pulled US rates lower and lifted EUR/USD 0.69%. Early Tuesday, the same dynamic pushed the pair to 1.1251. Waller’s speech and the CPI print reversed that within hours. The euro is trading as a pure function of the US rate path, with European fundamentals playing a secondary role.
For EUR/USD, the US 2-year at 4.70% is the line that matters. A hold above 4.70% keeps the dollar supported and points the pair toward 1.1105. A drop back below 4.60%, which would require a soft PPI on Friday or dovish Fed minutes on November 18, would give the euro room to retest 1.1250.
The ECB at 2.50%: Hiking Into Weakness
The ECB has also been tightening, but from a much lower base and with less conviction. The ECB’s deposit facility rate stands at 2.50%, with the main refinancing rate at 2.65% and the marginal lending rate at 2.90%. The bank raised all three by 25 basis points in June, taking the deposit rate to 2.25%, then again on September 10, taking it to 2.50%. On October 29, it held rates unchanged, as expected, and the euro fell that day.
The ECB’s problem is stagflation risk. Inflation is high and rising, but growth is weak. The bank has to fight energy-driven price pressure while the eurozone economy struggles under high energy costs, the effects of the Middle East conflict and French fiscal stress. Raising rates too fast risks recession. Holding too long risks letting inflation take root.
Markets price an 88% chance of an ECB hike at the December meeting. If both the Fed and the ECB hike by 25 basis points in December, the policy gap stays at 150 basis points between the Fed’s 4.25% upper bound and the ECB’s 2.75% deposit rate. That’s why the ECB’s December hike doesn’t help the euro much. It’s already priced, and the Fed is matching it.
The euro needs the ECB to move faster than the Fed, or the Fed to stop. Neither is likely before December. Waller’s half-point talk points in the opposite direction, widening the gap rather than narrowing it.
The distance between the two central banks has defined EUR/USD all year. In January, when the euro hit 1.2081, markets expected the Fed to cut and the ECB to hold or hike. That expectation reversed in the spring as US inflation climbed and the Fed turned hawkish. The euro has given back 897 pips since then. As long as the Fed stays more aggressive than the ECB, the pair’s path of least resistance points down.
There is one scenario that would flip this. If US growth slows sharply under Fed tightening while European inflation stays high, the ECB could end up hiking longer than the Fed. That would narrow the gap and support the euro. But that is a 2027 story, not a December one.
Eurozone Inflation at 4.0%: Energy Is the Driver, Core Is Steady
Eurozone inflation is rising, and for the wrong reasons. Eurostat’s flash estimate for October put annual inflation at 4.0%, up from 3.8% in September and the highest level in three years. Energy drove the increase. Core inflation, which excludes energy, food, alcohol and tobacco, stayed at September’s level of 2.5%. Final October figures are due from Eurostat on November 18.
September’s breakdown showed the energy shock clearly. Headline inflation was 3.8%, up from 3.2% in August. Energy inflation hit 18.8%, up from 14.3%. Services inflation rose to 3.2% from 3.0%. Food, alcohol and tobacco rose 1.4%, and non-energy industrial goods rose 1.1%. Core rose to 2.5% from 2.4%.
Country data confirms the pressure. Spain’s harmonized inflation rate was 4.9% in October, down a tenth from September, with core inflation at 3.1%. Spanish consumer prices rose 0.6% from September to October.
This mix is bad for the euro. Inflation driven by energy is a supply shock. It squeezes consumers and businesses and slows growth, while pushing the headline rate higher. A central bank that hikes into a supply shock risks tipping the economy into recession without fixing the source of inflation. That limits how aggressive the ECB can be, even with headline inflation at 4.0%.
Compare that with the US. American core inflation is running at 0.3% a month, which annualizes to well above the Fed’s 2% target, and the pressure is in services, shelter and insurance. That is demand-driven inflation, the kind central banks can fight with higher rates. The Fed has both the reason and the room to keep hiking. The ECB has the reason but less room.
The October energy figure matters more for the euro than the headline. Oil prices have fallen sharply since then. Brent fell 16% last week and another 5.5% on Monday to $92.91, while WTI fell 4.1% to $87.07. On Tuesday morning, Brent traded at $90.82, down 1.89%. If energy prices keep falling, eurozone inflation should ease in November and December, which takes pressure off the ECB and makes further hikes less likely. That is a medium-term negative for the euro, even though lower oil helps the eurozone’s trade balance in the near term.
Oil Collapse Helps the Euro, but Not Enough
The eurozone is a large energy importer, so falling oil prices are one of the few clear positives for the euro right now. Brent crude fell 16% last week and another 5.5% on Monday to $92.91 a barrel. On Tuesday morning it slid another 1.89% to $90.82, and WTI fell 1.52% to $85.53, both at their lowest since late August. President Trump said he plans to hold off on new strikes on Iran and later called further strikes highly unlikely. US-Russia-Ukraine talks are under way, and hopes of a US-Iran deal are building.
Lower oil helps the euro in two ways. First, it improves the eurozone’s trade balance. Europe buys most of its oil and gas from abroad, and every dollar drop in the price means less money flowing out of the bloc. Second, lower energy prices ease inflation fears, which supports growth expectations and risk assets in Europe.
Monday showed the effect clearly. The oil slide sent the dollar index down 0.56% to 101.71, and the dollar weakened against every major currency. EUR/USD rose 0.69%, recovering more than half of Friday’s drop. Early Tuesday, the same dynamic pushed the pair to 1.1252.
Today’s session showed the limit. Lower oil can soften the dollar, but it can’t overcome a hawkish Fed. When US core CPI comes in at 0.3% and a Fed governor talks about a half-point hike, rate differentials outweigh trade balances. The 19-basis-point jump in the US 2-year yield erased the oil benefit within hours.
There’s a second-order effect worth watching. Falling oil lowers inflation on both sides of the Atlantic. In the US, October’s CPI still reflected past energy increases, and November’s should show relief. In Europe, lower energy prices could pull headline inflation back from 4.0%. If US inflation cools faster than European inflation, the Fed could pause sooner than expected, which would narrow the rate gap and support the euro. That’s the path to the 1.1350 upside target.
For now, oil acts as a floor under the euro rather than a catalyst for gains. Without Monday’s oil slide, EUR/USD would likely be testing 1.1105 today. With it, the pair is holding above 1.1180.
French Fiscal Stress: the OAT-Bund Spread Hit 178 Basis Points
France is the euro’s biggest internal weakness. The spread between 10-year French government bonds (OATs) and German Bunds touched 178 basis points on October 22, its widest since late 2011, before easing to 156 basis points on October 26 and pushing back to 161 basis points on October 28. In February, the spread stood at just 55 basis points. It moved past 120 basis points by early October and past 130 basis points after the October 1 budget presentation, leaving France’s risk premium wider than both Italy’s and Greece’s.
The numbers behind the spread are heavy. French public debt has climbed to 121.7% of GDP, and annual interest costs are approaching €91 billion. The French government has cut its 2026 growth forecast to 0.5% from 0.7% and acknowledged it will likely miss its target of reducing the 2026 deficit to 5% of GDP. The National Assembly vote on the budget in November is the next test, followed by presidential and parliamentary elections in 2027.
For EUR/USD, French stress matters because it raises the risk of a eurozone-wide confidence problem. When French yields rise relative to German yields, investors price a higher chance of fiscal trouble in the euro’s second-largest economy. That pushes money into German Bunds as a safe haven and, at the margin, out of the euro entirely. The September widening in the spread was driven mostly by Bunds outperforming, which shows investors were seeking safety within the euro area.
French stress also constrains the ECB. A central bank hiking rates while a major member’s bond spread widens risks making that country’s debt burden worse. That limits how far the ECB can go, even with inflation at 4.0%. It’s another reason the ECB is likely to move more slowly than the Fed.
The spread has eased from its October peak, which has helped the euro stabilize above 1.1105. A clean narrowing toward 100 basis points, which would likely require the budget to pass intact, would remove one source of downside pressure. A renewed widening past 178 basis points would likely push EUR/USD below its 2026 low.
The French situation adds a risk premium the dollar doesn’t carry. The US has its own fiscal deficits, but Treasury yields reflect Fed policy, not default fears. For the euro, French spreads are a separate source of weakness on top of the rate gap.
US Jobs and the Dollar’s Data Edge: 165,000 Payrolls
Today’s CPI print landed on top of a strong US labor report, and together they’ve reset the dollar’s footing. On Friday, November 6, the US economy added 165,000 jobs in October, well above the 65,000 forecast and the 29,000 gain in September. Private payrolls rose 159,000 against an expected 64,000. Government payrolls added 6,000. Unemployment held at 4.1%. The October gain was more than three times the 12-month average of 48,000 a month.
EUR/USD reacted sharply. The euro fell 0.67% on Friday to close at 1.1144, after touching 1.1131. The dollar index rose to 102.32. Over the full week, the euro gave back more than a full figure, from a high of 1.1266 to Friday’s close.
The jobs data and the CPI print tell the same story. The US economy is running hot enough to keep the Fed hiking. Strong hiring, solid wages and core inflation at 0.3% a month leave the Fed no reason to pause. The eurozone, by contrast, has weak growth and energy-driven inflation, a mix that argues for caution at the ECB.
The midterm elections added a short-lived twist. The dollar fell on November 4 after Democrats’ sweeping midterm win, which gave the party control of both the Senate and the House. EUR/USD traded as high as 1.1273 that day, its best level of the month. That dollar weakness reflected political uncertainty and expectations of tighter fiscal oversight. It faded within 48 hours as the jobs data refocused attention on the Fed.
Among economists, 29 of 37 said risks to the medium-term US inflation outlook hadn’t changed since the midterms. That suggests the election hasn’t shifted the policy outlook enough to change the dollar’s rate advantage. The data still drives the dollar.
The next tests for the US data edge are Friday’s producer-price report, the Fed minutes on November 18, PCE later in the month and the November jobs report on December 4. A soft reading on any of those would give the euro a chance to recover. Hot readings would keep the pair under pressure toward 1.1105.
Positioning: Record Euro Shorts Set Up Two-Way Risk
Speculative positioning is stretched against the euro, which raises the risk of sharp moves in both directions. In late October, speculative gross shorts on euro futures reached a record 360,945 contracts. That was a record level of bets against the single currency, built as the euro slid toward its 2026 low at 1.1105.
Crowded positioning cuts both ways. On one hand, it confirms the bearish view. Many traders are already short the euro because of the rate gap, French stress and weak growth. On the other hand, when so many traders are on the same side, any surprise can trigger a fast squeeze as shorts rush to cover.
The past week showed both forces. On Monday, a sharp oil slide and a weaker dollar lifted the euro 0.69% in one session, part of which reflected short covering. Early Tuesday, the pair rallied to 1.1252 before the data. Then the hot CPI print reversed the move, and shorts who had covered on Monday likely rebuilt positions on Tuesday.
That pattern suggests positioning is amplifying data surprises. A soft US print triggers short covering and a quick euro rally. A hot print restores shorts and pushes the euro lower. With so many traders already short, the euro’s downside on hot data is smaller than its upside on soft data. That is the asymmetry that makes 1.1350 a credible upside target even in a bearish trend.
Short positioning also helps explain why the euro hasn’t broken below 1.1105 despite repeated tests. Each time the pair approaches its 2026 low, short sellers take profits, creating buying pressure that bounces the pair. The 2026 low on October 29 at 1.1105 held, and Friday’s dip to 1.1131 also held. That buying from profit-taking shorts acts as soft support.
For the near term, positioning supports range trading between 1.1105 and 1.1273, with sharp moves on each data release. A clean break of either end would likely trigger a fast move as crowded positions get squeezed or extended. A break below 1.1105 would catch longs who bought the October low. A break above 1.1273 would force shorts to cover in size and could push the pair quickly toward 1.1350.
Read More
-
Yen Stalls at 160 Despite a 3% JGB and Tokyo Core CPI at 2.0% — Intervention Sits at 164, Friday's Payrolls Decide
02.09.2026 · TradingNEWS ArchiveEnergy
-
Rocketlab Slides to $54 as Neutron Slips to 2027 and the Q3 Loss Widens to $0.12 — Bulls Need $65
10.11.2026 · TradingNEWS ArchiveStocks
-
Bitcoin Slides to $73,124 as 0.3% Core CPI Lifts Hike Odds and IBIT Bleeds — Reclaiming $80,000 Is the Upside Target
10.11.2026 · TradingNEWS ArchiveCrypto
-
Gold Slides to $4,053 as Hot CPI Lifts Half-Point Hike Bets — $4,360 Is the Upside Target
10.11.2026 · TradingNEWS ArchiveCommodities
-
S&P 500 Sinks to 7,496, Nasdaq and Dow Fall as Hot CPI Revives Half-Point Hike Bets; Bulls Need 7,650
10.11.2026 · TradingNEWS ArchiveMarkets
-
Yen Firms Toward 156.10 as Tokyo Discloses ¥15.4T Summer Intervention and BoJ Eyes a December Hike to 1.50%
09.11.2026 · TradingNEWS ArchiveForex
For the near term, positioning supports range trading between 1.1105 and 1.1273, with sharp moves on each data release. A clean break of either end would likely trigger a fast move as crowded positions get squeezed or extended. A break below 1.1105 would catch longs who bought the October low. A break above 1.1273 would force shorts to cover in size and could push the pair quickly toward 1.1350.
Technical Picture: Below the Moving Averages, Range Floor at 1.1105
The daily chart is in a downtrend. EUR/USD at 1.1184 trades below its short-term moving average at 1.1295 and below resistance at 1.1350. The pair has made lower highs since January’s peak at 1.2081, and its longer-term moving averages are sloping down. Rallies in October and November have repeatedly stalled below 1.1273, a sign sellers remain in control.
The intraday levels are clear. The daily pivot sits at 1.11964, and the pair is now trading below it, which points to a bearish bias for the session. Support S1 is at 1.11664, followed by the 2026 low at 1.1105 and the 1.1100 round number. Below 1.1100, the main longer-term downside reference is 1.1065. Resistance R1 sits at 1.12544, matching today’s failed high of 1.1252. Above that, 1.1266 and 1.1273, the November highs, cap the range, followed by the moving average at 1.1295 and resistance at 1.1350.
The pattern since October 29 is a sideways range with a downward bias. The pair hit 1.1105 that day, then rallied to 1.1273 on November 4, then fell to 1.1131 on November 6, then bounced to 1.1252 on November 10 before the CPI. That’s a 168-pip range between 1.1105 and 1.1273. The current price at 1.1184 sits slightly below the midpoint at 1.1189.
On the hourly chart, an ascending channel formed after the November low at 1.1131 and carried the pair to 1.1252. Today’s CPI move broke the lower edge of that channel, which signals the short-term recovery has ended. The hourly relative strength index had climbed close to 70 into the data, an overbought reading that left the pair exposed to a reversal.
The short-term trading view favors selling rallies. With the pair below 1.1196 and the dollar index back at 102.00, traders are likely to treat bounces toward 1.1220 to 1.1250 as selling opportunities. A break below 1.1166 would open a test of 1.1131, Friday’s low, and then 1.1105.
The bigger technical question is whether 1.1105 holds. That level has now been tested in late October and approached again on November 6. A third test that holds would form a base and set up a move toward 1.1350. A break would confirm a new leg lower toward 1.1065 and potentially the 1.1000 handle.
The Dollar Index at 102: the Other Half of the Trade
EUR/USD is the mirror image of the dollar index, and the euro accounts for 57.6% of that index’s weight. When the dollar index moves, the euro is the main counterweight. The index rose 0.3% to trade near 102.00 after the CPI, recovering from 101.408 earlier in the session. That move from 101.4 to 102.0 accounts for most of the euro’s fall from 1.1252 to 1.1184.
The dollar index has traded in a tight band around 102 for several weeks. It hit 102.32 on Friday after the jobs data, fell to 101.71 on Monday as oil collapsed, dropped to 101.408 early Tuesday and then rebounded to 102.00 after Waller and the CPI. In October, the index stalled under 102.50 three times in four sessions, and the euro’s lows in those sessions came just above 1.1150 in the same quarter-hour as the index’s highs.
That correlation shows the 102.50 level on the dollar index is effectively the floor for the euro near 1.1100 to 1.1150. A break above 102.50 would likely push EUR/USD below its 2026 low. Holding below it keeps the euro in its range.
Other currencies are confirming the dollar’s strength today. The Australian dollar fell below 0.6900 after the CPI, and the British pound failed to hold gains above 1.3459. USD/JPY climbed back into the 158s after Waller’s remarks, from 157.95 on Monday. Broad dollar strength across major pairs points to a US-driven move rather than euro-specific weakness.
That’s useful for reading EUR/USD. When the euro falls because of European problems, like French spreads or weak German data, it underperforms other currencies against the dollar. When it falls because of US strength, it moves in line with the pound, the yen and the Australian dollar. Today’s move is the second kind. That means the euro’s direction from here depends mostly on the US data calendar.
For the euro to break higher, the dollar index needs to fall back below 101.40, Tuesday morning’s low. That would likely require a soft US data print and lower Treasury yields. For the euro to break lower, the index needs to clear 102.50, which would likely follow another hot data release or a hawkish shift in Fed messaging.
The Calendar Ahead: PPI, Fed Minutes, PCE and the December Showdown
The next four weeks are packed with events that will set the euro’s direction. On Friday, the US producer-price report for October will show whether wholesale inflation confirms the CPI’s heat. On November 17, the ZEW survey will update German and eurozone economic sentiment; the German index read 28.1 in October against a 30.2 forecast, down from 34.7 in September. On November 18, the Fed releases minutes from its October meeting, and Eurostat publishes final October inflation data for the eurozone.
Later in November, the US PCE price index will arrive, and Logan has already warned it could run hot. On December 4, the November US jobs report lands. The Fed decides on December 9, with an 85% chance of a 25-basis-point hike and a 15% chance of 50 basis points. US CPI for November comes the following day, December 10. The ECB’s December meeting follows, with markets pricing an 88% chance of a hike to 2.75%.
The French budget is a parallel risk. The National Assembly vote on the 2026 budget in November will test whether France can deliver its fiscal plans. A failed or diluted budget would likely widen the OAT-Bund spread back toward its October peak of 178 basis points and push the euro lower. A clean passage would ease pressure.
Each event carries asymmetric risk for the euro. Hot US data reinforces the rate gap and pushes EUR/USD toward 1.1105. Soft US data, especially a cooler PPI or PCE, would trigger short covering and could push the pair toward 1.1273 or higher. Because positioning is crowded short, the upside reaction to soft data would likely be larger than the downside reaction to hot data.
The December central bank meetings are the main event. If the Fed hikes 25 basis points and signals a pause, while the ECB hikes 25 basis points and signals more to come, the rate gap would start to narrow for the first time this year. That would support a recovery toward 1.1350. If the Fed hikes 50 basis points or signals several more hikes in 2027, the gap widens, and the euro likely breaks below 1.1105.
Scenarios, Levels and the Verdict for EUR/USD
EUR/USD’s near-term path runs through three levels: 1.1105, 1.1273 and 1.1350.
The bearish scenario starts with a daily close below 1.1105, the 2026 low set on October 29. That would break the base the pair has defended twice and would likely trigger stop-loss selling from longs who bought the October low. The next targets would be 1.1065 and then 1.1000. Triggers include a hot producer-price report on Friday, a US 2-year yield holding above 4.70%, a dollar index break above 102.50, hawkish Fed minutes on November 18 or a renewed widening of the OAT-Bund spread toward 178 basis points.
The base case is a range between 1.1105 and 1.1273 through the December 9 Fed decision. The rate gap would cap rallies near 1.1250 to 1.1273, while short covering and lower oil would defend the 1.1105 floor. Each data release would push the pair toward one edge of the range without breaking it. This fits the price action since late October, when the pair has swung within a 168-pip band.
The bullish scenario needs US yields to fall. EUR/USD would first need to reclaim the daily pivot at 1.1196 and then break above Tuesday’s failed high at 1.1252. A close above 1.1273, the November high, would force crowded shorts to cover and open a path to the 1.1295 moving average and then the 1.1350 upside target, 1.5% above the current 1.1184. Triggers include a soft PPI print, a cooler PCE, a Fed that signals a pause after December, further oil declines and passage of the French budget.
The verdict is bearish in the near term, with 1.1350 as the upside target. EUR/USD at 1.1184 has broken below 1.1200 after a hot core CPI print revived talk of a half-point Fed hike and sent the US 2-year yield up 19 basis points to 4.736%. The ECB is stuck at 2.50% with eurozone inflation at 4.0% driven by energy rather than demand, which limits how hard it can push back. French fiscal stress adds a risk premium, and the dollar index has recovered to 102.00. Falling oil and crowded short positioning provide a floor near 1.1105, but not a catalyst for a sustained rally. A test of 1.1105 is more likely than a run to 1.1350 before the December 9 decision. A daily close above 1.1273 would invalidate the bearish view and put 1.1350 in play.