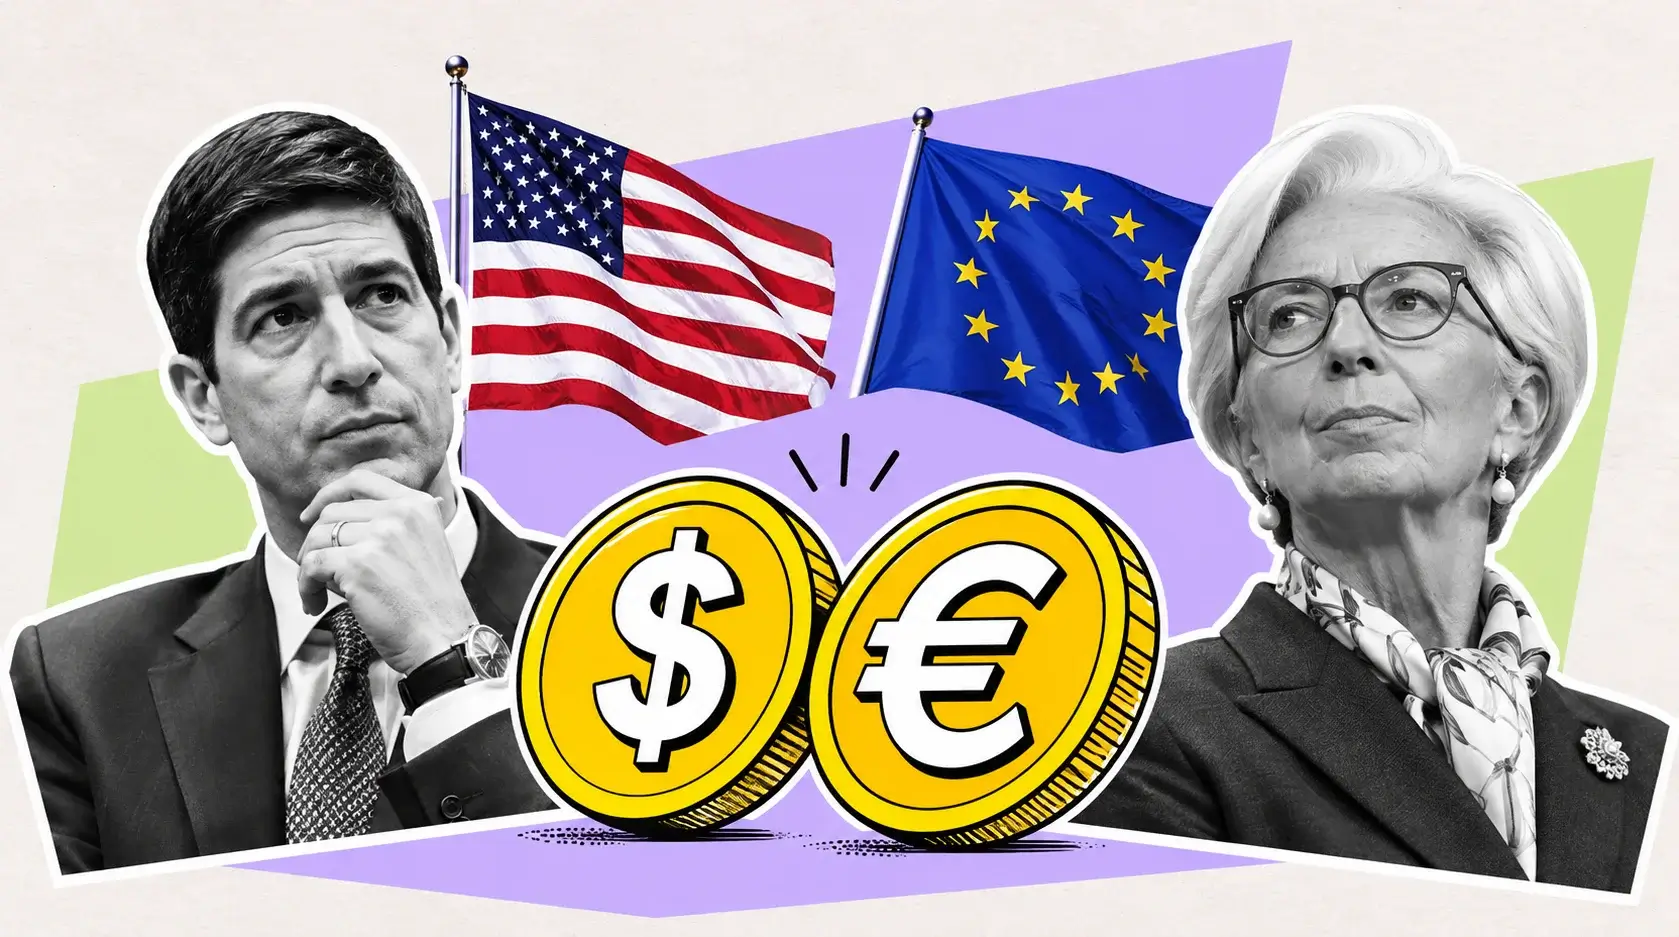
Pound Rallies to 1.3423 as Bank of England Matches Fed at 4% and Eyes 4.25% in February
Sterling gains 67 pips to close near its 1.3427 session high as EUR/GBP falls to 0.8347 | That's TradingNEWS
Key Points
- GBP/USD up 0.50% to 1.3423, range 1.3339–1.3427; 2026 high 1.3867, low 1.3141, average 1.344.
- BoE voted 8–1 to hike to 4.00%, Mann backed 4.25%; inflation seen near 5% mid-2027, Feb hike to 4.25% expected.
- 10-year gilt at 5.15% beats the 4.87% US 10-year; Fed December hike odds 80%; Brent near $93.80.
GBP/USD traded at 1.3423 at 17:19 GMT on Monday, November 9. That is up 0.0067, or 0.50%, from Friday’s close of 1.3356. The pair opened at 1.3344 and dipped to a session low of 1.3339 in early European trade. It then climbed steadily to an intraday high of 1.3427 and spent the rest of the day pinned against that top, finishing just four pips below it. A close at the session high after a gain that size shows buyers kept control through the afternoon rather than fading the move into the US open.
The 1.3423 level puts sterling 17 pips above its 2026 average of 1.344, almost exactly at the midpoint of a year that has swung between two clear extremes. The high came on January 27 at 1.3867, when the pair approached 1.39. The low came on June 24 at 1.3141, when energy prices and gilt stress pushed it toward 1.31. From that June low, the pound has recovered 282 pips, a 2.15% gain. From the January peak, it sits 444 pips lower, a 3.20% drawdown. The 52-week range runs from 1.3039 to 1.3847, so today’s price is in the upper half of the 12-month band without approaching either edge.
Monday’s move did not come out of nowhere. It follows the Bank of England’s November 5 decision to raise Bank Rate to 4.00%, the first increase since August 2023. Monday’s gain is the first session where the market fully priced the policy shift against a softer dollar backdrop. The Dollar Index stood at 101.93, the S&P 500 added 1.9%, and the FTSE 100 rose 0.87% to 10,766.52. When London equities rise alongside sterling, it points to domestic confidence rather than a one-sided dollar sell-off.
The rally was broad-based. EUR/GBP fell to 0.8347, which puts GBP/EUR at 1.1974, so the pound outperformed the euro on the same day that EUR/USD traded at 1.1208. Sterling also gained against the yen, with USD/JPY at 157.99 putting GBP/JPY near 212.07. When a currency rises against the dollar, the euro and the yen at the same time, the move is driven by its own story rather than by dollar flows alone.
That story now runs through three channels: a central bank that has turned hawkish, gilt yields above 5%, and an oil price that has eased toward $93.80. Each supports the pound for a different reason, and each carries its own risk. This week’s calendar tests every one of them, starting with US CPI on Tuesday and UK third-quarter GDP on Thursday.
The November 5 Hike Rewrote the Bank Rate Story
The Monetary Policy Committee voted 8–1 on November 5 to lift Bank Rate by 25 basis points to 4.00%. That ended a hold that had lasted through several meetings and reversed the easing cycle that began in 2024. The vote split matters as much as the decision. In July and September, the committee held rates with 6–3 votes. In November, eight members backed a hike and the lone dissenter wanted a larger one. The committee did not drift toward tightening. It moved there decisively, in one meeting.
For GBP/USD, the scale of the shift is the point. Until early autumn, the pound traded on an assumption that UK rates had peaked and would grind lower through 2026 and 2027. That assumption capped sterling rallies all year and contributed to the slide from 1.3867 in January to 1.3141 in June. The November hike removed it. Rate markets now treat 4.00% as a floor for the coming months rather than a ceiling, and currencies follow the expected path of policy rates more closely than any other single input.
Governor Andrew Bailey framed the decision around inflation risk tied to energy. He said the scale of the upside threat depends on progress in the Middle East and acknowledged there is a case for a further increase. A governor who leaves the door open to another hike days after delivering the first is signalling a tightening phase, not a one-off insurance move. Currency traders read it that way, and that reading explains why sterling built on its post-decision gains on Monday instead of giving them back.
The decision also changes how the Bank of England compares with its peers. At 4.00%, Bank Rate sits 150 basis points above the European Central Bank’s 2.50% deposit rate. It is level with the top of the Federal Reserve’s 3.75%–4.00% target range. In 2024 and much of 2025, the UK was easing alongside the Fed and the pound had no yield advantage to defend. Now the UK has the highest policy rate in the G3-plus-UK group at the top end, and the 0.8347 EUR/GBP rate shows the euro side of that gap is already being priced.
The November hike gives the pound a policy anchor it lacked for most of 2026. The anchor holds as long as UK inflation keeps running hot enough to justify further action. If October CPI on November 18 surprises to the downside, the case for a February hike weakens and the support behind sterling weakens with it. Until then, the 8–1 vote is the dominant fact in the pair.
Mann’s 4.25% Vote and the February Path
The single dissent on November 5 came from Catherine Mann, who voted to raise Bank Rate by 50 basis points to 4.25%. A dissent in the hawkish direction after a hike tells the market that the internal debate is about how far and how fast to tighten, not whether. It tilts the risk of the next decision toward another increase and makes a quick reversal very unlikely.
The median forecast now puts Bank Rate at 4.25% after the February meeting. That would be a second 25-basis-point move within three months and would put UK policy above the current top of the Fed’s range for the first time in this cycle. Whether February delivers depends on three releases: Q3 GDP on November 12, the labour market report on November 17 and October CPI on November 18. Each feeds directly into how comfortable the committee’s centrists are with backing Mann’s direction.
The two-year gilt yield shows how much of that path is already priced. At around 4.78%, it sits 78 basis points above the current Bank Rate. A spread that wide between the two-year yield and the policy rate implies the market expects average rates over the next two years to sit well above 4.00%. That fits more than one further hike, or a long period at an elevated level. The pound’s gains since November 5 are anchored to that pricing.
The asymmetry matters for traders. If February brings a hike to 4.25%, a meaningful share of it is already in the two-year yield and in the pair’s recovery from 1.3141. The upside for sterling from simply delivering what is expected is limited. The larger reaction would come from signs the committee is open to 4.50% or beyond, or from evidence that it plans to stop at 4.00%. The first would push GBP/USD toward 1.35 and beyond. The second would drag it back toward the 1.3339 session low and potentially the 1.33 handle.
Mann’s vote also matters as a signal of the committee’s tolerance for growth weakness. The Bank projects GDP growth of 1.6% in 2026 and 1.3% in 2027, and it estimates Q3 growth at 0.7% for the quarter. A committee willing to tighten while forecasting slowing growth puts inflation above activity in its reaction function. For a currency, that ranking is supportive in the short run. It turns into a risk only if growth falls far enough to force a reversal, and nothing in the current projections points to that before the February meeting.
A 5% Inflation Projection Sets the Hawkish Floor
The most important number in the November Monetary Policy Report is not the 4.00% Bank Rate. It is the inflation projection. The Bank expects consumer price inflation to climb to around 5% by mid-2027. That is more than double the 2% target and well above September’s 3.5% reading. A central bank forecasting 5% inflation 18 months out has no room to cut. It also has a strong case to keep tightening until the projection comes down.
That projection drives the pound’s floor. As long as the Bank’s own models show inflation heading toward 5%, markets cannot price a return to easing. The two-year gilt yield stays elevated and sterling keeps a yield cushion against the dollar and the euro. Before the November report, the debate centred on how soon cuts would resume. The 5% figure ended that debate, and the 2.15% recovery from June’s 1.3141 low reflects that shift.
The source of the projected rise is energy. Bailey tied the scale of upside risk directly to developments in the Middle East, which have pushed oil prices up through 2026 and lifted UK household energy costs. Brent trading near $93.80 already eases part of that pressure. If crude keeps falling, the path toward 5% flattens and the Bank’s next forecast round could revise it lower. That is the main route by which the hawkish case could unwind without any change in domestic data.
For GBP/USD, the inflation projection creates a two-sided risk. In the near term, it locks in policy support and makes it hard for the pair to fall far while the Bank is in tightening mode. Over a longer horizon, inflation near 5% erodes real incomes, weighs on consumer spending and raises the risk of stagflation, where prices rise while growth slows. Currencies in stagflation tend to perform well while the central bank is hiking. They often weaken once markets begin to price the damage to growth.
The current balance favours the first phase. Bank Rate at 4.00% against September CPI of 3.5% gives a real policy rate of +0.50%. Against core CPI of 2.8%, the real rate is +1.20%. Those positive real rates are what currency investors are paid to hold sterling, and they widen with each hike as long as inflation does not accelerate faster. If Bank Rate reaches 4.25% in February while headline CPI stays near 3.5%, the real rate would widen to +0.75%. That is sterling-supportive and is the core reason the pair trades near 1.34 rather than 1.31.
September CPI at 3.5% and What October Must Show
UK consumer price inflation rose to 3.5% in September from 3.1% in August, a 40-basis-point jump in a single month. Prices rose 0.4% month on month. The CPIH measure, which includes owner-occupier housing costs, rose to 3.6%. RPI reached 3.9%. Those figures, released before the November meeting, were the immediate trigger for the committee’s swing from 6–3 holds to an 8–1 hike.
The composition of the September number matters for sterling’s next move. Core CPI, which strips out energy, food, alcohol and tobacco, was 2.8%. Services inflation was 3.7% and goods inflation 3.2%. The gap between a 3.5% headline and a 2.8% core shows how much of the rise came from energy and food rather than from the domestic economy. Services inflation at 3.7% is the measure the committee watches most closely for wage-driven pressure. It is elevated but not accelerating at the pace of the headline.
That split defines the October release on November 18. If headline CPI rises again toward 4% while core holds below 3%, the hawkish case stays intact but remains tied to energy. In that case, the outlook depends on oil. If core and services both rise, the inflation problem is spreading into domestic prices, and the February hike becomes close to certain with a possible follow-up. That outcome would put 1.35 in play for GBP/USD. If headline CPI falls back toward 3.1%, traders would start questioning the need for further tightening, and the pair would give back part of the post-November 5 gains.
The base effect from October 2025 also matters. Energy price caps adjust quarterly, and the October cap change feeds directly into the monthly print. With Brent near $93.80, the October reading should carry some of the earlier energy surge rather than any relief from recent price declines. That timing favours another firm headline number, which suits sterling bulls heading into the release.
The CPI release is the single biggest scheduled risk for GBP/USD this month. It lands one day after the labour market report and six days after Q3 GDP. Those three releases decide the February vote. A strong inflation number following solid GDP and a stable labour market would be the most sterling-positive outcome available, and it would test the 1.35 level within days. Soft inflation following weak GDP would be the opposite and would put the 1.3339 low and the 1.33 handle back in focus.
Gilts at 5.15% Carry Both Support and Warning
The 10-year gilt yield stands at roughly 5.15%. The two-year yield is about 4.78%, which gives a positive 2s10s slope of 37 basis points. On October 7, the 30-year gilt yield broke above 6%. These are among the highest long-end yields in the developed world, and they cut both ways for sterling.
The supportive side is simple. Higher yields attract foreign capital looking for income, and that capital has to buy pounds to buy gilts. The 10-year gilt yields about 28 basis points more than the US 10-year Treasury at 4.87%. For most of the last decade, US yields sat above UK yields and the dollar had the stronger income case. That relationship has flipped. A positive UK-US yield spread at the 10-year point gives sterling structural demand from global bond investors, and it helps explain why the pair has held the 1.34 area.
The warning side is fiscal. Long-end gilt yields above 6% reflect more than inflation expectations. They also carry a premium for the UK’s debt load and for doubts about the government’s ability to manage borrowing. When yields rise because investors demand more compensation for fiscal risk rather than because the central bank is tightening, the currency can fall alongside bond prices. That combination of rising yields and a falling pound appeared in the June slide toward 1.3141, when gilt stress and the energy shock hit sterling at the same time.
The key question for GBP/USD is which force drives yields from here. If the front end leads, with the two-year yield climbing on Bank of England expectations, sterling benefits. If the long end leads, with the 30-year pushing back above 6% on fiscal concerns while the short end holds steady, the pound faces pressure. The 37-basis-point 2s10s slope is moderate and gives no immediate signal of fiscal stress. A steepening beyond 50 basis points driven by the long end would be an early warning for sterling bulls.
Monday’s equity move adds context. The FTSE 100 gained 0.87% to 10,766.52 alongside sterling’s 0.50% advance. A stronger pound usually weighs on the index, because many of its members earn their revenue in dollars. Both rising together points to domestic risk appetite rather than a fiscal scare. As long as UK stocks and sterling rally together, the gilt market’s high yields are working for the pound rather than against it.
Rate Parity With the Fed Removes the Dollar’s Carry Edge
With Bank Rate at 4.00% and the Federal Reserve’s target range at 3.75%–4.00%, UK policy now matches the top of the US range. For most of the past three years, the dollar held a yield advantage over sterling, and investors were paid to hold dollars rather than pounds. That advantage is gone at the policy-rate level, and at the 10-year point it has reversed, with gilts yielding about 28 basis points more than Treasuries.
Rate parity changes the way the pair responds to news. When the dollar holds a clear carry advantage, sterling rallies tend to fade because holding the pound costs money relative to the dollar. When rates are level, the pair trades more cleanly on relative surprises in growth, inflation and central bank guidance. That makes GBP/USD more sensitive to this week’s US CPI and next week’s UK inflation data than it was earlier in the year.
The relationship will not stay static. Futures pricing assigns about 80% probability to a Fed hike in December, which would lift the US range to 4.00%–4.25%. On the UK side, the median forecast points to a hike to 4.25% in February. If both happen, parity is preserved at a higher level, with the Fed moving first. For six to eight weeks between those meetings, the US would hold a modest advantage at the top of its range. That window could cap sterling rallies through December and January.
The euro side looks very different. The ECB deposit rate at 2.50% leaves a 150-basis-point gap in sterling’s favour. That spread is the main reason EUR/GBP has dropped to 0.8347 and GBP/EUR has risen to 1.1974. For GBP/USD, the euro relationship matters indirectly. When sterling outperforms the euro, it tends to hold up better against the dollar when the dollar strengthens broadly. That relative resilience is one of the reasons the pair held above 1.33 during the softer stretches of October.
The practical effect for traders is that GBP/USD has lost the downward drift that dollar carry gave it through 2025 and early 2026. Moves now reflect fresh data rather than a structural yield headwind. With the Dollar Index at 101.93 and EUR/USD at 1.1208, the dollar is not in a strong trend against the majors. In that environment, the side with the more hawkish central bank wins. For the moment, the Bank of England holds that position.
December Fed Hike Odds at 80% Keep the Dollar Bid Alive
The Federal Reserve is the counterweight to sterling’s rate story. Futures pricing puts the probability of a December hike at around 80%. That would take the target range to 4.00%–4.25%. The Fed is tightening for the same reason the Bank of England is: energy-driven inflation that has spread through 2026. The difference is timing. The Fed’s December decision lands two months before the Bank’s February meeting.
The October payrolls report showed the US economy added 165,000 jobs. That is a steady pace of hiring and gives the Fed room to tighten without risking an immediate downturn. Tuesday’s CPI release is the next key input. A hot number would lift December hike odds above 90% and support the dollar into the meeting. A soft number would cut them closer to 60% and remove one of the main obstacles to further sterling gains. The full release will be published by the Bureau of Labor Statistics.
For GBP/USD, Tuesday’s US CPI matters as much as the UK data later in the month. If US inflation surprises higher while UK inflation holds steady on November 18, the market would price a Fed path that runs ahead of the Bank of England, and the pair would struggle to break 1.35. If US inflation softens and UK inflation firms, the policy gap shifts toward the pound and the 1.3847 top of the 52-week closing range becomes a realistic medium-term target.
The broader dollar picture is mixed rather than strong. The Dollar Index at 101.93 is not trading near a level that signals broad dollar dominance. USD/JPY at 157.99 shows the dollar firm against the yen, where rate gaps remain wide. EUR/USD at 1.1208 and AUD/USD at 0.6917 show the dollar is not crushing the higher-yielding or cyclical currencies. A 1.9% gain in the S&P 500 on Monday points to risk appetite, and risk-on sessions usually work against the dollar’s safe-haven demand.
The December Fed decision is the clearest scheduled dollar-positive event before year-end. Its effect on GBP/USD depends on the accompanying guidance. A hike paired with signals of more to come would push the pair back toward 1.33. A hike framed as a final insurance move would let sterling extend toward 1.35 on the expectation that the Bank of England has more tightening left than the Fed. With 80% already priced, the hike itself is largely expected. The guidance carries the market risk.
Brent Near $93.80 Is the Hidden Lever for Sterling
Oil sits behind every major move in GBP/USD this year. The UK imports a large share of its energy, so higher crude prices raise household costs, worsen the trade balance and lift inflation more than they do in the US, which is a net energy exporter. When Brent rises, the Bank of England faces a sharper inflation problem and the UK economy takes a larger hit to growth. That combination produced the June slide to 1.3141.
Brent’s pullback toward $93.80 eases both of those pressures at once. Lower crude reduces the UK’s import bill, softens the inflation outlook and lightens the pressure on consumer spending. For sterling, falling oil is a double positive: it improves the economic outlook while leaving the Bank of England’s current hawkish stance in place. That pattern helped Monday’s 0.50% gain land without any shift in UK rate expectations.
The risk sits in the Bank’s own framing. Bailey tied the scale of the inflation threat directly to developments in the Middle East. If those developments ease further and Brent drops below $90, the 5% inflation projection for mid-2027 becomes harder to defend. The market would start pricing a shorter tightening cycle, with February possibly the last hike. In that case, sterling would lose part of its rate support even as the growth outlook improved, and the net effect on GBP/USD would likely be flat to modestly negative.
The opposite case is more dangerous. A renewed spike in crude above $100 would push UK inflation toward the 5% projection faster, force more hikes and squeeze growth at the same time. That is the stagflation scenario, and it hit sterling hardest in June. In that environment, rate hikes stop supporting the currency because markets focus on the damage to the economy rather than on the yield. The 1.3141 low would be the first downside target in a renewed oil shock.
The current Brent level sits in the zone where sterling benefits most. Prices are high enough to keep the Bank of England hawkish but low enough to stop the growth outlook from deteriorating. That middle ground can hold for weeks, but it is fragile. Traders in GBP/USD need to watch crude as closely as they watch gilt yields. A $5 move in Brent in either direction would shift the pair’s outlook more than most scheduled UK data releases. Weekly US inventory data from the Energy Information Administration and Middle East headlines are now direct sterling drivers.
Read More
-
Yen Stalls at 160 Despite a 3% JGB and Tokyo Core CPI at 2.0% — Intervention Sits at 164, Friday's Payrolls Decide
02.09.2026 · TradingNEWS ArchiveEnergy
-
Oklo Eyes $30 After 38% 2-Day Rally as $3.13B Cash Pile Offsets Aurora’s 2028–2029 Startup Slip
09.11.2026 · TradingNEWS ArchiveStocks
-
XRP Heads for $1 Test After Binance Hacker Dumps 139M Tokens and ETF Inflows Stall for Four Days
09.11.2026 · TradingNEWS ArchiveCrypto
-
Brent ($93) Extends 16% Weekly Collapse as Iran Deal Heads to Trump — Physical Murban at $99 Warns of Snapback
09.11.2026 · TradingNEWS ArchiveCommodities
-
S&P 500 Hits 7,517, Nasdaq Jumps 578 Points, Dow Climbs to 52,139 as NVDA Sheds $175B
09.11.2026 · TradingNEWS ArchiveMarkets
-
EUR/USD (1.1204) Bounces on Oil Collapse While Fed Hike Odds Hold at 80% — 1.1105 Floor and 1.1273 Ceiling
09.11.2026 · TradingNEWS ArchiveForex
Growth at 1.6% Leaves Little Room for Error
The Bank of England projects UK GDP growth of 1.6% in 2026 and 1.3% in 2027. It estimates Q3 growth at 0.7% for the quarter. That would be a strong quarterly reading by UK standards, after second-quarter growth of 0.4%. The Office for National Statistics publishes the first Q3 estimate on Thursday, November 12. It is the first major test of whether the economy can absorb a rate hike without stalling.
A 0.7% quarterly figure would mark an acceleration from 0.4% in Q2. It would support the Bank’s view that the economy has enough momentum to handle tighter policy. For sterling, a print near or above that estimate would confirm that the hiking cycle is not about to crush growth. That would keep the February hike on track and give the pair room to test 1.35. A weaker figure near 0.3% or below would revive stagflation concerns and bring the pair back toward 1.3339.
The labour market report on November 17 adds a second test. Unemployment stood at 4.9% in the prior release, high by recent UK standards and a sign that the labour market has loosened. If unemployment rises above 5%, the committee’s centrists would grow more cautious about another hike, even with inflation projected near 5%. If it holds at 4.9% or falls, the case for February tightening strengthens. Wage growth inside the same report matters just as much, since services inflation at 3.7% depends on pay pressure.
The growth forecasts show how narrow the margin is. A slowdown from 1.6% to 1.3% while Bank Rate rises and inflation climbs toward 5% leaves the economy exposed to any external shock. A renewed oil spike, a fiscal scare in the gilt market or a sharp slowdown in Europe could push growth below 1% quickly. Once growth falls that far, the policy debate shifts from fighting inflation to protecting the economy, and the currency usually weakens before the central bank changes course.
For now, growth is strong enough to support the hawkish case. The FTSE 100 at 10,766.52 and Monday’s 0.87% gain show equity investors are not pricing an imminent UK downturn. The 2s10s gilt slope of 37 basis points is positive, which argues against a recession signal from the bond market. As long as Thursday’s GDP figure lands near the Bank’s 0.7% estimate, sterling keeps the combination it needs: tight policy, positive real rates and an economy that is still expanding.
The Cross Picture Confirms Broad Sterling Demand
Monday’s GBP/USD gain looks stronger once the crosses are considered. EUR/GBP fell to 0.8347, putting GBP/EUR at 1.1974. A pound buying close to 1.20 euros is near the strong end of its recent range against the single currency. It reflects the 150-basis-point gap between Bank Rate at 4.00% and the ECB deposit rate at 2.50%. The euro side of sterling is driven almost entirely by that rate gap, and it widened on November 5.
Against the yen, sterling is even firmer. With USD/JPY at 157.99 and GBP/USD at 1.3423, GBP/JPY sits near 212.07. That is an elevated level that reflects the wide gap between UK rates and Japanese rates. The cross is popular with carry traders, who borrow in yen and invest in higher-yielding currencies. Strong demand for GBP/JPY feeds back into GBP/USD because carry buyers have to buy pounds outright.
The cross picture matters because it separates sterling strength from dollar weakness. If GBP/USD rose while EUR/GBP climbed, the move would come mainly from a falling dollar, and the pound would be along for the ride. That type of rally fades quickly when the dollar recovers. Monday’s pattern was the opposite. EUR/GBP fell while GBP/USD rose, so sterling outperformed both the dollar and the euro. That is pound-specific demand, and it tends to last longer.
The comparison with other dollar pairs supports the same reading. EUR/USD at 1.1208 and AUD/USD at 0.6917 did not show the same strength as GBP/USD. With the Dollar Index at 101.93, the dollar was not collapsing across the board. Sterling’s 0.50% gain stood out against that backdrop. When one currency outperforms its peers on a quiet macro day, the market is usually repositioning after a policy shift. Last week’s hike is the clear driver.
The cross that would signal trouble is EUR/GBP. A rebound above 0.85 would show euro buyers returning and would suggest the pound’s rate advantage is being questioned, either because UK data have disappointed or because the ECB has turned less dovish. Until that happens, the euro side keeps backing sterling against the dollar. Traders using GBP/USD for directional positions should watch EUR/GBP as a confirmation signal. A falling EUR/GBP validates pound strength. A rising EUR/GBP while GBP/USD climbs would mean the move is mostly about the dollar and is more vulnerable to reversal.
Technical Map: 1.3427 Ceiling and the 1.35 Gate
The first resistance level for GBP/USD is Monday’s high at 1.3427, four pips above the current price. A close above 1.3427 would confirm the breakout from the 1.3339–1.3427 range and open the way toward 1.3450. From there, the next target is the 1.35 round number, 77 pips above the current price. That is the level that matters most in the near term.
The 1.35 level is more than a psychological marker. It sits above the 2026 average of 1.344 by 60 pips and would put the pair firmly in the upper part of this year’s range. It is also roughly halfway between the June low of 1.3141 and the January peak of 1.3867. That makes it a natural pivot between the bearish first half of the year and any renewed uptrend. A weekly close above 1.35 would shift the medium-term structure from range-bound to bullish.
Above 1.35, the next significant zone runs from 1.3600 to 1.3650. That area marked a congestion zone in the spring decline. Beyond it, the key targets are 1.3847, the top of the 52-week closing range, and 1.3867, the January 27 intraday peak. Reaching 1.3847 would require a 424-pip rally from current levels, a 3.16% gain. That would likely need both a February hike confirmed by data and a softer Fed path after December.
Momentum favours the upside in the short term. The pair closed four pips below its session high, which points to steady buying into the close. The 0.50% gain was the largest single-day move since the November 5 decision. A daily pattern of higher lows since the June bottom at 1.3141 remains intact. The 2.15% recovery from that low has come in steps rather than sharp spikes, a pattern that tends to hold better than a single rally on news.
The main technical risk is a failed breakout. If the pair touches 1.3427 again but cannot close above it, sellers would gain confidence and target the 1.3339 session low. A failure at 1.3427 ahead of Tuesday’s US CPI would be the first warning sign. For bullish positions, a daily close above 1.3427 is the trigger to target 1.35. A close back below 1.3380 would cancel the near-term upside and shift attention to the lower end of the recent range.
Downside Map: 1.3339, 1.3141 and the 52-Week Floor
The first support level is Monday’s session low at 1.3339, 84 pips below the current price. That level coincides with the opening area of 1.3344 and Friday’s close of 1.3356. Together, they form a 17-pip support band. A close below 1.3339 would erase Monday’s entire gain and suggest the rally was a short-lived reaction to positioning rather than the start of a new leg higher.
Below 1.3339, the 1.33 round number is the next marker. It was a congestion area in October before the November 5 decision. A break below 1.33 would put the pair back where it traded before the Bank of England hike. That would mean the market had decided the hike was a one-off rather than the start of a cycle. A soft October CPI print on November 18 combined with a weak Q3 GDP figure on November 12 is the most likely trigger.
The major downside target is the 2026 low at 1.3141, set on June 24, 282 pips below the current price. That low came during the combined hit from an oil spike and gilt market stress. A return there would almost certainly require both again. A renewed surge in Brent above $100, paired with a fiscal scare that pushed the 30-year gilt yield back above 6%, would recreate those conditions. That is the stagflation scenario and the main threat to the current recovery.
Below 1.3141, the 52-week low at 1.3039 marks the floor of the 12-month range, 384 pips below today’s price, or 2.86%. A test of that level would require a full unwinding of the Bank of England’s hawkish turn and a sharp rise in the dollar, probably driven by a Fed that keeps hiking beyond December. With the Dollar Index at 101.93 and the Fed only expected to hike once more, that scenario is a tail risk rather than a base case.
The downside levels show where the pair’s risks are concentrated. The 84 pips to 1.3339 cover normal volatility around this week’s data. The 282 pips to 1.3141 would take an oil shock or a fiscal crisis. The 384 pips to 1.3039 would take a reversal of the entire UK policy story. Each step down needs a bigger shock than the last, so short positions should key off specific releases rather than a general bearish view. A close below 1.3339 confirms near-term weakness. A close below 1.33 opens the path toward 1.3141.
Event Risk From November 10 to November 18 and the Verdict
The next eight trading days carry the heaviest concentration of scheduled risk for GBP/USD this quarter. US CPI on Tuesday, November 10, opens the sequence. A hot reading would lift December Fed hike odds above the current 80% and push the pair back toward 1.3339. A soft reading would clear the path to 1.35. UK Q3 GDP follows on Thursday, November 12, against the Bank’s 0.7% quarterly estimate and the 0.4% second-quarter figure. Anything at or above 0.7% backs the February hike case.
The UK labour market report on November 17 tests whether unemployment can hold at 4.9% and whether wage growth keeps services inflation near 3.7%. October CPI on November 18 is the decisive release. September’s 3.5% headline, 2.8% core and 3.7% services readings set the benchmark. A headline above 3.5% with steady or rising core would lock in the February move to 4.25% and put 1.35 in reach. A drop back toward 3.1% would revive doubts about a second hike and send the pair to the 1.33 area.
Brent near $93.80 sits behind each of those releases. Lower oil eases inflation and supports UK growth, which helps sterling as long as the Bank stays hawkish. A spike above $100 would bring back the June conditions that pushed the pair to 1.3141. The gilt curve gives the other early warning. A 2s10s slope above 50 basis points driven by the long end, or a 30-year yield back above 6%, would signal that fiscal risk is overtaking rate support.
The balance of forces leans toward sterling. Bank Rate at 4.00% matches the top of the Fed’s range and sits 150 basis points over the ECB. The 10-year gilt at 5.15% yields about 28 basis points more than the US 10-year at 4.87%. The real policy rate stands at +0.50% on headline CPI and +1.20% on core. The 8–1 vote with a dissent for 4.25% sets the direction. Against that, a December Fed hike priced at 80% and a growth outlook slowing to 1.3% in 2027 cap how far the rally can run before year-end.
The verdict on GBP/USD is moderately bullish from 1.3423. A daily close above Monday’s 1.3427 high targets 1.35 within the next two weeks, provided UK GDP lands near 0.7% on November 12 and October CPI holds at or above 3.5% on November 18. The 1.3339 session low is the line that defines the trade. A close below it cancels the bullish case and opens 1.33. The 1.3847 top of the 52-week closing range is a realistic target into the first quarter only if February brings Bank Rate to 4.25% while the Fed signals a stop after December. The main risk is an oil spike above $100 that turns rate support into stagflation pressure and sends the pair back toward the June low at 1.3141.