Gold Price Forecast - Gold Tumbles From $5,600 As Warsh Fed Shock Hits XAU/USD
Record gold rally snaps, with XAU/USD testing $5,000 after Trump’s Fed move, dollar surge, forced margin selling and a violent spillover into silver and miners | That's TradingNEWS
Gold Price Shock: XAU/USD Slams From $5,600 To Sub-$5,000 In One Session
Gold (XAU/USD) has flipped from parabolic to brutal mean reversion in less than 24 hours. After tagging fresh record highs near $5,595–$5,600 per ounce, spot prices collapsed as much as 8–10%, printing intraday lows around $4,941–$4,980 before stabilising in the $5,080–$5,200 band. At the European open one headline described a 6% intraday drop with gold “testing support at $5,000” after an 80% gain in the last 12 months, while another had it down roughly 9% from the week’s peak and trading near $5,154–$5,212. Even after this washout, XAU/USD is still up about 18% year-to-date and remains in the middle of what has been the strongest month for gold in more than four decades. The move is not a gentle pullback; it is a full volatility regime shift at index-level scale.
Macro Shock: Warsh, The Fed And The Dollar Hit XAU/USD Simultaneously
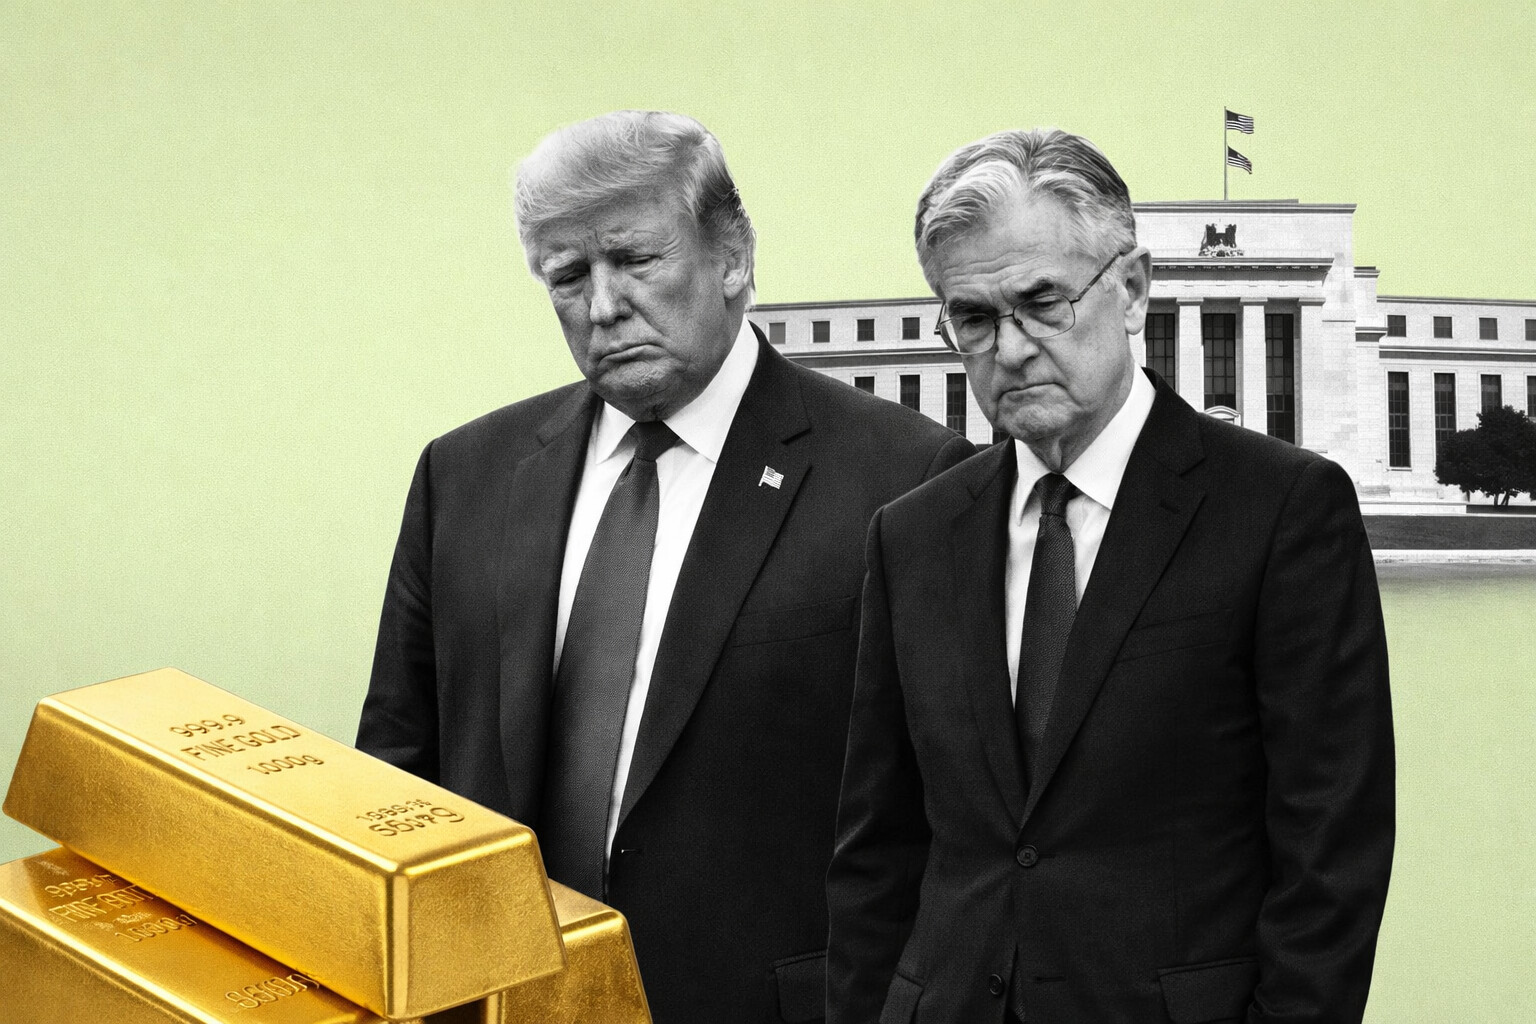
The trigger cluster is clear. Markets had already been leaning heavily into the “weaker dollar, lower real yields, gold to the moon” trade when Donald Trump signalled he would replace Jerome Powell at the Federal Reserve and then moved toward nominating former governor Kevin Warsh. Warsh is read as a more orthodox choice: firmer stance on the balance sheet, less tolerance for ultra-aggressive stimulus, and a stronger focus on inflation control. That combination immediately repriced the entire “easy Fed for longer” narrative that helped push XAU/USD above $5,500.
At the same time, a bipartisan compromise to avoid a U.S. government shutdown removed one of the risk-premium pillars that had supported gold during January’s geopolitical and fiscal noise. The dollar snapped higher on the Warsh headlines and on relief that Washington had at least defused one obvious tail risk. A firmer greenback, higher yields and a partial unwinding of “Fed panic” expectations all arrived into an overextended market. Given gold’s inverse correlation to the dollar, the bounce in the USD translated directly into pressure on XAU/USD, turning what could have been a normal intraday dip into a full-scale air pocket.
Forced Deleveraging: How Margin Calls Turned XAU/USD Into A Funding Source
The macro headlines were the spark; positioning did the real damage. Equities, particularly big U.S. tech, had already started to roll over as disappointing profit numbers from several leading technology names hit the tape. That pushed equity indices lower and triggered margin calls across leveraged portfolios. Traders needing cash do not sell illiquid garbage first; they liquidate what is highly liquid and sharply in profit. With gold sitting on a roughly 80% twelve-month gain and a 20%+ monthly surge, XAU/USD was the perfect ATM.
Flows on the day show classic “raise collateral” behaviour: stock markets in the U.S., Europe and Asia printed meaningful losses, basic-materials sectors underperformed, and Australian miners were among the worst performers on the ASX as gold and other metals tanked. That fits the description from several desks of traders closing positions in gold to meet margin requirements elsewhere. The price collapse in XAU/USD is therefore not just a change in view on the metal itself; it is leverage being yanked out of the entire cross-asset complex in one go.
Extreme Month: XAU/USD Volatility Now At Historic Levels
Multiple sources describe January as arguably “the most volatile month in precious metals history.” The data backs it up. Gold ran from sub-$3,000 levels last year to peaks near $5,595 this week, then dropped around 8–10% intraday. Silver’s behaviour has been even more aggressive: from a recent high around $120.45, XAG/USD collapsed about 17% in one session toward $95, before clawing back toward the $100 area. Platinum and copper were dragged into the same downdraft, with platinum down roughly 13% on the day and copper also giving back a chunk of its recent gains.
Even after the crash, January remains the best month for gold in more than 40 years and the best month on record for silver, with silver still up around 40% year-to-date and gold about 18%. That combination – record-breaking rallies, then double-digit single-day reversals – is exactly what one senior commodities strategist called “classic top-of-the-market behaviour”: confusion, overextension and sudden air pockets when buyers step away for even a few hours. For an asset that normally trades like a slow, defensive hedge, XAU/USD is now behaving more like a high-beta tech stock.
Cross-Asset Pressure: Miners, Silver And Base Metals Confirm The Shock Wave
The pain is not confined to the spot price. Precious-metal miners, which had enjoyed a sustained melt-up on the back of rising XAU/USD, were hammered. New York-listed Newmont and Barrick fell around 6–7%, while London-listed Fresnillo dropped roughly 5%. On the ASX, basic-materials names led the declines, with the sector off more than 4% on the day as spot gold slid toward $5,200 and silver and platinum were dumped.
Silver’s collapse from $120 to the mid-90s in a matter of hours shows just how leveraged the white metal has become to gold’s narrative. After a year-to-date gain of roughly 40% and an all-time high only a day earlier, XAG/USD became the high-beta expression of the gold trade, amplifying the unwind. This is consistent with prior stress episodes in metals: gold corrects, silver overshoots. Base metals were not immune either. Platinum tracked the downdraft with double-digit percentage losses, and copper saw whiplash as the London Metal Exchange had to delay the start of trading due to a technical glitch in the middle of record volatility. The entire metals complex just repriced risk in a very small window.
Technical Damage: XAU/USD Forms A Reversal Pattern Around $5,600
From a pure chart perspective, XAU/USD has finally printed a believable reversal signal after weeks of vertical price action. On the daily chart, gold was rejected only a few dollars below the $5,600 zone and followed that rejection with a large impulsive red candle. If that candle closes as it looks intraday, it completes a classic “Evening Star” formation – one of the more reliable topping patterns in candlestick analysis.
The four-hour chart confirms the deterioration. Price has moved rapidly toward the $5,000 psychological level, with the MACD line crossing sharply below its signal line and the histogram stretching deep into negative territory, signalling strong downside momentum rather than a mild pause. The RSI has slipped to around 43–44 on the four-hour and daily frames – no longer overbought, but still above oversold conditions, which tells you the market has released some pressure but not flushed out entirely. Technically, this is a break from a parabolic leg rather than a complete trend reversal – at least so far.
Key XAU/USD Levels: 5,600 As Resistance, 5,000 As First Line Of Defense
The recent price action redraws the key levels for XAU/USD. On the upside, the $5,400–$5,450 band that capped the last intraday bounce now sits just below the true all-time high around $5,595. This whole zone from $5,400 to $5,600 is now heavy resistance. Any rally into that area will meet trapped longs looking to reduce and new shorts probing for a lower high.
On the downside, the $5,000 mark is the first and most obvious line the market is watching. In price terms, that zone is reinforced by the January 26 low at roughly $4,980. A clean break and daily close below both $5,000 and $4,980 would open the door toward the 100-period moving average on the four-hour chart near $4,822 and the January 21 low around $4,755. Stepping back to a broader technical map, one deep-dive analysis pins a strategic support zone in the $4,550–$4,360 area, where the 50-day EMA intersects with late-2025 highs and the October 2025 peak. That region would represent roughly a 15–20% drawdown from the $5,600 peak – aggressive, but still completely consistent with historical corrections during gold super-rallies.
Structural Drivers: Central Banks, Safe-Haven Demand And The Dollar Regime
The reason the pullback looks like a correction rather than an outright top is that the structural drivers of the gold move have not disappeared. Central banks remain steady net buyers of bullion as they diversify reserves and reduce reliance on the dollar, with some emerging-market institutions aggressively adding tonnage. That flow is slow, persistent and insensitive to short-term volatility; it underpins the long-term bid under XAU/USD.
Safe-haven demand also remains firmly in play. Global political risk has not vanished; it has just been temporarily overshadowed by the Fed story. Tensions spanning Venezuela, Greenland, Iran and broader trade conflicts, plus the constant risk of tariff escalation, have all contributed to the earlier rush into gold and silver. The narrative of gold as a hedge against both inflation and fiscal/monetary disorder is still alive, especially with a U.S. administration publicly pushing for deeper rate cuts at the same time as it reshapes the Fed’s leadership.
The dollar is more complex. Before this crash, gold was rallying even as the dollar hovered near its lowest levels in years, reflecting not just yield differentials but broader confidence issues around U.S. policy. The Warsh nomination and shutdown deal gave the greenback a short-term boost and forced a positioning flush, but that does not eliminate the underlying concerns that had investors moving out of the dollar in the first place. If the dollar rolls over again after this knee-jerk, the backdrop for XAU/USD re-strengthens.
Silver And The High-Beta Precious Trade: XAG/USD As Leverage On XAU/USD
Silver’s behaviour is an important part of the XAU/USD story. The metal had already logged its strongest month on record, with year-to-date gains near 40% and an intraday peak just above $120. From there, XAG/USD dumped to roughly $95 intraday – a 17% collapse – before stabilising just below $100. Technically, resistance is now defined by the $112–$117 band, which coincides with prior highs earlier in the week. First support is the round $100 level, extending down to about $93, the January 14 peak. Beneath that sits a wider $70–$80 support area around the 50-day EMA and late-2025 highs.
Fundamentally, silver remains tied to gold but with a higher beta and an added industrial-demand kicker. Investor flows have picked up in silver ETFs and mining names thanks to the spillover from the gold rally and the narrative around industrial use. As long as silver holds above $93–$100, the recent move looks like a violent but still contained shakeout. A decisive break below those levels would signal that the high-beta precious trade is unwinding more structurally, which would be a clear warning sign for XAU/USD bulls.
Read More
-
VOO ETF Rebounds to $689.80 Toward Its $699 Record as AI Chips Overpower the Iran Shock
09.07.2026 · TradingNEWS ArchiveStocks
-
XRP ETFs Lock Away 970M Tokens With $1.5B of Inflows While the Price Sleeps at $1.09 — The Coiled Spring
09.07.2026 · TradingNEWS ArchiveCrypto
-
Oil Fades to $72.65 WTI Even as the US Strikes Iran a Second Night — The Glut Answers the War Premium
09.07.2026 · TradingNEWS ArchiveCommodities
-
The Yen Sinks to a 40-Year Low Near 162.5 as the Iran Oil Shock Compounds the Widest Rate Gap in Years
09.07.2026 · TradingNEWS ArchiveForex
Miners And M&A: How XAU/USD At 5,000+ Rewrites The Equity Playbook
The change in spot prices is already being reflected in the equity side of the trade. At $5,000–$5,600 gold, margins for efficient producers explode higher, balance sheets improve quickly and marginal projects move into the money. That environment typically triggers a wave of M&A as producers look to buy ounces in the ground to replenish reserves, while developers seek partners or acquirers to de-risk capex and funding. The last month’s surge has already strengthened the case for consolidation, and the latest correction does not erase that – it just adjusts the reference price.
However, the same volatility that creates opportunity also injects risk. On the day of the crash, major gold miners gave back 5–7% in a single session. That is leverage at work. Equity holders are not only exposed to the metal but also to cost inflation, jurisdictional risk and deal execution. A rational approach at these XAU/USD levels is to treat miners as leveraged instruments on the gold price, not as pure substitutes for bullion. Diversification across producers, developers and royalty/streaming companies, possibly via broad ETFs backed by strict filters, is the cleanest way to capture upside while containing single-name blow-ups.
Street Targets: Banks Still See XAU/USD Pushing Above 5,500–6,000
Despite the violence of the latest move, institutional forecasts for XAU/USD remain firmly skewed higher. Several major banks and houses have been lifting targets through January. One large global bank has a top-of-range forecast near $6,200 for 2026, with an end-year target around $5,900. Another flagship U.S. institution pegs $5,400 as its base case into late-2026, backed by private-sector diversification and continued emerging-market central-bank buying.
Other European and U.S. houses cluster in a $5,000–$6,000 corridor, often with base cases in the high $4,000s and bull scenarios above $5,700–$6,000. Even the more conservative shops talking about average prices around $4,400–$4,900 through 2026 are not calling for a collapse; they are simply assuming that gold consolidates at levels that, until a year ago, would have been considered extreme upside targets. Against that backdrop, a drop from $5,600 to $5,000 looks like the market catching its breath inside a still-bullish long-term range rather than the end of the story.
Risk Map: What Could Turn A Correction In XAU/USD Into A Deeper Slide
The bullish structural case does not remove downside risk. The first obvious risk is that the Warsh Fed translates into a genuinely tighter balance-sheet policy and higher real rates than the market currently discounts. A sustained, policy-driven dollar rally combined with positive real yields is the classic bearish mix for XAU/USD. If that materialises, the $4,550–$4,360 support band comes into play much sooner.
A second risk is regulatory and microstructure-related. The Shanghai Futures Exchange has already shown it is willing to crack down on speculative excess by suspending groups of trading accounts and warning participants to “invest rationally.” If more exchanges raise margins, cut leverage or cap position sizes in response to volatility, forced deleveraging can extend beyond one session and morph into a multi-week bleed.
Third, there is simple exhaustion risk. After an 80% twelve-month rally and the best month in 40 years, even true believers can decide to de-risk. If ETF inflows flatten or reverse while central-bank buying slows at the margin, the market will have to digest a significant overhang of speculative length. In that scenario, XAU/USD can easily trade through $5,000 toward the mid-$4,000s without breaking the secular bull but inflicting real damage on late longs.
Positioning Stance On XAU/USD: Buy, Sell Or Hold After The Crash
Putting the numbers together, XAU/USD is not trading like a safe, sleepy insurance policy any more; it is trading like a high-volatility macro asset that just had a classic blow-off and flush. Gold has dropped from about $5,595 to the $5,080–$5,200 zone, silver has crashed from roughly $120 to about $100, miners have taken a 5–7% daily hit, and yet the core drivers – central-bank accumulation, safe-haven demand, constrained mine supply and a still-fragile dollar regime – remain intact.
At these levels, the risk/reward skew is still tilted to the upside over a 12–24-month horizon, with obvious drawdown risk in the 10–15% range if $5,000 and $4,980 give way and the market tests $4,550–$4,360. That profile aligns more with a Buy/accumulate on weakness stance than with a Sell call. The price has finally corrected from an unsustainable vertical leg, but it has not broken the secular structure. In other words: XAU/USD is still in a bull market; it is just reminding everyone that even bull markets can take 8–10% out of you in a single day if you are late, leveraged or complacent.