Gold Price Forecast: XAU/USD Holds $4,509 Support but Stays Capped Under $4,576 as Fed Turns Hawkish
Gold (XAU/USD) sits 17% below its $5,477 peak as central bank buying and Iran risk support the bid while Fed Chair Warsh | That's TradingNEWS
Key Points
- Gold (XAU/USD) trades near $4,521, down 0.48%, locked in an $84 range between $4,509 support and $4,576 resistance.
- Central banks bought 244 tonnes in Q1 while ETF inflows fell 73% YoY, leaving the metal tied to physical demand.
- Hawkish Fed under Warsh, $99.30 Dollar Index, and 5.08% 30-year yield cap upside despite the active Iran war.
Spot gold is changing hands at $4,521.16 per troy ounce in mid-session U.S. trade on Friday, May 22, 2026, with the June COMEX contract (GC=F) marked at $4,520.70, down 0.48% on the session. The metal opened at $4,544.20 before the European bid faded, and intraday prints have walked through $4,520.30 at the early U.S. read and $4,505.60 in the WSJ snapshot taken later in the day. The decline from Thursday's reference of $4,544.36 works out to roughly $23.20 in absolute terms. That number undersells what is actually happening on the chart, because every opening tick this week has landed inside an $84 corridor, marking one of the tightest five-day consolidations the asset has produced since the rally accelerated through the second half of last year. The trailing performance picture has rotated against the bulls in the near term and in favor of them on every other horizon: down 2.73% week-on-week against $4,648.07, down 4.72% against the month-ago print of $4,745.16, and higher by 36.06% against May 2025's $3,322.99. The metal sits 17.46% below the 52-week high of $5,477.79 and 38.62% above the 52-week low of $3,261.49, having briefly cleared $5,300 earlier in 2026 on the way to that peak — a level that itself represents a 160% appreciation over the past five years. Worth noting alongside all of that: on January 29, the trailing 12-month gain was 95.6%, which gives a sense of how dramatically the rate-of-change has compressed even as the absolute price remains historically elevated. The deceleration is real. The structural thesis is not broken. The market is waiting, and the next $100 move in either direction will be told by which catalyst lands first.
The Daily Structure Reads as Genuine Indecision Rather Than Quiet Distribution
The 4-hour timeframe is producing the technical signature of a market that is balanced rather than one that is either accumulating into the next leg higher or quietly distributing into the next leg lower. A Doji candlestick has formed near $4,540.33, which is the textbook formation for equilibrium between bids and offers — the open and the close land within pennies of each other while the wicks extend on both sides. The MACD line is moving sideways in positive territory, which is among the least useful readings momentum traders can encounter because it confirms direction in neither camp. The RSI is parked at 46, fractionally below the 50 midline, in the part of the indicator's range where mean-reversion strategies and breakout strategies historically cancel each other out and where the predictive value of the indicator itself is at its weakest. The Money Flow Index is rising moderately, hinting that capital is gradually moving back into the metal beneath the surface even as price refuses to extend, and that divergence is one of the few constructive signals in the technical complex right now. The VWAP and the 20-period SMA are sitting almost directly on the spot price, which is the cleanest chart-language expression of balance you will find — the average market participant is right at break-even, and the next $50 in either direction will be confirmed by indicator turns rather than led by them. The right read on this structure is that gold has stopped trending and started waiting, and the resolution out of this base will be driven by macro flow rather than by chart followers.
The Lines That Decide the Next Move Are Drawn Tight and the Decision Tree Is Cleaner Than the Indicators Suggest
The support cascade beneath the price tells a coherent story. The first defensive line is $4,509.74, which has been tested multiple times this week and held on every probe. Below that, the next layer sits at $4,441.34, then $4,376.04, then $4,313.67, then $4,254.97, then $4,202.40, then $4,157.41, then $4,114.01, and ultimately $4,059.90 at the deepest reach if the structure flushes hard. A daily close beneath $4,509 would open the path mechanically to the $4,441–$4,376 band as the first measured target zone, and the volume profile suggests that any breakdown of that magnitude would likely run through to $4,313 before genuine bids reappear. The resistance lattice above the price is layered in similar fashion. The first ceiling sits at $4,576.74, with $4,645.91, $4,698.44, $4,760.74, $4,821.84, $4,881.57, $4,937.88, $4,996.26, $5,052.87, and $5,107.72 stacked above. The tactical decision tree is unusually clean inside this consolidation. A close above $4,576.74 on rising volume puts $4,645 to $4,698 in play immediately, with $4,881 as the medium-term reach. A close below $4,509.74 on rising volume opens $4,441 to $4,376 as the first stop. The operational pivot — the line that has to be respected on both sides of the trade — is $4,540.33, the center of the Doji, and the level at which the entire current positioning structure is parked.
Forward Projections Frame the Range the Macro Variables Are Negotiating Inside
The forward modeling around this consolidation tightens the picture meaningfully and provides useful boundary conditions for the next thirty days. The trading range projected for the abbreviated May 25–31 window carries a low of $4,254.97, a midpoint of $4,568.27, and a high of $4,881.57, with May 23 and 24 dark for the metal ahead of the U.S. Memorial Day holiday. The monthly band for May spans $4,380 to $5,100 with an average near $4,740. The longer-horizon framework continues to carry $5,400 to $6,000 as the modal year-end objective, anchored explicitly by central bank reserve accumulation and the embedded geopolitical risk premium that the Iran conflict has injected into the entire commodity complex. Those numbers should not be read as price targets in the technical sense — they are statistical ranges built from realized volatility regimes and macro factor weights — but the cumulative implication is that the consolidation is occurring inside an uptrend rather than at the top of one, and the path of least resistance over the medium term remains higher.
The Iran Conflict Is the Single Largest Variable on the Page and It Is Not Resolving
The geopolitical premium baked into the gold price right now is non-trivial, and the diplomatic track is not breaking in the direction that would deflate it. Iranian state sources continue to insist that the country's enriched uranium stockpile must remain inside Iran, while President Trump's framing has been categorical and inflexible: "We don't need it, we don't want it, we'll probably destroy it after we get it, but we're not going to let them have it." That is not a negotiating position with a meet-in-the-middle outcome. The U.S. naval blockade continues until a deal is reached, the Strait of Hormuz remains effectively closed, and U.S. military officials are reportedly preparing to brief the White House on potential additional operational actions. Crude markets are pricing the standoff directly. Brent crude trades at $104.12, WTI at $97.72, and the U.S. national gasoline average sits at $4.55 per gallon — the highest Memorial Day weekend price since the post-Ukraine spike in 2022. GasBuddy has modeled a path above $5.03 at the pump if the Strait does not reopen by midsummer, and that scenario is the inflation pass-through that has forced the Fed's pivot. The gold price is being defended on every probe of $4,509 in part because large allocators cannot underweight the metal while the global oil supply chain is being held hostage by a regional power. A clean Hormuz reopening would be the single most plausible event that pulls $200 to $300 out of the spot price in a hurry. The probability of that outcome inside the next sixty days is materially lower than the price action implies, and that asymmetry is exactly why the bid keeps reappearing on every test of the lower edge of the range.
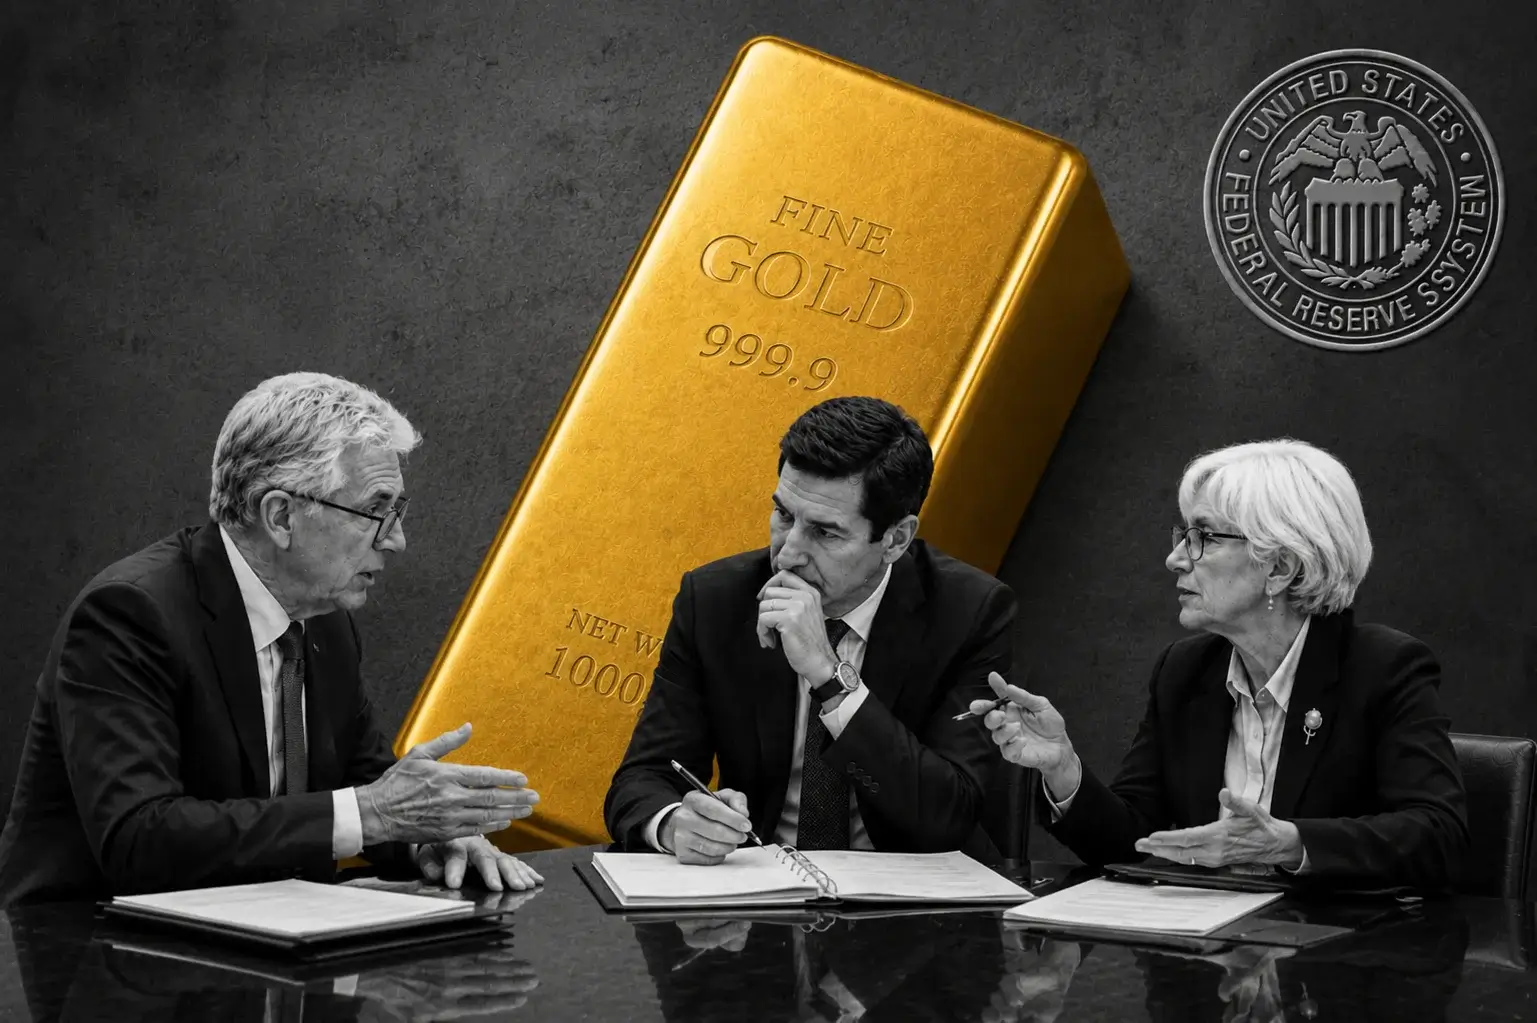
The Fed Has Stopped Talking About Cuts and Is Now Openly Pricing the Possibility of Hikes
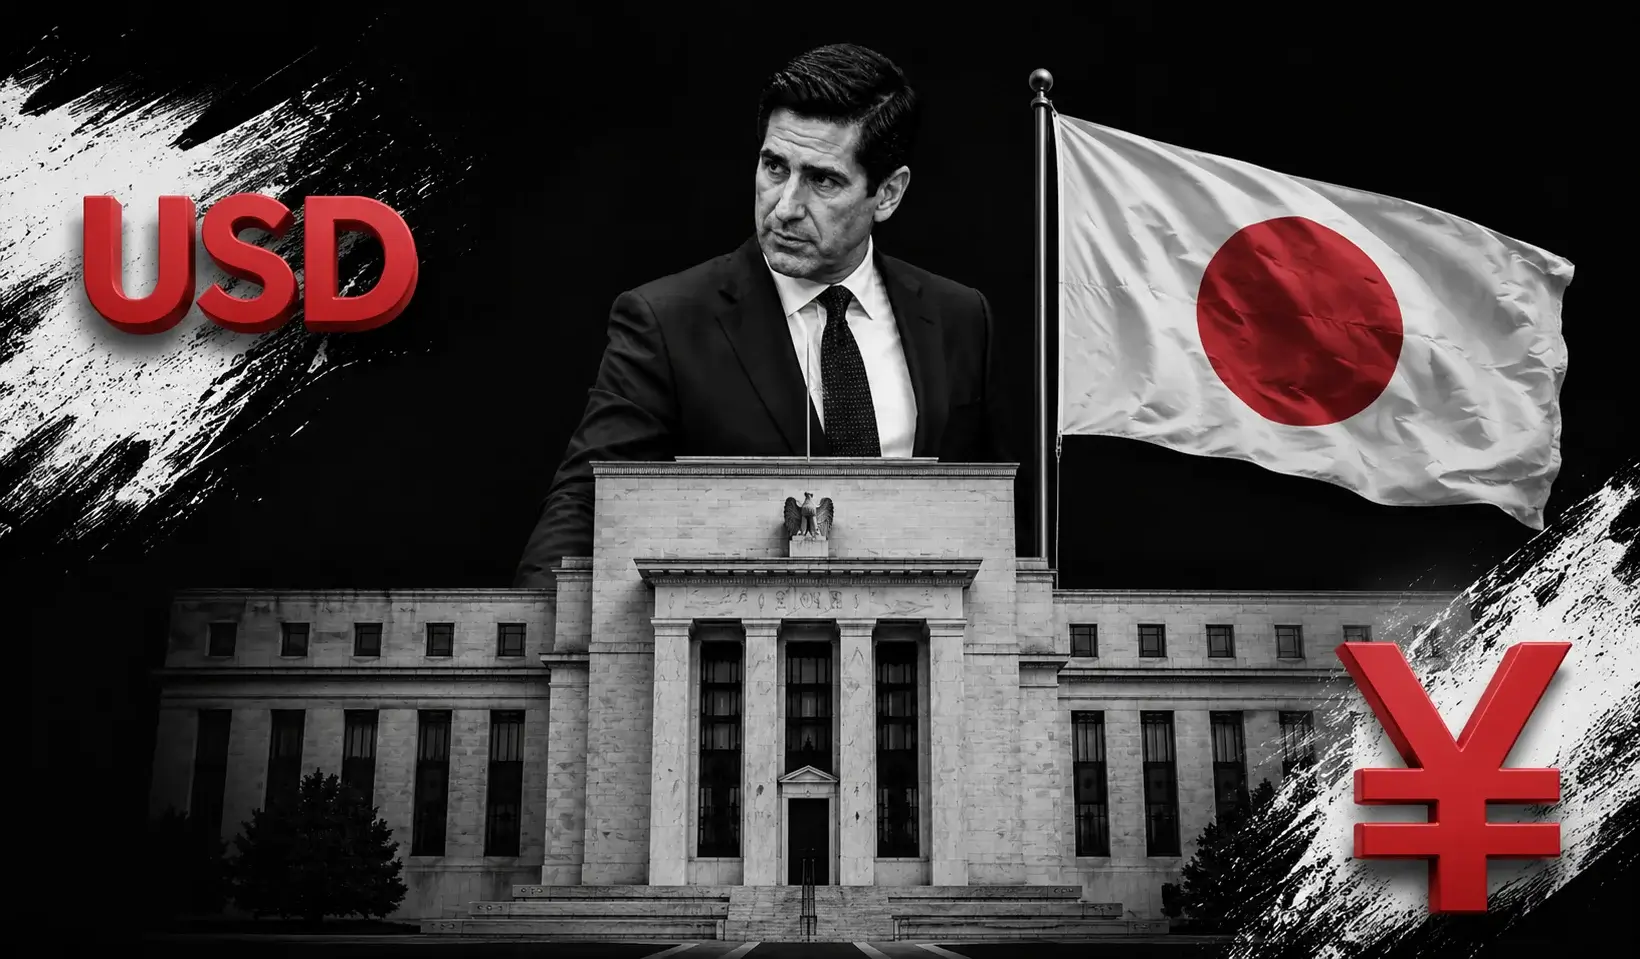
The monetary policy channel has rotated against the historical gold playbook in a way that needs to be addressed without flinching. The Federal Reserve held rates unchanged at 3.50% to 3.75% at its most recent meeting, but the decision was not unanimous — four policymakers dissented, and the public commentary since has hardened materially. Governor Christopher Waller, speaking from Germany this morning roughly an hour before Kevin Warsh's swearing-in ceremony at the White House, said the central bank should "hold rates steady for the near term" and warned that the next move could be a hike rather than a cut if inflation continues to surprise to the upside. Warsh becomes the first Fed Chair to take the oath at the White House since Greenspan in 1987, and any expectation of a dovish pivot under his early tenure has now been priced out. The CME Group rates curve prices the probability of a June cut to the 3.25–3.50% band at 2.6%, with 97.4% of participants expecting the current corridor to hold. The forward strip has moved to incorporate the possibility of rate hikes as early as 2027, which is a regime change in the rates-versus-gold relationship that has historically capped the metal rather than fueled it. The textbook read is that gold should be losing the rate-cut tailwind that powered the move into the high-$5,000s late last year, and on the margin it has. The fact that XAU/USD is still trading at $4,521 rather than sitting hundreds of dollars lower with the curve sounding this hawkish is the structural tell. Something else is doing the heavy lifting under the price, and identifying what that is matters more than reading any single indicator on the chart.
The Dollar Is Firm, Real Yields Are Elevated, and the Metal Should Be Down More Than It Is
The cross-asset hostility from the dollar and the rates complex is real and demands honest accounting. The Dollar Index sits at 99.30, up 0.09% on the day, with most of the firmness coming directly from Waller's hawkish framing. The 10-year Treasury yield is at 4.584%, off Tuesday's intraday peak of 4.69% but still elevated. The 30-year yield is at 5.088%, just below a level earlier this week that marked the highest reading since before the 2008 financial crisis. The 2-year yield sits at 4.14%, off a one-year high of 4.122% that printed on the front end. A non-yielding store-of-value asset is expected to lose ground when the real-yield curve is parked at this elevation, particularly when the dollar is firm against the rest of the G10 basket. The fact that gold has only given back 17.46% from the $5,477 peak in the face of that backdrop — and that the pullback has come gradually rather than in the cascading liquidation pattern that has historically followed parabolic moves — is the strongest piece of evidence that the structural bid is being driven by something other than rate expectations. The two candidates for that "something else" are central bank reserve accumulation and Asian physical demand, and both are doing measurable work in the price.
Central Banks Bought 244 Tonnes in Q1 and That Is the Real Floor Underneath the Range
The World Gold Council's first-quarter 2026 demand report delivers the data that explains the floor under the price. Total demand including OTC investment hit 1,230.9 tonnes, up 2% year-on-year and the highest first-quarter print on record. The composition tells the story more clearly than the headline. Bar and coin demand reached 474 tonnes, up 42% year-on-year, marking the second-highest quarterly print ever recorded — Asian household buyers carried the bulk of that growth, actively rotating savings into physical gold investment products as a hedge against currency debasement and the Middle East risk-off. Central banks made net purchases of 244 tonnes, up 3% year-on-year, even as the quarter also saw a notable uptick in offsetting reserve sales by smaller managers. That is the structural bid that has prevented the breakdown the dollar and yield environment would normally produce. Public-sector reserve managers are not trading the daily Fed commentary or the weekly ETF flow report. They are reweighting against a multi-decade shift in which the dollar's share of global reserves has been declining and gold's share has been rising, and they are buying through both rallies and consolidations. The price action this week is being arbitrated between speculative paper positioning that has been reducing exposure on the rate-hike repricing, and structural physical demand that has been adding. The Doji at $4,540 is the visible expression of that standoff.
ETF Flows Are the Soft Spot in the Bull Thesis Right Now and the Western Bid Has Thinned
The exchange-traded fund channel is where the bull case is most visibly cracking, and this needs to be flagged because it is the demand source most likely to drive price-elastic upside moves. Global gold ETFs delivered net inflows of 62 tonnes in Q1 2026, which reads constructively in isolation but turns ugly when set against the 230 tonnes that flowed in during the comparable Q1 2025 window. The deceleration works out to roughly 73%, and the entire negative variance was generated by substantial March outflows from U.S.-listed funds — the same vehicles that powered the move toward the $5,477 high. The implication is direct and unambiguous: the Western paper bid that drove the parabolic leg has thinned out meaningfully as the rate environment turned hawkish, and the price is now leaning more heavily on Asian physical buyers and central bank reserve flows to hold the line. That is a more durable but materially less price-elastic source of demand. Reserve managers and Asian household savers will defend $4,400 and $4,300 with steady accumulation. They will not reflexively chase price higher into thin air the way Western ETF flows do during euphoric phases of the cycle. Until U.S. fund flows turn positive again — which probably requires either a clean Hormuz escalation, a confirmed Fed pivot back toward cuts, or a sharp equity correction that revives the safe-haven trade — the upside resolution out of this range will be slower and more grinding than the rally that preceded it. That is not a bearish read, but it is a structural caveat that needs to be honored.
Read More
-
CVX Climbs to $177 as Oil Shock and the Microsoft Data-Center Deal Fire Both Engines — Chevron Eyes a Q2 Windfall and Guyana Cash Inflection
08.07.2026 · TradingNEWS ArchiveStocks
-
XRP-USD Bleeds to $1.07 as Catalyst Exhaustion Grips the Token — ETF Inflows and Whale Buying Diverge From a 19-Month-Low Price
08.07.2026 · TradingNEWS ArchiveCrypto
-
Henry Hub Gas Holds $3.28 as It Ignores the Iran Oil Spike — Heatwave and LNG Battle a 6%-Above-Average Storage Glut
08.07.2026 · TradingNEWS ArchiveCommodities
-
Dow Drops 764 Points and Oil Blows Through $75 After Trump Kills Iran Ceasefire — Valero (VLO) Rips 4.1% to a Record
08.07.2026 · TradingNEWS ArchiveMarkets
-
Dollar-Yen Climbs Toward ¥162.50 as the Yen Loses Its Safe-Haven Crown — USD/JPY Trapped Between the Carry Trade and Intervention
08.07.2026 · TradingNEWS ArchiveForex
Physical Demand Is Diverging in Important Ways and the Jewelry Channel Tells a Useful Story
The divergence inside the physical market is one of the most underappreciated currents in the current setup, and it cuts in two directions simultaneously. The record-high price points at the start of the quarter drove a 23% year-on-year decline in global jewelry demand to 335 tonnes, with consumers in price-sensitive Asian markets pulling back hard on adornment purchases as the per-gram cost reached levels that no longer fit cultural buying patterns at the household level. That is a real demand drag and a textbook example of how high prices destroy demand at the margin. The flip side of that decline has been visible at the U.S. retail recycling level, where dealers are reporting some of the highest sell-through volumes in years. The price briefly cleared $5,300 per ounce earlier in 2026 — a 160% appreciation over five years — and that level flushed out enormous quantities of dormant household jewelry into the refining pipeline. A jeweler in Scottsdale captured the dynamic precisely: most U.S. households sold their meaningful gold positions when the price first crossed $2,000 roughly eighteen months ago, and what is coming out of the woodwork now is the residual tier of broken chains, mismatched earrings, and inherited pieces that were not worth the friction to liquidate at lower price points. That recycled supply is being melted, refined, and reintroduced into the wholesale chain, which is a meaningful structural variable on the supply side. When physical scrap supply is rising into a price that is no longer being chased aggressively by Western paper flows, the natural consequence is consolidation rather than breakout. The fact that the metal is holding $4,520 against all of that supply-side pressure — and against a hawkish Fed, a firm dollar, and elevated real yields — is itself the strongest read of the structural bull thesis, expressed in price.
The Cross-Asset Tape Is Not Uniformly Risk-On and That Layered Picture Supports the Gold Bid
The macro tape today is not delivering a uniform risk-on or risk-off signal, and the gold price has to be read inside that complexity rather than against a clean directional read. U.S. equities are pushing toward record highs, with the Dow Jones Industrial Average at 50,605, up 0.64% and having printed an intraday all-time high of 50,686. The S&P 500 is on track for its eighth consecutive weekly gain at 7,486.32, the longest weekly streak since late 2023. The Nasdaq Composite is at 26,456, up 0.62%, and the Russell 2000 is leading the field with a 0.74% advance. That kind of equity strength would normally pull capital out of gold by reducing the perceived need for portfolio insurance, and on the margin it has — gold-equity correlations have flipped to mildly negative through May. But the VIX at 16.59, down 1.01%, is compressed in a way that suggests volatility hedging is being done elsewhere. Sector leadership on the week is sitting in Health Care (+3.4%) and Real Estate (+3%), which is a defensive-cyclical composition rather than a clean risk-on profile. Oil is sticky above $100. That combination produces the kind of allocation regime where large macro books can hold both positions simultaneously — equity exposure for the AI capex and earnings cycle, gold exposure for the Iran and Fed tail — and that dual-positioning structure is precisely what produces tight consolidations in gold rather than violent rotations. The metal is not being abandoned. It is being held alongside.
Consumer Sentiment at a Record Low Adds a Quieter Layer of Support Underneath the Price
The University of Michigan's final May consumer sentiment print landed at 44.8, the lowest reading on record and below the previous trough seen during the June 2022 inflation crisis. The composition of the print matters far more than the headline. The Surveys of Consumers flagged that long-run inflation expectations are now spreading beyond fuel prices for the first time in this cycle, which is the kind of signal that historically supports gold as a real-value hedge regardless of what nominal interest rates do. The U.S. national gasoline average at $4.55 per gallon is the highest Memorial Day weekend price since 2022 following the Ukraine war's onset, and households experiencing that cost shock are not the marginal buyer of gold ETFs, but they shape political pressure on the Fed and feed back into the inflation expectations that drive sovereign reserve managers and Asian household buyers further into the metal. The recursive loop here is important. Hawkish Fed → firm dollar → ordinary gold headwind. But hawkish Fed under sticky oil → persistent inflation expectations → sovereign hedging demand → structural gold tailwind. The two channels do not cancel out cleanly, and the second one is operating with multi-year persistence while the first one resets meeting by meeting.
The Equity-Bond Correlation Is Doing Something Unusual and Gold Is Quietly Benefiting
A subtler reason the gold bid has held this week is that the traditional 60/40 portfolio diversification mechanism is misfiring. Treasury yields have been moving in the same direction as equity prices through much of May, with bonds selling off into rising equity multiples as the rate-cut bid evaporates. That positive stock-bond correlation has not been the norm for most of the past two decades, and it has been pushing allocators back into gold as the marginal diversifier — the asset that delivers genuine portfolio insurance when the cross-asset volatility-of-volatility rises. That is not a story that fits into a single chart, but it shows up in the quiet persistence of the bid at $4,509 and the unwillingness of the price to break lower despite a hostile rate-and-dollar backdrop. The structural diversification demand is real, and it is part of why the consolidation is happening in such a tight band rather than widening into a deeper retracement.
What Invalidates the Bullish Case and What Invalidates the Bearish Case
The risk parameters need to be drawn with precision because the consolidation will eventually resolve and the catalyst stack is visible on the calendar. The bullish thesis breaks on a daily close beneath $4,509.74 with confirming volume, which would open the path mechanically to $4,441 to $4,376 as the first measured target zone and $4,254 as the broader reach. The thesis also breaks if the Strait of Hormuz reopens cleanly under a U.S.-Iran framework that addresses the uranium question to Washington's satisfaction, which would pull the geopolitical premium out of the price in a single session. It breaks if the Fed under Warsh's tenure delivers an actual rate hike at the June meeting — currently a tail risk in the curve but no longer a zero-probability outcome. It breaks if Western ETF outflows accelerate from the soft Q1 print into something that looks like a structural unwind of the parabolic-leg buying. And it breaks if a sudden risk-off equity event triggers margin-call selling that hits the gold complex via forced liquidation rather than via the usual safe-haven channel. The bearish thesis breaks on a daily close above $4,576.74 with confirming volume, which would put $4,645 and then $4,698 into immediate play. The thesis also breaks if Brent crude pushes through $115 on a Hormuz escalation rather than a reopening, if U.S. ETF flows turn meaningfully positive for two consecutive weeks, if central bank purchases in Q2 print materially above the 244-tonne Q1 base, or if the Fed surprises dovish at the June meeting with a Warsh framing that emphasizes growth risk over inflation risk. The position to express the view is binary at the boundaries and patient inside the range.
The Decision: Hold the Position, Lean Bullish on a 30-to-90-Day Horizon, Wait for the Range to Break
The honest read on the XAU/USD setup is that gold is a hold with a constructive medium-term bias, not a chase inside the consolidation and not an exit on the rate-hike repricing. The $4,509.74 to $4,576.74 band is the operational pivot, and the trade structure is binary in a way that makes the decision tree unusually clean. The market is being held up by central bank purchases at a 244-tonne quarterly rate, by Asian bar and coin demand running at the second-highest quarterly print ever recorded, by a deepening dollar-de-globalization trend that is unlikely to reverse over any meaningful horizon, by a still-elevated geopolitical risk premium tied to a hot war whose resolution is not visible inside the next sixty days, by record-low U.S. consumer sentiment that signals embedded inflation expectations, and by a structural shift in the equity-bond correlation that has elevated gold's diversification utility for large allocators. It is being capped by a hawkish Fed leaning explicitly toward holding or hiking rather than cutting, a firm Dollar Index above 99, elevated real yields with the 30-year near 5.09%, a 73% deceleration in ETF inflows year-on-year, a 23% drop in jewelry demand, substantial scrap supply re-entering the refining chain at prices above $4,500, and a stock market that is delivering record highs and absorbing risk appetite that might otherwise flow into safe-haven plays. Those two force vectors are roughly balanced inside the current range, and that balance is why the metal has produced a Doji at $4,540 with an RSI of 46 and a flat MACD in positive territory — the textbook chart signature of a market that has stopped trending and started waiting. The asymmetric outcome over the next sixty to ninety days still favors the upside, because the catalyst stack on the bull side — a Hormuz escalation, a Fed pivot back toward neutrality or actual cuts, sustained central bank accumulation at the Q1 244-tonne pace, a structural revival of Western ETF demand, and the year-end push toward the projected $5,400 to $6,000 range — is more probable in aggregate than the catalyst stack on the bear side, which essentially requires both a Hormuz reopening and a confirmed Fed hike to materialize in the same window. The right operational posture is to hold core spot exposure, refrain from adding aggressively until $4,576.74 is reclaimed on a daily close with volume confirmation, and step size up meaningfully only on a confirmed break above the upper boundary accompanied by either positive ETF flows or a fresh geopolitical leg from the Iran theater. The structural call on gold is bullish through year-end. The tactical call inside the current range is patient. That is the trade as the calendar walks into the long weekend with XAU/USD pinned at $4,521, the Doji holding the center of the range, and every macro variable still holding its cards.