Gold Reclaims $4,100 and Runs Toward $4,200 as the Hike Bet Unwinds — Silver $62 Leads, $4,340 Is the Line to Break
Bullion rebounded off an eight-month low near $4,090 after June payrolls printed just 57,000 versus 115,000 expected | That's TradingNEWS
Key Points
- XAU/USD trades near $4,190, up 1.5%, rebounding from an eight-month low as September hike odds fall to 50% from 67%.
- Gold shed roughly 15% in Q2 2026, its worst quarter since 2013, from a January record near $5,593 to a $4,090 low.
- Reclaiming the $4,340 200-day average targets bank forecasts of $4,900–$6,000; a close below $4,090 exposes $4,000.
Gold is pressing toward $4,200 an ounce into the July 4 weekend, trading near $4,190 after climbing roughly 1.5% on Friday and extending a multi-session reversal that began mid-week. The metal broke back above $4,100 on Thursday, rebounding hard from an eight-month low, and it did it on one catalyst: a soft June jobs report that gutted the case for a Federal Reserve rate hike. For a market that just closed its worst quarter since 2013, this is the first serious sign the selling has burned itself out.
The thesis is clean. Gold spent Q2 2026 getting smoked — down roughly 15% from a January record near $5,593 — because the entire macro regime flipped hawkish. Kevin Warsh's arrival as Fed Chair eased the market's Fed-independence worries and reinforced a higher-for-longer rate outlook, the Iran war lifted inflation expectations and sovereign yields, and desks began pricing rate hikes rather than cuts. Every one of those forces is a headwind for a non-yielding asset, and gold rolled over from $5,593 into the $4,090-$4,170 zone. Then the labor data cracked the narrative. June payrolls printed just 57,000 against a 115,000 consensus, ADP had already missed at 98,000, and Fed funds futures repriced the odds of a September hike down toward 50% from 67%.
That repricing is the whole trade. Gold and silver respond to one thing above all others — the cost of holding cash versus the cost of holding a non-yielding metal. When the market prices hikes, cash gets more attractive and gold bleeds. When a jobs miss unwinds those hike bets, the real-yield pressure reverses and gold catches a bid on the spot. The 2-year Treasury yield dropping to 4.13% and the September hike odds collapsing are why gold ripped from the low-$4,100s back toward $4,200 in three sessions.
Gold at $4,190 sits below its 200-day moving average near $4,340, so the medium-term structure is still repairing rather than repaired. The eight-month low near $4,090 is the floor the bulls defended, and the $4,340 line is the level that turns this bounce into a trend. The structural bull case — central bank diversification, de-dollarization, debasement worries — never left, and banks still cluster year-end targets from $4,900 to $6,000. What changed this week is the rate-hike scare that broke gold in Q2 started to unwind. Everything below builds that out.
The 57,000 Jobs Print That Cracked the Hawkish Narrative
The data did the work. June nonfarm payrolls rose just 57,000, less than half the 115,000 the desks were positioned for and the weakest gain in four months. Leisure and hospitality shed 61,000 jobs despite a World Cup tourism boost, April and May were revised down by a combined 74,000, and the unemployment rate fell to 4.2% only because the labor force participation rate dropped to 61.5%, a five-year low — a soft report reading soft in every internal. Wage growth edged up to 3.5% year-over-year, the one firm line, but not enough to reignite the hike case on its own.
The rate-market response was immediate and it is the entire story for gold. Fed funds futures cut the probability of a September rate hike to roughly 50% from 67% before the report. On the nearer horizon, the odds of a hike at the July 29 meeting fell below 30%. That is a wholesale repricing of the tightening path, and it lands directly on the metal that suffers most when cash yields climb. Gold broke above $4,100 within hours of the release and pushed toward $4,190 as the hike premium bled out of the front end.
The setup had been building for two days. The ADP private payrolls report on July 1 showed just 98,000 jobs added, below the roughly 118,000 expected, cracking a hawkish narrative that Cleveland Fed President Beth Hammack had reinforced on June 30 when she flagged the job market as consistent with full employment. Two consecutive labor-market misses, capped by the 57,000 headline, dismantled the case that the Fed needed to hike into the summer, and the metals complex read it in real time.
The context sharpens why the reaction was so violent. Coming into the week, CME futures had the market pricing meaningful odds of a hike rather than a cut, with year-end rate forecasts drifting toward 3.87% — the highest since a mid-March spike toward 4.00% that had sent gold sliding fastest since its 2013 crash. When positioning is that lopsided toward tightening, an unwind produces an outsized move in the opposite direction, and gold's three-session rip off the low is that unwind expressing itself. The jobs print did not just support gold — it reversed the exact force that had been crushing it.
Warsh's Sintra Pivot Set the Table
The jobs data lit the fuse, but Fed Chair Kevin Warsh had already set the table. Speaking at the European Central Bank's Sintra forum on July 1, Warsh noted that inflation expectations and risks have come down in recent weeks while reaffirming the central bank's commitment to its 2% target. For a market conditioned to view Warsh as the hawkish appointee who would push higher-for-longer, that acknowledgment of moderating inflation was a genuine softening, and gold noticed — the metal gained over 2% across July 1 and July 2 as desks began unwinding hawkish positioning before the jobs report even landed.
The significance runs deeper than a single speech. Warsh's nomination earlier in 2026 was itself the catalyst that broke gold's January melt-up to $5,593, because it eased concerns over Fed independence and reinforced expectations of a more hawkish rate path. The metal that had soared nearly 30% to start the year on debasement and independence worries corrected hard once the market decided the new chair would defend price stability aggressively. So when the same chair signals that inflation risks are fading, it partially reverses the exact narrative that triggered the Q2 selloff — the hawkish premium that Warsh's arrival built into the rate curve starts to come out.
The framing shift matters for how gold trades from here. Under Warsh, the Fed is reportedly moving to end formal forward guidance and scrap the dot-plot projections that policymakers had issued since 2012. That removes a source of hawkish anchoring — without a dot plot signaling a hiking bias, the market takes its cues from the data, and the data just turned soft. A data-dependent Fed reacting to a 57,000 payrolls print is a more dovish setup for gold than a Fed committed to a pre-announced tightening path.
The read into the July 8 FOMC minutes is the near-term swing factor. Warsh's Sintra comments and the jobs miss have the market leaning dovish, but the minutes cover the June meeting, before the labor data softened. If they reveal a committee that ran closer to a tightening bias than Warsh's recent tone implies, the hawkish premium reloads and gold's bounce gets tested. If they read consistent with the moderating-inflation message, the repricing holds and the metal has room to press the $4,340 resistance.
The Real-Yield Mechanism That Owns This Tape
Every move in gold this week runs through one mechanism: real yields. Gold pays no coupon, so its appeal is measured against what an allocator gives up by holding it instead of interest-bearing cash or Treasuries. When the market prices rate hikes, real yields rise, the opportunity cost of holding gold climbs, and the metal sells off — which is precisely what crushed gold through Q2 as hike bets built. When a jobs miss unwinds those hike bets, real yields fall, the opportunity cost drops, and gold rallies. That is the entire transmission, and it explains why a labor-market number moved bullion more than any gold-specific catalyst could.
The bearish version of this mechanism dominated the second quarter. As the Iran war lifted inflation expectations and sovereign yields, and as the market priced a Fed that might hike into that inflation, real yields pushed higher and gold got repriced lower. UBS captured it when it cut its year-end target and cited markets rediscovering the concept of opportunity cost — elevated real yields making gold's non-yielding status more costly. The 10-year Treasury yield holding near 4.48%, rebounding off a seven-week low of 4.36%, was the barometer of that pressure, and gold fell as it climbed.
This week the mechanism ran in reverse. The 2-year yield's drop to 4.13% and the collapse in September hike odds pulled real-yield expectations lower, and gold caught the bid mechanically. This is why the metal is so sensitive to the Fed path and so relatively indifferent to the day's equity moves — the S&P 500 finishing flat and the Dow hitting a record barely register for gold next to a 17-percentage-point swing in September hike probability. The rate curve is the gold chart's shadow.
For the forecast, the real-yield read is the master variable. As long as the labor market keeps softening and the Fed stays on hold, real yields drift lower and gold's structural bull case gets room to reassert. The risk that breaks it is the one J.P. Morgan's Greg Shearer flagged as the most significant bearish scenario: US growth and employment staying firm while inflation accelerates, forcing the Fed to hike and crystallizing a higher-for-longer real-yield regime. That combination would flip Western demand back to outflows. This week's data pushed the odds toward the bullish side of that fork, but the July 8 minutes and the next inflation print decide whether it holds.
The Worst Quarter Since 2013 in Full Context
To size the bounce, the drawdown behind it needs accounting. Gold soared almost 30% in January 2026 to an all-time record near $5,593, driven by geopolitical tension, debasement worries, and expectations of monetary easing. Then the regime flipped. Warsh's hawkish appointment, the Iran war's inflation-and-yield shock, and a market repricing toward hikes rather than cuts sent the metal into a punishing correction that ran roughly 15% lower across Q2 — gold's worst quarter since the 2013 crash. Price drifted from the January peak down into a $4,090-$4,170 zone, tagging an eight-month low before this week's reversal.
The path down was a series of lower highs. Gold hit the $5,593 record early in the year, retreated to around $4,098 in early February on the Middle East conflict, recovered to $4,792 by mid-April on strong investment demand, then rolled over again through late June to near $4,090 on a stronger dollar and tightening Fed expectations. Each rally attracted sellers at a lower level as the hawkish narrative hardened, and the metal spent the quarter grinding through support until sentiment reached the kind of washout that precedes a turn.
The sentiment extreme is the tell. One widely-watched gold-miner sentiment gauge, the BPGDM, hit zero as gold drifted into what some desks called a massive buy zone at $4,100-$4,000 — a reading that reflects total capitulation in the mining complex and historically clusters near lows rather than tops. When a sector sentiment index prints zero and price sits at an eight-month low, the marginal seller has largely finished, and even a modest catalyst can produce a sharp reversal. The 57,000 jobs print was that catalyst.
The context reframes the bounce from a dead-cat rally into a potential base. A market that fell 15% in a quarter, tagged an eight-month low, and washed sentiment to an extreme is a market that has done the structural work a durable low requires. Gold up more than 25% since early 2025 despite the Q2 carnage shows the longer trend never broke — the correction unwound the January excess without violating the multi-year uptrend. The metal reversing off $4,090 on a dovish data turn is exactly how these corrections tend to end, though confirmation requires reclaiming the levels the selloff took out.
Silver Is Outrunning Gold Better Than 1.5-to-1
Silver is the higher-beta expression of the same trade, and it is moving harder. The metal rose 3.85% to $61.45 on July 2 while gold gained 2.49%, and it has pushed toward $62-63 into the weekend — outrunning gold's percentage gain by better than 1.5-to-1. That leverage is structural: silver carries both the monetary demand that drives gold and an industrial-demand component, so when the rate-hike unwind lifts the precious complex, silver amplifies the move in both directions.
The amplification cut the other way through Q2. As the hawkish repricing crushed gold, silver sank harder, dropping to its lowest since late March beneath $69.50 during the worst of the selloff and banking a 4.0% weekly loss at one point as rate-hike bets soared. The metal that leads on the way up leads on the way down, and silver's Q2 drawdown was steeper than gold's on the same real-yield mechanism. Its recovery now is proportionally sharper for the same reason.
The gold-silver ratio is the lens allocators use to read the complex. When silver outperforms gold, as it is now, the ratio compresses and the move is read as risk-appetite returning to the metals — a more speculative, higher-conviction phase than a defensive gold-only bid. Silver leading by 1.5-to-1 off the low signals that the bounce is not merely safe-haven positioning but a genuine re-rating of the precious complex as the hike scare unwinds. That is a more constructive tape than gold rallying alone.
For the forecast, silver's leadership is a confirming signal rather than a standalone call. If the precious rally has legs, silver should keep outpacing gold and the ratio should keep compressing; if the bounce fades on a hawkish July 8 minutes read, silver will give back more than gold on the same logic. The metal's 3.85% single-session gain against gold's 2.49% is the market voting that this is a real turn in the complex, and it raises the stakes on whether gold can clear $4,340 to validate it.
Read More
-
Amazon Holds $244 Into the July 30 Print as AWS Runs at a $150B Rate and the $364B Backlog Justifies the AI Spend
03.07.2026 · TradingNEWS ArchiveStocks
-
XRP Snaps Back to $1.12 off the $1.007 Floor — but Ripple's Winning Year Still Isn't Lifting the Token
03.07.2026 · TradingNEWS ArchiveCrypto
-
Crude Snaps Back to $68.50 WTI as Hormuz Reopens and the Surplus Returns — the $60s Beckon Unless the Peace Breaks
03.07.2026 · TradingNEWS ArchiveCommodities
-
Stock Market Today: S&P 500 SPX Holds 7,483 and Dow DJI Sets 52,900 High While Nasdaq IXIC Slides 0.8% on Apple AAPL, Chip Split
03.07.2026 · TradingNEWS ArchiveMarkets
-
Pound Jumps to $1.3377 as the Dollar Tumbles on the Jobs Miss — but the $1.32 Political Low and $1.35 Cap Box Cable In
03.07.2026 · TradingNEWS ArchiveForex
The Technical Map: $4,090 Is the Floor, $4,340 Is the Wall
The chart frames the trade with two levels that matter above all others. The floor is the eight-month low near $4,090, backed by the $4,100-$4,000 zone that drew buyers as sentiment washed to an extreme — the shelf that separates this correction from a deeper leg lower. The ceiling is the 200-day moving average around $4,340, the single most important resistance on the board. Gold at $4,190 sits between them, and the forecast hinges on which breaks first. Reclaim $4,340 on a closing basis and the medium-term structure repairs; fail it and the metal stays trapped in the $4,090-$4,340 range that Q2 carved out.
The near-term pivots sit inside that range. Analytical pivot points cluster around $4,161 and $4,260, the levels desks are watching for the next directional read. A hold above $4,161 keeps the bounce intact and points toward $4,236-$4,260, the top of the projected July range; clearing $4,260 opens a run at the $4,340 200-DMA. On the downside, losing $4,161 puts the $4,090 low back in play, and a close beneath $4,090 would negate the bounce and expose the psychologically heavy $4,000 mark.
The moving-average structure defines the regime as repairing, not repaired. Gold trades below its 200-day moving average near $4,340, which is why the medium-term read stays cautious even after a 2.49% up day. The metal needs to reclaim that line to flip the trend signal constructive. Until it does, this is a countertrend bounce inside a broken structure — powerful, driven by a real macro catalyst, but not yet confirmed as a new uptrend. The distinction is what separates a tradable bounce from a durable turn.
Momentum is turning but has not confirmed. The reversal off $4,090 on the jobs data has the daily signals improving, but the weekly and monthly technicals still carry the scars of the Q2 selloff, with some gauges reading sell after the 15% quarterly drop. That is the correct signature for a first bounce off a washout — enough strength to reclaim $4,190, not yet enough to break $4,340. The forecast follows the levels: hold $4,090, clear $4,260, and press $4,340 to confirm the turn; lose $4,090 and the $4,000 test the bears want comes into range.
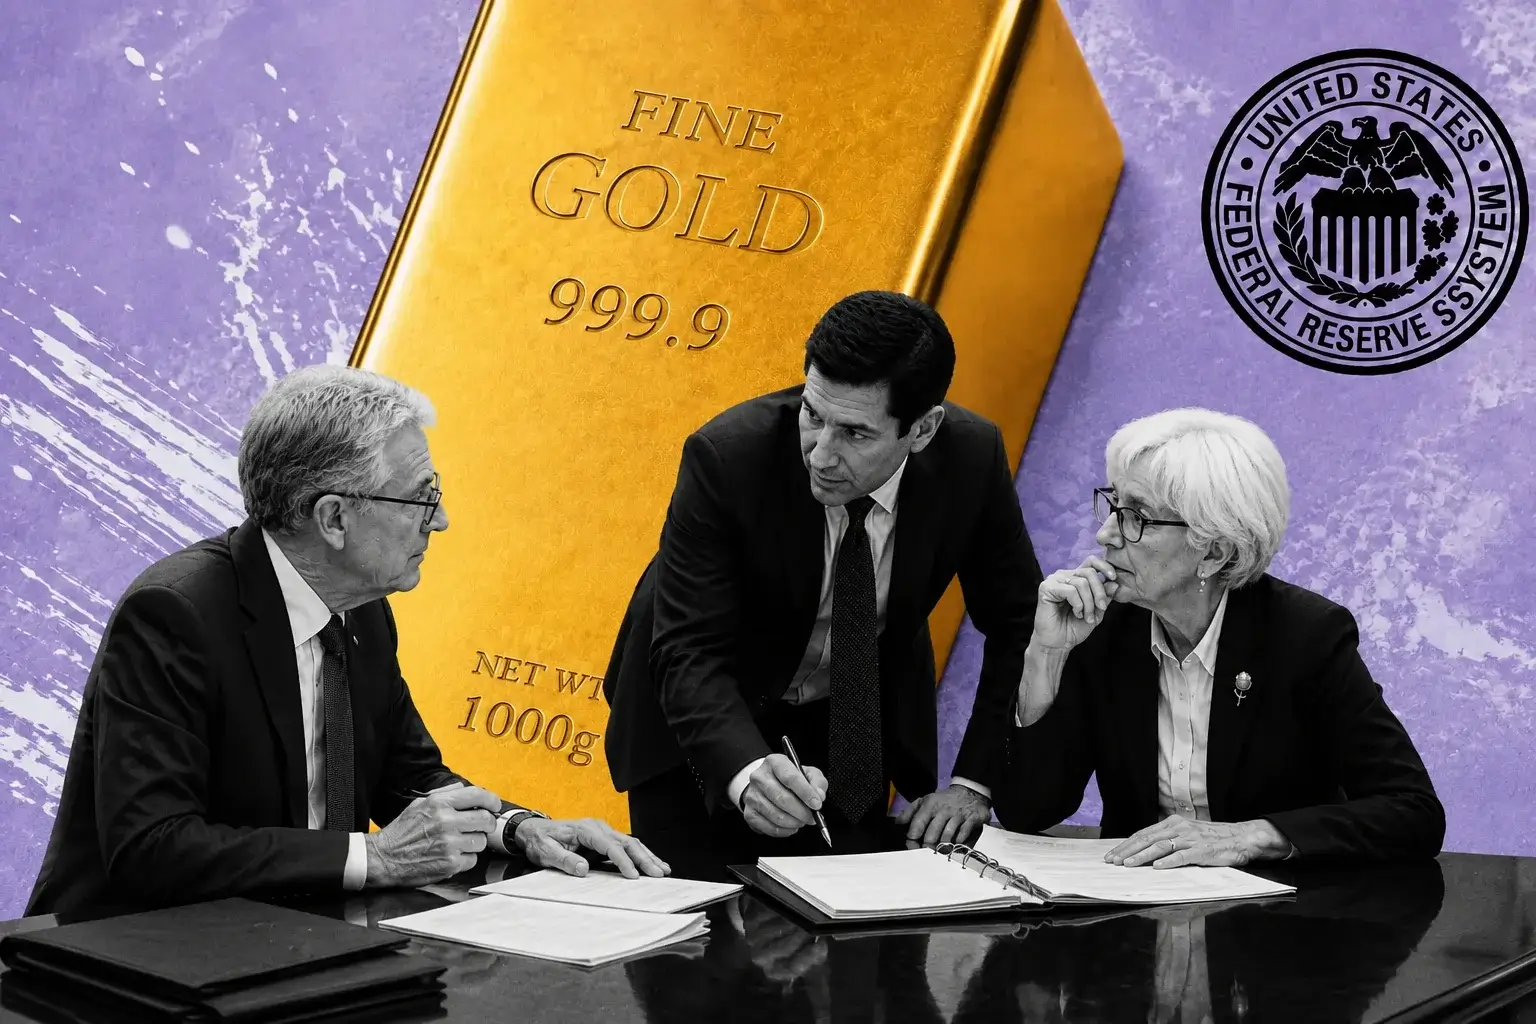
Central Bank Demand: The Real Story Under the Surface
The structural pillar under gold is official-sector buying, and the headline data looks like it cooled while the real flows tell a more complex story. On the surface, central banks turned net sellers of 129 tons in Q1 2026, headlined by Türkiye offloading 60 tons in March, with net reported purchases of only 16 tons for the quarter — a sharp drop from the record-buying pace that drove much of gold's multi-year ascent. Taken at face value, that reads as the demand engine stalling.
The surface is misleading. A meaningful share of central bank purchases go unreported, because there is no mandatory rule requiring disclosure to the IMF, and the World Gold Council uses alternative data to see through the gap. Reading London over-the-counter flows and tracking shipments from Swiss refineries, the WGC estimates that gold actually purchased in Q1 2026 rose to 244 tons, up from 208 tons in Q4 2025. The official numbers show a slowdown; the OTC and refinery data show an acceleration. The buying did not stop — it went quiet.
That distinction is central to the bull case, because official-sector demand is the price-insensitive floor beneath gold. Central banks buy for diversification and de-dollarization, not for a trade, and they tend to accumulate into weakness rather than chase strength. If the WGC's 244-ton Q1 estimate is closer to the truth than the 16-ton reported figure, then the Q2 selloff into the $4,090 low was met by exactly the kind of steady official accumulation that builds a durable base. UBS still models annual central bank buying in the 750-1,000 tonne range, a pace that underwrites gold structurally regardless of the quarter's price action.
For the forecast, central bank demand is the slow-moving tailwind that does not stop the short-term volatility but sets the floor under it. It did nothing to prevent gold's 15% Q2 drop, which was driven by the fast-money real-yield trade. But it is the reason the metal found buyers at $4,090 rather than cascading lower, and it is a core plank in the bank forecasts that still cluster year-end targets far above spot. The buying going unreported does not make it any less real — the Swiss refinery data says the diversification bid is intact.
The Bank Forecasts: $4,900 to $6,000 Into Year-End
The institutional forecasts, even after Q2 downgrades, sit well above spot, and the gap is the bull case quantified. J.P. Morgan Global Research expects gold to push toward $6,000 an ounce by the final quarter of 2026, with $6,300 possible in 2027, resting the call on central bank diversification, de-dollarization, and debasement concerns now treated as permanent rather than cyclical drivers. Bank of America holds a $6,000 twelve-month target, with Michael Widmer flagging Fed leadership uncertainty, structural fiscal deficits, and historically low investor gold allocations as underappreciated upside risks.
The Q2 downgrades trimmed the targets without breaking the thesis. Goldman Sachs cut its end-2026 target to $4,900 from $5,400, citing the expectation that the Fed will not cut rates in 2026 and the sustained pressure elevated real yields put on a non-yielding asset. UBS lowered its year-end call to $5,500 from $5,900 in May, then revised further down in June after the hawkish jobs shock, while still describing the structural bull market as intact and keeping a $7,200 upside scenario if geopolitical risks escalate materially. Even the reduced targets sit 17% to 43% above the current $4,190.
The bearish outliers exist and deserve weight. OCBC expects gold to decline through the end of 2026 on rising Treasury yields, a stronger dollar, and weaker investment demand, while some technical forecasters project a slide toward $2,875-$2,994 by year-end if the Fed hikes and the dollar rallies. The unifying bearish scenario is the one Shearer named: growth and employment staying firm while inflation accelerates, forcing a Fed hiking cycle that flips Western ETF demand to sustained outflows. That is the risk that would validate the low-end calls.
The dispersion between a $2,900 bear case and a $6,000 bull case is the market's honest read on a single question — does the Fed hike or hold. This week's jobs data pushed the probabilities toward hold, which is the direction that validates the $4,900-$6,000 cluster. At $4,190, gold sits 10-29% below most year-end targets, and the bank consensus is that the structural drivers reassert once the rate-path uncertainty clears. The forecasts are a bet that the Q2 hike scare was the anomaly, not the new regime.
The Miners: Leverage That Cut Both Ways
Gold miners move with leverage to the metal, and that leverage made Q2 brutal before this week made it promising. The VanEck Gold Miners ETF, GDX, trades near $75.41 against a 52-week range of $50.35 to $117.18 — the stock got cut roughly a third from its highs as gold's 15% quarterly drop amplified through miner earnings, and the daily technical signal still reads sell after the drawdown. With about $22.7 billion in assets across 69 holdings, a P/E near 10.9, and a 0.84% yield, GDX is the flagship large-cap miner vehicle and the cleanest leveraged proxy on the gold price.
The leverage mechanism is why miners overshoot in both directions. A producer's costs are largely fixed, so when the gold price rises, the incremental revenue drops disproportionately to the bottom line, and earnings accelerate faster than the metal. Newmont, the world's largest gold miner, showed it in Q1 2026 with revenue of $7.31 billion against a $6.44 billion consensus, 1.3 million attributable gold ounces produced, a realized price near $4,900 an ounce, record free cash flow, and a fresh $6 billion buyback authorization backed by $12.8 billion in liquidity. That operating strength is why analyst targets on NEM span $120 to $175 even after the Q2 gold drop pressured the shares.
The setup now is the mirror of Q2. If gold reclaims $4,340 and presses toward the bank targets, the miners' fixed-cost leverage flips from a drag to an accelerant, and GDX's move off $75 would outpace the metal on the way up just as it lagged on the way down. Newmont reports Q2 results on July 23 with analysts projecting EPS of $2.20, a 53.9% year-over-year increase, and regulatory approvals for its Red Chris Block Cave project adding future production — a fundamentally strong producer trading at a multiple compressed by the quarter's gold weakness.
The caution is that miner leverage demands the gold call be right first. The sector's Strong Buy technical clusters from earlier in the year compressed into poor risk-reward after the sharp rallies and subsequent Q2 drawdown, and chasing miners at stretched levels into a gold bounce that has not yet cleared $4,340 carries real downside if the metal fails there. The disciplined read is that miners like NEM and the GDX complex are staggered-accumulation plays on gold weakness, not chase-the-breakout trades — the leverage rewards patience and punishes the crowded entry.
GLD, IAU, and the Western Positioning Question
The physical-gold ETFs are where Western investment demand shows up, and the flow question is the one that decides whether this bounce becomes a trend. The SPDR Gold Shares, GLD, is the largest physical gold ETF at over $132.1 billion in assets, holding 29.9 million ounces at JPMorgan and 2.4 million at HSBC — roughly 32.3 million ounces of bullion — at a 0.40% expense ratio. The iShares Gold Trust, IAU, offers the same physical exposure at a cheaper 0.25%. Together they are the barometer of how much Western capital is allocating to gold, and that allocation sits historically low.
Low Western positioning is a double-edged setup. Bank of America explicitly names historically low investor gold allocations as an underappreciated upside risk, because it means there is enormous room for Western capital to rotate into GLD and IAU if the macro turns supportive — the demand that has been absent through the hawkish Q2 could return in size. The flip side is Shearer's warning that a hawkish scenario would trigger a flip to more sustained Western ETF outflows, a persistent headwind that would compound any dip in central bank buying intensity.
This week's data leans the positioning question toward inflows. The real-yield mechanism that kept Western allocators away through Q2 — elevated yields making non-yielding gold costly to hold — began reversing with the jobs miss and the drop in September hike odds. If that persists, the opportunity-cost math that pushed capital out of GLD and IAU flips, and the low base of Western positioning becomes a source of demand rather than a symptom of absence. The ETF flow data over the next few weeks is the highest-frequency read on whether that rotation is starting.
For the forecast, GLD and IAU flows are the confirmation signal that separates a data-driven bounce from a sustained trend. Central bank buying set the floor at $4,090, but Western ETF demand is what drives gold through resistance toward the bank targets. A visible turn from outflows to inflows in the physical ETFs would validate the reclaim of $4,340 and put the $4,900 low-end year-end targets in reach. Continued outflows despite the price bounce would flag that the move is fast-money short-covering rather than real allocation, and that it may stall at the 200-day moving average.
Oil, the Dollar, and the Inflation Cross-Currents
Gold caught an extra tailwind from the energy market this week, and the mechanism is inflation expectations. Oil prices slipped as commercial shipping through the Strait of Hormuz continued to recover amid progress in indirect US-Iran talks, with Brent easing back even after a 3.9% weekly rise earlier in the conflict. Lower oil cools the inflation expectations that had been feeding the hawkish rate narrative, and softer inflation expectations pull down the real-yield pressure on gold — the same transmission that the jobs data drove, reinforced from the commodity side.
The Iran dynamic is a two-way risk for gold. The de-escalation in US-Iran talks and the Hormuz shipping recovery lowered the war premium, which cut oil and eased inflation fears in gold's favor this week. But the conflict itself, however it unfolds, reinforces the structural themes driving gold demand — US policy uncertainty, dollar-outlook concerns, elevated geopolitical risk, and stretched equity valuations. Metals Focus argued that the drivers from 2025 remain intact precisely because the conflict underscores demand diversification into gold, even as its near-term resolution lowers the inflation premium. Gold benefits from both the de-escalation now and the persistent risk backdrop over time.
The dollar completes the cross-current. A softer Dollar Index easing toward 100.55 on the jobs-driven repricing lifts gold, since a weaker greenback makes dollar-priced bullion cheaper for foreign buyers and reinforces the debasement thesis. Through Q2, the pressure ran the other way — a firmer dollar on the hawkish rate outlook was a core plank in the bearish forecasts from OCBC and others. The dollar leaking lower this week alongside falling yields is the friendliest macro combination gold can get, and both moved the right way into the weekend.
For the forecast, the oil-dollar-inflation complex is the amplifier on the rate trade. If US-Iran de-escalation holds, oil stays contained, inflation expectations moderate, and the dovish rate path that supports gold has room to persist. If the Iran situation re-escalates — the navy warning shots and the Hezbollah truce violations flag the tail risk — oil spikes, inflation expectations climb, and the market swings back toward pricing hikes, which would stall gold at resistance. The energy market is the wildcard that can accelerate or abort the bounce off $4,090.
The Forecast and the Levels That Decide It
Gold heads into mid-July at $4,190, coiled between a $4,090 floor that held through the worst quarter since 2013 and a $4,340 200-day moving average that caps the medium-term trend. The forecast is constructive but conditional. The weight of evidence — a 57,000 jobs print that cut September hike odds to 50%, Warsh's Sintra pivot on moderating inflation, silver leading the complex up 1.5-to-1, central bank buying that the Swiss refinery data says never stopped, and bank targets clustered at $4,900-$6,000 — leans toward the bounce maturing into a reclaim of $4,340 over the coming weeks.
The levels that decide it are unambiguous. A close above $4,260 confirms momentum and opens the $4,340 200-DMA as the next target; clearing $4,340 on a closing basis repairs the medium-term structure and puts the low-end bank targets near $4,900 in play. A close below $4,090 negates the bounce, hands control back to the sellers, and exposes the psychologically heavy $4,000 mark, with the technical bears eyeing lower if the dollar and yields turn back up. Between those lines, the $4,090-$4,340 range that Q2 built persists, and the rate-path data is the tiebreaker.
The catalysts to track are specific and near. The July 8 FOMC minutes are the macro pivot — a dovish read consistent with Warsh's inflation comments keeps the hike premium off and lets gold press $4,340, while a hawkish read reloads the pressure that broke the metal in Q2. The GLD and IAU flow prints are the confirmation signal for whether Western allocation is turning back on. And the US-Iran situation is the wildcard, with de-escalation containing oil and inflation expectations in gold's favor and re-escalation threatening to swing the rate market hawkish again.
The one-thesis read holds from top to bottom: the rate-hike scare that made Q2 gold's worst quarter since 2013 is unwinding, and the jobs-driven dovish turn has flipped the real-yield mechanism back in the metal's favor. Gold at $4,190 bouncing off $4,090 is the start of the repair, not yet the confirmation. The structural bull case — central bank diversification, de-dollarization, debasement, low Western allocations — never left. What returned this week is the macro permission for it to reassert. The confirmation is a close above $4,340 that turns the bounce off the eight-month low into the next leg of the secular trend.