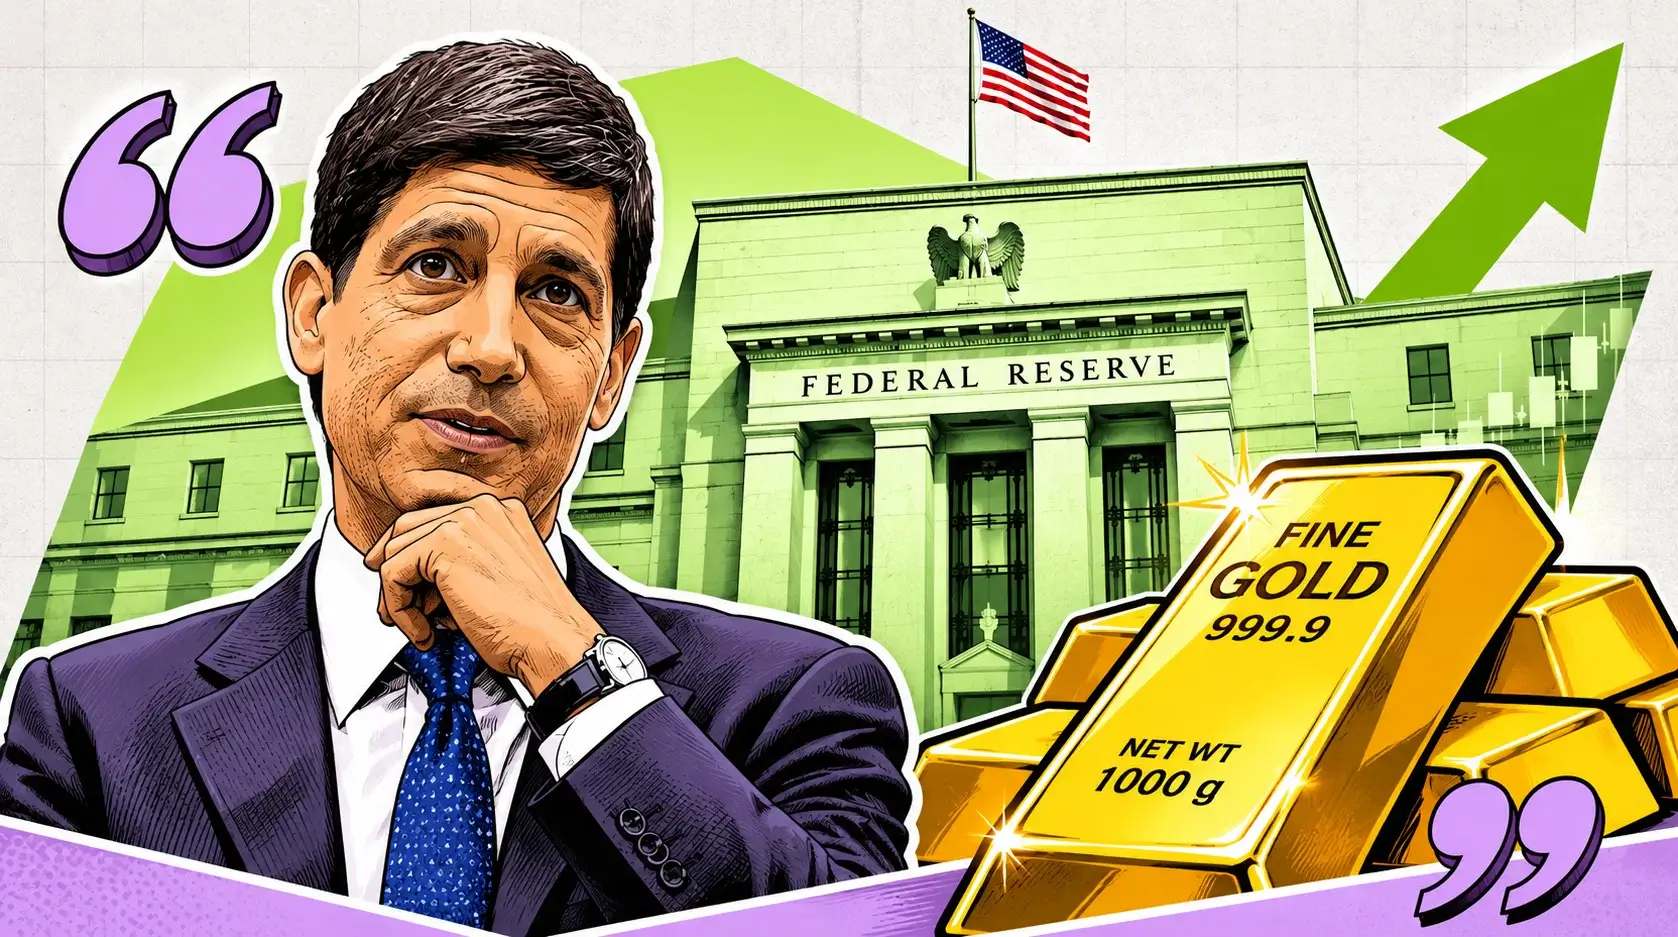
Gold Stalls at $4,088 Resistance as a Hawkish Fed Meets 321 Tonnes of Central Bank Demand — $4,262 Recovery Target
Gold’s 7% rebound from the October 30 low near $3,875 peaked at $4,147 before a hot jobs report pushed the 10-year yield to 4.90% | That's TradingNEWS
Key Points
- Spot gold fell 1% to $4,047 after payrolls hit 165,000, lifting December hike odds to 74.8%.
- Central banks bought an estimated 321 tonnes in Q3, the strongest quarter since late 2024.
- A close above $4,088.51 targets $4,262, 5.3% upside; below $4,000 opens the $3,875 October low.
Spot gold fell 1% to $4,047.10 an ounce by 8:46 a.m. ET, after touching $4,033.29 in the minutes after the October jobs report. December gold futures fell 1.4% to $4,057.20. On Thursday morning the metal traded at $4,122, so the 24-hour loss is 2%. A month ago gold was $4,168, and today’s price is 3.1% below that. Against $4,008 a year ago, gold is up only 0.8%. In a year when the price set a record of $5,595 in January, gold has given back almost all of its gains over the past 12 months.
Even with Friday’s drop, gold is up 4.5% for the week. That is its best weekly performance since late August. On October 30 the metal hit a one-year low near $3,875, then rallied 7% to a two-week high of $4,147.06 on Thursday before stalling. Friday’s payroll report ended that rebound at the first major resistance level.
The thesis for this forecast is that gold is caught between two forces that are both at extremes. The first is the Federal Reserve. The market now prices a 74.8% chance of a December rate hike, up from 72.8% before the jobs report. The dollar has risen 0.7% to its highest level since October 29, and the 10-year Treasury yield is back at 4.90%. That is the most hostile opportunity-cost backdrop gold has faced in 2026, and it puts a ceiling on rallies between $4,088 and $4,150.
The second force is physical and official-sector demand, which is unusually strong. Central banks bought an estimated 321 tonnes in the third quarter, the most in a single quarter since late 2024. Western ETFs added 211 tonnes in the same quarter, worth $31 billion. Global gold ETF holdings reached a record 4,256 tonnes at the end of September. Those buyers came in at an average price of $4,262 in Q3, and they are the reason the October 30 low near $3,875 held instead of breaking toward $3,700.
Our base case through the December 9 Fed decision is a range from $3,950 to $4,150, with a midpoint of $4,050, which is where gold trades now. A close above the $4,088.51 resistance would open a move back to Thursday’s $4,147 high and then to $4,262, the Q3 average price and the level where institutional buyers were active. That target is 5.3% above the current price. A daily close below $4,000 would put the October low near $3,875 back in play, 4.2% below the current price.
The Week’s Path: From $3,875 to $4,147 and Back to $4,033
This week’s price action makes sense only against the week before it. On October 30, gold broke below $3,900 an ounce for the first time in 2026, its lowest level since October 6, 2025. The trigger was September PCE data showing a 0.5% monthly rise and a 3.6% annual rate. That locked in expectations of a December hike just days after the Fed held its target range at 3.75% to 4.00%. The daily RSI fell to 27.2, deep in oversold territory, and the low near $3,875 left gold 30% below its January peak.
The rebound started Monday. Gold lost almost 1% early on November 3, Election Day, as oil fell on progress in US-Iran negotiations. On Wednesday, after Democrats won both chambers of Congress, Treasury yields and crude fell sharply on hopes for fiscal discipline and an end to the war. Gold rose another 1% early in the session. The election outcome removed a layer of policy uncertainty, and a move lower in yields gave a non-yielding asset room to run.
Thursday was the high point of the rally and the day it turned. Spot gold reached $4,134.83 at 03:16 GMT, its highest level since October 22. During the session it extended to $4,147.06 before the 200-period moving average on the four-hour chart, at $4,124.75, capped it. Gold was still at $4,120.60 in the US afternoon even as the Nasdaq fell 5.52%. But the equity collapse forced investors to sell winners to cover losses elsewhere, and gold had been one of the few winners of the week.
On Friday, selling hit before the data did. Spot gold fell 1.1% to $4,044.09 by 05:01 GMT as an oil rebound revived inflation concerns. Brent crude moved back toward $100 a barrel before giving up part of the gain. Gold recovered to the $4,060 to $4,077 area during the European morning. Then the 8:30 a.m. ET release pushed it to $4,033.29, the session low, before it stabilized near $4,047.
Seen on a chart, gold’s recovery from $3,875 to $4,147 was a 7% move that stopped at the first major moving average and gave back roughly 40% of its gain within 24 hours. That pattern fits a bear-market rally inside a larger corrective trend. It doesn’t look like a new uptrend. The low is still well above October’s, but the high came in exactly where resistance was expected.
165,000 Jobs and 74.8% Hike Odds: The Opportunity-Cost Problem
Gold earns no interest, so its value depends on what investors give up to hold it. Friday’s employment report made that cost higher. The Bureau of Labor Statistics release for October showed nonfarm payrolls up 165,000, against a 59,000 consensus and above even the highest estimate of 131,000. The unemployment rate fell to 4.1% from 4.2%. Average hourly earnings rose 0.4% for the month and 3.1% from a year earlier, both above forecasts. Revisions added 84,000 jobs to August and September combined.
The Fed reaction function is clear. Under Chair Kevin Warsh, the central bank raised its target range by 25 basis points to 3.75% to 4.00% on September 16, its first increase since 2023. It held at the late-October meeting. Two Fed officials argued on Thursday for small, steady rate increases to bring above-target inflation down. Before Friday’s release, futures priced the chance of a December 9 hike at 72.8%. After the release, that rose to 74.8%. A labor market creating 165,000 jobs a month with unemployment falling gives the Fed no reason to pause.
For gold, the hike itself matters less than what it says about the path after December. Before the war began on February 28, markets expected two rate cuts in 2026. By late March, traders had fully priced out any cuts for the year. Now they are pricing hikes. Each step in that repricing has raised the real return available on cash and short-term Treasuries, which is the direct competitor for gold allocations.
Gold’s 2026 track record shows the pattern. Every hot labor print this year has pushed the metal lower. On September 4, when August payrolls came in at 162,000, gold fell to $4,419 an ounce. October 30’s PCE release sent it below $3,900. Friday’s 165,000 print cut a third of the week’s rebound. The only weeks gold made progress were weeks when labor data or inflation data came in softer.
The upcoming sequence is the same calendar every rate-sensitive asset faces. The October Consumer Price Index is due next week. The November jobs report is on December 4. The Fed decides on December 9. If CPI comes in hot after Friday’s payroll beat, hike odds for December would move above 85% and push gold toward $4,000. If inflation comes in below forecasts, rate pressure would ease enough for gold to retest $4,147.
Dollar at a One-Week High, 10-Year Treasury at 4.90%
The dollar did the most immediate damage on Friday. It rose 0.7% after the payroll release to its highest level since October 29. Because gold is priced in dollars, a stronger dollar raises its cost for every non-US buyer. A 0.7% dollar move accounts for most of gold’s 1% decline. The Dollar Index had closed Thursday at 101.59, already firm, because safe-haven buying during the equity crash supported the currency even as Treasury yields fell.
Treasury yields moved with the dollar after the data. The 10-year yield rose more than 6 basis points to 4.903%, reversing Thursday’s drop to 4.835% on flight-to-safety buying. The 2-year yield, the maturity most sensitive to Fed policy, rose as much as 7 basis points to 4.54%. The 30-year yield climbed to 5.302%. When yields and the dollar rise together, financial conditions tighten, and that is the environment where gold performs worst.
The relationship between gold and real yields broke down from 2022 to 2025, when central bank buying lifted gold even as real rates rose. It has partly come back in 2026. When the 10-year yield peaked at 5.36% a few weeks ago, gold traded near $4,170. The October 30 low near $3,875 came with 10-year yields above 4.9%. The election-driven drop in yields lined up with gold’s 7% rebound. Gold is again sensitive to rates, though less so than it was before central banks became the dominant buyers.
Long-dated inflation expectations are the offsetting factor. Market-based measures of long-run inflation expectations have reached a 19-year high, according to data in the World Gold Council’s Q3 report. That is the part of the macro picture that supports gold. If investors expect inflation to stay high for years, the case for holding a real asset strengthens even as nominal rates rise. The tension is that the Fed is responding to those expectations by tightening, which raises real rates.
For the forecast, the dollar sets the near-term ceiling. Gold will struggle to clear $4,088 while the dollar stays at one-week highs and the 10-year yield sits at 4.90%. A dollar reversal would require softer US data or a hawkish shift from another major central bank, which would lower the cost of gold for foreign buyers. That is the most likely route back to $4,147.
Oil, Iran and the Inflation Loop
Oil is the second macro driver of gold this year, and the link runs through inflation. The US-Iran war began on February 28. By early March, Iran had effectively closed the Strait of Hormuz, the route for 20% of the world’s oil and LNG. Brent crude rose above $120 a barrel. In March, oil prices gained more than 60%, the largest monthly increase on record. That energy shock drove the inflation that pushed the Fed back into hiking.
Gold’s reaction was the opposite of what a simple war-hedge view would predict. The metal fell more than 13% in March, its steepest monthly drop since October 2008. Investors moved into the dollar as their preferred safe haven, and higher oil prices meant higher inflation, which meant tighter policy, which raised gold’s opportunity cost. Oil prices, inflation and gold have been closely linked this year, and the direction of that link has mostly been bad for gold.
The war has gone through several phases since then. April brought a two-week ceasefire and a temporary reopening of the strait, which sent oil down 13% in one session. Tanker attacks resumed in July. A US naval blockade of Iranian ports put economic pressure on Tehran. In August, Iran threatened to go on the offensive in the strait if diplomacy failed. In early November, oil fell on progress in negotiations, and Brent is on track for a sharp weekly drop on expectations that the war will de-escalate after the midterm results.
Friday showed the loop at work. Brent climbed back toward $100 a barrel overnight, which revived inflation concerns and pulled gold down 1.1% before the jobs data came out. By 6:52 a.m. ET, WTI traded at $90.64 and Brent at $98.18. Higher energy prices support the case for tighter monetary policy, and that hurts gold even though the conflict itself supports defensive demand.
For the forecast, de-escalation would be bullish for gold, which is the reverse of the usual relationship. A durable deal that reopens Hormuz would bring oil down toward $80, lower inflation expectations, reduce the need for further Fed hikes and lower the opportunity cost of holding gold. Renewed escalation would likely push gold lower in the short term through the inflation and rates channel. This inversion is one of the most important things to understand about gold in 2026.
The Equity Rout: Why Gold Got No Safe-Haven Bid
Thursday’s stock market collapse should have been a good day for gold under the textbook safe-haven model. The Nasdaq Composite fell 5.52% into correction territory. The S&P 500 dropped 4.36%, its worst day since April 2025, and the Dow lost 1,833 points. Nearly $3 trillion of S&P 500 market value disappeared. The VIX had its biggest one-day jump in 19 months. Asian markets followed on Friday, with Japan’s Nikkei down 6.7% and Korea’s KOSPI hitting a circuit breaker after an 8.7% drop.
Gold held up through most of Thursday. It reached its two-week high in Asian trading and stayed above $4,120 into the US afternoon. Then it turned lower. By Friday’s Asian session, gold had fallen 1.1% as investors trimmed bullion to cover stock losses. This is a recurring pattern in sharp equity sell-offs: margin calls and redemptions force portfolio managers to sell their most liquid winners, and gold, up 5% for the week at that point, was the most obvious candidate.
The same thing happened in March 2020 and in early April 2025. In both cases gold fell during the first days of the equity crash, then rallied hard once the forced selling ended and central banks responded. The difference now is that the Fed is not responding with easing. A Fed that is still hiking removes the policy support that turned gold’s earlier crash-day losses into rallies.
The cause of the equity sell-off matters too. Thursday’s rout was not a broad recession scare. It was a sector-specific repricing of AI infrastructure after anti-data-center candidates won in Texas, Ohio, Michigan and Georgia. Information technology fell 7.30% while the equal-weight S&P 500 dropped only 2.89%. A sell-off concentrated in the market’s most crowded trade creates forced selling across all assets but doesn’t raise recession odds enough to bring the Fed to the rescue.
For gold, the conclusion is that the safe-haven bid will show up only if the equity sell-off spreads into a broad growth scare that forces the Fed to reconsider hiking. Friday’s 165,000 payroll number points the other way: the economy is strong, and that keeps rate pressure on gold even as stocks fall.
Central Banks: 321 Tonnes in Q3, the Strongest Quarter Since Late 2024
The official sector is gold’s most dependable source of demand, and it accelerated in the third quarter. The World Gold Council’s Q3 2026 Gold Demand Trends report, released November 3, estimates central bank buying at 321 tonnes. That was the highest quarterly total since late 2024. Reported purchases accounted for 120 tonnes, and the remaining 201 tonnes were estimated unreported buying. The gap between reported and estimated figures has widened, which fits the view that several large buyers are accumulating without publishing their purchases.
The year-to-date pace is ahead of 2025’s. Central bank buying in Q2 reached 289 tonnes, a record for any second quarter and 62% higher than a year earlier. Year-to-date purchases through September have exceeded 2025’s pace. The World Gold Council has raised its full-year forecast and now expects central bank demand to at least match the 2025 total. Earlier in the year, its revised data had pointed to 2026 buying falling short of 2025. The September-quarter acceleration reversed that.
The same countries keep leading reported buying. Poland led all buyers through August with 98 tonnes. China’s central bank added 20 tonnes in August, its 22nd consecutive month of purchases. Uzbekistan, Kazakhstan and several Latin American central banks have bought steadily throughout the year. Singapore’s monetary authority is setting up central bank gold vaulting services in October 2026 as part of a plan to build a regional gold hub.
Surveys support the buying. In the World Gold Council’s 2026 central bank survey, a record 45% of respondents said they expect to increase their own gold reserves, and 74% expect a lower dollar share in global reserves over the next five years. 89% of central bankers expect global gold reserves to rise over the next 12 months. These are structural reserve-diversification decisions, not short-term trades.
Central banks are price-sensitive, and that matters for the forecast. The World Gold Council’s data shows official buying accelerates when gold falls and slows during sharp rallies. The Q3 average price was $4,262 an ounce. With gold now at $4,047, 5% below that average, central bank buyers are getting a better entry price than in Q3. That is the main reason the $3,875 to $4,000 zone has held, and the main reason the downside case here does not extend much below $3,875.
ETFs: Western Money Returned With 211 Tonnes and a Record 4,256-Tonne Stockpile
The investor side of gold demand has changed sharply. In the second quarter, gold ETFs saw net outflows as higher inflation, rising rate expectations and a stronger dollar pushed investors out. In the third quarter, that reversed. Western ETFs added 211 tonnes worth $31 billion. Funds in all three major regions reported inflows. European-listed ETFs led with 92 tonnes, their largest quarterly increase since Q1 2022.
September was the turning point. Investors added $10 billion to gold-backed ETFs globally that month even as gold prices fell. Holdings rose by 67 tonnes to a record 4,256 tonnes. Buying into a falling price is the opposite of the momentum-driven ETF flows of earlier cycles. It looks like strategic allocation by institutions using the March-to-October drawdown to build positions.
That shift matters because ETF flows were the missing piece of gold’s support in the first half of the year. Central bank demand alone kept a floor under the price but couldn’t drive a sustained rally. When Western investors return in size, they bring the marginal demand that pushes price up. The 2025 rally, when gold’s investment demand surged 84% to 2,175 tonnes, was driven by exactly this combination of official and Western ETF buying.
The open question is October and November. The World Gold Council’s monthly ETF flow data for October will show whether investors kept buying through the month’s decline to $3,875 or redeemed into the weakness. Gold’s 30% drawdown from its record, along with long-run inflation expectations at a 19-year high, points toward continued buying. A Fed hiking into December and a dollar at one-week highs point toward redemptions.
For the forecast, ETF flows will decide whether gold breaks out of the range. Record holdings of 4,256 tonnes show that investors have committed capital at higher prices. The Q3 average of $4,262 is roughly their aggregate entry point for that quarter. A move back toward that level would let recent buyers break even and could set off another round of momentum buying. A break below $3,875 would leave Q3 buyers more than 9% underwater and raise the risk of capitulation selling.
Read More
-
Yen Stalls at 160 Despite a 3% JGB and Tokyo Core CPI at 2.0% — Intervention Sits at 164, Friday's Payrolls Decide
02.09.2026 · TradingNEWS ArchiveEnergy
-
Ripple’s BNY and Robinhood Deals Fail to Lift XRP as Price Breaks $1.27 — $1.05–$1.35 Range Into the Fed
06.11.2026 · TradingNEWS ArchiveStocks
-
Ethereum ($2,230) Tests Its 200-Day Line After the Post-Election Rally Fails at $2,447 — $2,450 Rebound Target in Play
06.11.2026 · TradingNEWS ArchiveCrypto
-
Brent ($97) Prices In an Iran Peace Deal That Has Not Been Signed as Tanker Attacks Persist — $90–$110 Range Into OPEC+’s November 29 Meeting
06.11.2026 · TradingNEWS ArchiveCommodities
-
Nasdaq Chip Bounce Meets a 4.90% Yield, S&P 500 Edges Up, Dow Slides as NET Rips 20%
06.11.2026 · TradingNEWS ArchiveMarkets
-
GBPUSD Drops to 1.3356 as a Hiking Fed Outweighs the BoE’s 4% Rate and Its 4.9% Inflation Path — 1.3250–1.3500 Range Into December
06.11.2026 · TradingNEWS ArchiveForex
Physical Demand: Bar and Coin Down 19%, Diwali Buying Steps In
The retail physical market is weaker. Demand for gold bars and coins fell 19% from a year earlier to 268 tonnes in the third quarter, as uncertainty about the price trend kept some buyers out. In Q3 2025, bar and coin demand had held at 316 tonnes. The decline reflects how sharp the 2026 drawdown has been. Retail buyers who bought near January’s $5,595 record are sitting on losses of more than 25%, and that has kept new buyers on the sidelines.
Total demand has held up despite retail weakness. Global gold demand reached 1,369 tonnes in Q3, down only 1% from a year earlier. With the average price at $4,262, the value of that demand rose 22%. Year-to-date demand through September matched the 2025 record. Over-the-counter investment demand, which captures less visible institutional and high-net-worth flows, was estimated at 143 tonnes. Jewelry demand stayed under pressure from high prices, while technology demand held steady.
India is the immediate swing factor. Lower prices this week brought Indian retail buyers back into the market ahead of Diwali, the peak of the country’s festival buying season. Domestic gold prices in India have stayed near record levels in rupee terms because of currency weakness, but the dollar-price decline from $4,147 to $4,047 created a buying opportunity at a seasonally important time. In past years, Indian festival demand has helped stabilize prices during dips.
China’s physical market is the other key factor. The People’s Bank of China’s 22-month buying streak signals official support. Retail and institutional demand in China has historically been price-sensitive, increasing on dips. Chinese ETF demand was part of the Q3 Asian inflows. A drop in local gold prices tends to bring Chinese buyers back, as happened after the March crash.
On supply, the World Gold Council expects mine production to reach a record in 2026, though output is likely to decline modestly in Q4. Recycling supply tends to rise at high prices but has been restrained as holders wait for a recovery toward the record. Supply is not growing fast enough to weigh on prices by itself, which leaves the balance to investment flows and central bank buying.
From $5,595 to $4,047: Where the 2026 Drawdown Stands
Gold’s 2026 trajectory is one of the most dramatic in the metal’s modern history. On January 29, spot gold set an all-time high of $5,595 an ounce after nine straight days of gains. Silver reached a record above $120. Gold had gained 27% to 28% in less than a month, extending a 2025 rally driven by Fed easing expectations, record ETF inflows and central bank buying.
The war changed everything. The February 28 strikes on Iran and the closing of the Strait of Hormuz sent oil above $120, pushed inflation higher and wiped out expectations of Fed easing. Gold fell more than 13% in March, its worst month since October 2008, ending 19% below its record. The drawdown continued through the summer as the Fed shifted toward hiking. Gold dropped below $3,900 on October 30, 30% below the January peak.
At $4,047, gold is 27.7% below the record. It is still 4.4% above the October low. The Q3 average was $4,262, so current prices are 5% below what most recent institutional buyers paid. Over the past month, gold is down 1.6%. Over the past year, it is up 1.1%, which shows that 2026 has largely erased the 2025 bull run.
Forecasts are being cut. One major end-2026 forecast was lowered on Thursday to $4,150 from $4,650 because of the Fed’s more hawkish stance. A survey of 30 analysts published last week put the median target at $4,495 for 2026 and $4,650 for 2027, both well above current prices. That gap points to one of two outcomes: further forecast cuts if the Fed keeps hiking, or a sharp rally if the macro backdrop turns.
History offers some perspective. After the 1980 peak, gold took two decades to recover. After the 2011 peak of $1,920, it fell 45% before bottoming in December 2015. The 2026 drawdown of 30% from the record is sharp but much shallower than either earlier bear market. The difference is that central bank demand of 321 tonnes a quarter puts a structural floor under the price that didn’t exist in 1980 or 2011. That floor doesn’t prevent drawdowns, but it limits how deep they go.
The Technical Map: $4,051 to $4,088 Resistance, $4,000 and $3,875 Support
Gold’s chart is clearly defined. The immediate resistance zone runs from $4,051.45 to $4,088.51. Gold is trading at the lower edge of that band, and a sustained move through the upper edge would be needed to invalidate the near-term bearish outlook. Above that is the 200-period moving average on the four-hour chart at $4,124.75, where Thursday’s rally stopped. Thursday’s high of $4,147.06 is the next level, followed by the $4,145 to $4,157 band identified as the session ceiling ahead of the payroll data.
Higher resistance levels are set by October’s price action. Gold traded at $4,170 to $4,180 in mid-October before the slide toward $3,875. The Q3 average of $4,262 is the structural resistance level where recent institutional buyers broke even. Above that, the $4,400 to $4,450 area marks the late-August breakout zone where gold traded before the September payroll release.
On the downside, $4,000 is the critical psychological level. It has acted as both support and resistance several times since October 2025. A daily close below it would confirm that Friday’s reversal from $4,147 is a continuation of the larger downtrend and not just a pullback. Below $4,000, support at $3,950 marks the base from which this week’s rally started.
The October 30 low near $3,875 is the major support. A close below it would mark a new low for 2026 and the lowest level since early October 2025. It would also break the double-bottom structure that some traders were starting to price after this week’s rebound. Below $3,875, the next technical target is $3,695, which composite indicators flagged in late October as the most credible support below the market.
Momentum has recovered from the oversold readings of October 30, when the daily RSI hit 27.2. On the one-hour chart, RSI has eased to 53 after the rebound, which is neutral. The daily trend remains bearish, with price below its major daily moving averages and the MACD signal still bearish. The setup is a corrective downtrend with a sharp oversold bounce that has now stalled at resistance. A higher low above $3,950 on the next pullback would be the first evidence of a trend change.
Silver at $51.86 and the Precious Metals Complex
Silver is behaving differently from gold. Spot silver traded near $51.864 an ounce, up 0.17%, at the same time gold was down 0.89%. Silver futures had fallen 0.67% to $52.03 earlier in the session. The gap reflects silver’s dual role as an industrial metal and a monetary asset. Friday’s strong US economic data supports industrial demand even as it weighs on monetary demand.
Silver’s 2026 drawdown has been much deeper than gold’s. The metal set a record above $120 an ounce in late January, rising 60% to 67% in a matter of weeks on industrial demand from solar manufacturing and speculative buying. At $51.86, silver is down more than 55% from that peak, roughly double gold’s 27.7% drawdown. The gold-to-silver ratio has widened accordingly, now at 78 times compared with less than 50 at the January peak.
That divergence matters for gold. A rising gold-to-silver ratio usually signals defensive positioning in the precious metals market, with investors preferring the monetary metal over the industrial one. The ratio’s recent move from below 50 to 78 is consistent with a market shifting from speculative euphoria to caution. If silver keeps holding up while gold falls, the ratio would compress, which in past cycles has often come before broader precious-metals recoveries.
Platinum and palladium reached records in January along with gold and silver. Palladium futures rose 5.84% to $1,990.5 and platinum hit $2,675.7 during the late-January surge. Both have since corrected. The industrial precious metals are more sensitive to auto production and supply disruptions than to Fed policy, which makes them weaker signals for gold’s direction.
Gold miners, through vehicles such as the VanEck Gold Miners ETF (GDX) and producers including Newmont and Barrick, provide leveraged exposure to the gold price. Miners have operating cost structures that remain profitable even at $4,000 gold, which is far above all-in sustaining costs. A sustained move back toward $4,262 would expand margins sharply. A break below $3,875 would compress them but still leave most large producers well in the black.
Scenario Map: $4,262 Upside, $3,950 Base, $3,875 Downside
Our forecast covers the five weeks to the December 9 Fed decision and has three scenarios.
The base case, with a 55% probability, is a range trade between $3,950 and $4,150. In this scenario, the October CPI release comes in close to expectations, December hike odds stay in the 70% to 80% range, the dollar consolidates near one-week highs, and central bank buying absorbs dips toward $4,000. Gold trades back and forth between Thursday’s $4,147 high and the $3,950 base, finishing November between $4,000 and $4,100. The midpoint target of $4,050 is essentially unchanged from the current price.
The bullish case, with a 25% probability, is a breakout to $4,262. Next week’s inflation data would need to come in softer, December hike odds would need to fall below 50%, and a durable US-Iran deal would need to push Brent toward $80. A daily close above $4,088.51 would confirm the move, and a break above $4,147 would bring the 200-period four-hour moving average into play as support. The bullish target of $4,262, the Q3 average price and the cost basis of recent institutional buyers, is 5.3% above the current price. If ETF inflows accelerate, the move could extend toward $4,400.
The bearish case, with a 20% probability, is a break below $4,000 and a retest of $3,875. A hot CPI print would add to Friday’s payroll beat, push December hike odds above 85%, lift the 10-year yield back toward 5% and carry the dollar to new highs. Continued equity weakness would force more liquidation of gold holdings. A daily close below $4,000 opens $3,950 first and then the October low near $3,875, 4.2% below the current price. A close below $3,875 would extend the risk to $3,695.
The risk-reward from $4,047 tilts slightly up. The bullish target of $4,262 is 5.3% higher. The bearish target of $3,875 is 4.2% lower. The base case is flat. That modest upside skew rests on central bank buying: 321 tonnes in Q3, purchases accelerating on price weakness and official buyers getting a 5% discount to their Q3 average.
The signals that decide which scenario plays out, in order, are: next week’s CPI release, the dollar’s direction against its October 29 high, the October gold ETF flow data, and any de-escalation announcement in the US-Iran war. Two or more turning gold’s way would favor the bullish case. Two or more turning against it would raise the odds of a $3,875 retest.
Verdict: Hold With a Bullish Tilt, Accumulate Between $3,950 and $4,000, Target $4,262
Gold at $4,047 sits at the lower edge of a resistance zone running from $4,051.45 to $4,088.51, after Friday’s payroll print ended a 7% rebound from the October 30 low near $3,875. The macro backdrop is gold’s main obstacle. Payrolls of 165,000 against a 59,000 forecast, unemployment at 4.1% and wages up 3.1% have pushed December hike odds to 74.8%. The dollar is at its highest level since October 29 and the 10-year Treasury yield is at 4.90%. Oil’s link to inflation means every rally toward $100 Brent strengthens the case for tighter policy, and Thursday’s equity crash brought forced selling instead of a safe-haven bid.
The structural case for gold is still intact. Central banks bought an estimated 321 tonnes in Q3, the most since late 2024, and year-to-date official buying is running ahead of 2025’s pace. Western ETFs added 211 tonnes worth $31 billion in Q3, and global ETF holdings reached a record 4,256 tonnes at the end of September. Long-run inflation expectations are at a 19-year high. Total Q3 demand of 1,369 tonnes was within 1% of the year-earlier record, and its value rose 22%. Gold is 27.7% below its January record of $5,595 and 5% below the $4,262 Q3 average, which gives buyers with long time horizons a lower entry point than recent institutional buyers paid.
Our call is Hold with a bullish tilt, accumulating between $3,950 and $4,000. The base case through the December 9 Fed decision is a range from $3,950 to $4,150. A daily close above $4,088.51 would move the target to $4,262, 5.3% above the current price. A daily close below $4,000 would put the $3,875 October low back in play and invalidate the near-term bullish tilt. Next week’s CPI release is the decision point. Until it comes, the Fed holds gold back while central bank buying holds it up.