Gold Tests the $4,200 Ceiling With Record 4,256-Tonne ETF Holdings — Upside to $4,331
Central banks bought 63 tonnes of gold in September, the most since November 2024, while ETF holdings hit a record | That's TradingNEWS
Key Points
- Spot gold rose 0.43% to $4,187.70, reaching a $4,199.50 high after the dollar index fell 0.7% to 101.80.
- Global gold ETF holdings reached a record 4,256 tonnes after a record $31 billion in third-quarter inflows.
- Gold remains below its 100-day average at $4,242, 50-day at $4,331 and 200-day at $4,522.
Spot gold is bid at $4,187.70 an ounce at 10:39 a.m. ET, up $17.90, or 0.43%, on the day. The ask is $4,189.70. Friday’s range has run from $4,146.60 to $4,199.50, and the high came within 50 cents of the $4,200 handle before sellers pushed back. December COMEX futures trade at $4,206.90, up $36.80, or 0.88%. That leaves the usual contango premium of $19 over spot.
This is the second straight daily gain. Spot gold closed Thursday at $4,175.10, up 1.79% on the day, after trading from $4,096.80 to $4,175.80. That rebound came after Wednesday’s 1.51% drop to $4,101.70, when the September CPI report pushed spot to an intraday low of $4,073.80. In 48 hours gold has gained $114 from that low, or 2.8%.
The wider picture is more mixed. Gold is down 0.4% for the week as of the London morning. It is down 2.22% over the past month and down 3.68% over 12 months. Year to date, December futures are down 4.38%, and over six months the loss is 13.05%. The metal sits 25.2% below its intraday all-time high of $5,595.47, set on January 29, 2026. The LBMA afternoon benchmark peaked at $5,405.00 the same day.
The SPDR Gold Shares ETF (GLD) is at $383.58, up 0.23%. It has traded between $381.07 and $384.06 today, against a 52-week range of $360.12 to $509.70. Its net assets are $141.7 billion, the largest gold ETF by a wide margin. GLD is down 3.21% year to date and down 3.25% over a year.
In India, 24-carat gold on the MCX rose ₹793 to ₹148,282 per 10 grams, from ₹147,489 at the prior close. Physical demand in major consumer markets is following the dollar price higher.
Silver is at $57.86 to $57.92, up 0.7% to 0.84%, after a 3% gain on Thursday. The gold-to-silver ratio is 72.32, down from 72.64 on Thursday. Silver is down 18.54% year to date, much worse than gold. Platinum rose 0.7% to $1,636.98 and palladium 0.5% to $1,132.09. All three are still on track for weekly losses.
The setup is clear. Gold is pushing against the top of a two-week range just below $4,200, supported by a weaker dollar and lower Treasury yields. The open question is whether it can break that range or will fall back toward $4,100 again. The next sections lay out the levels and drivers.
Neutral Warsh, Weaker Dollar: The Overnight Catalyst
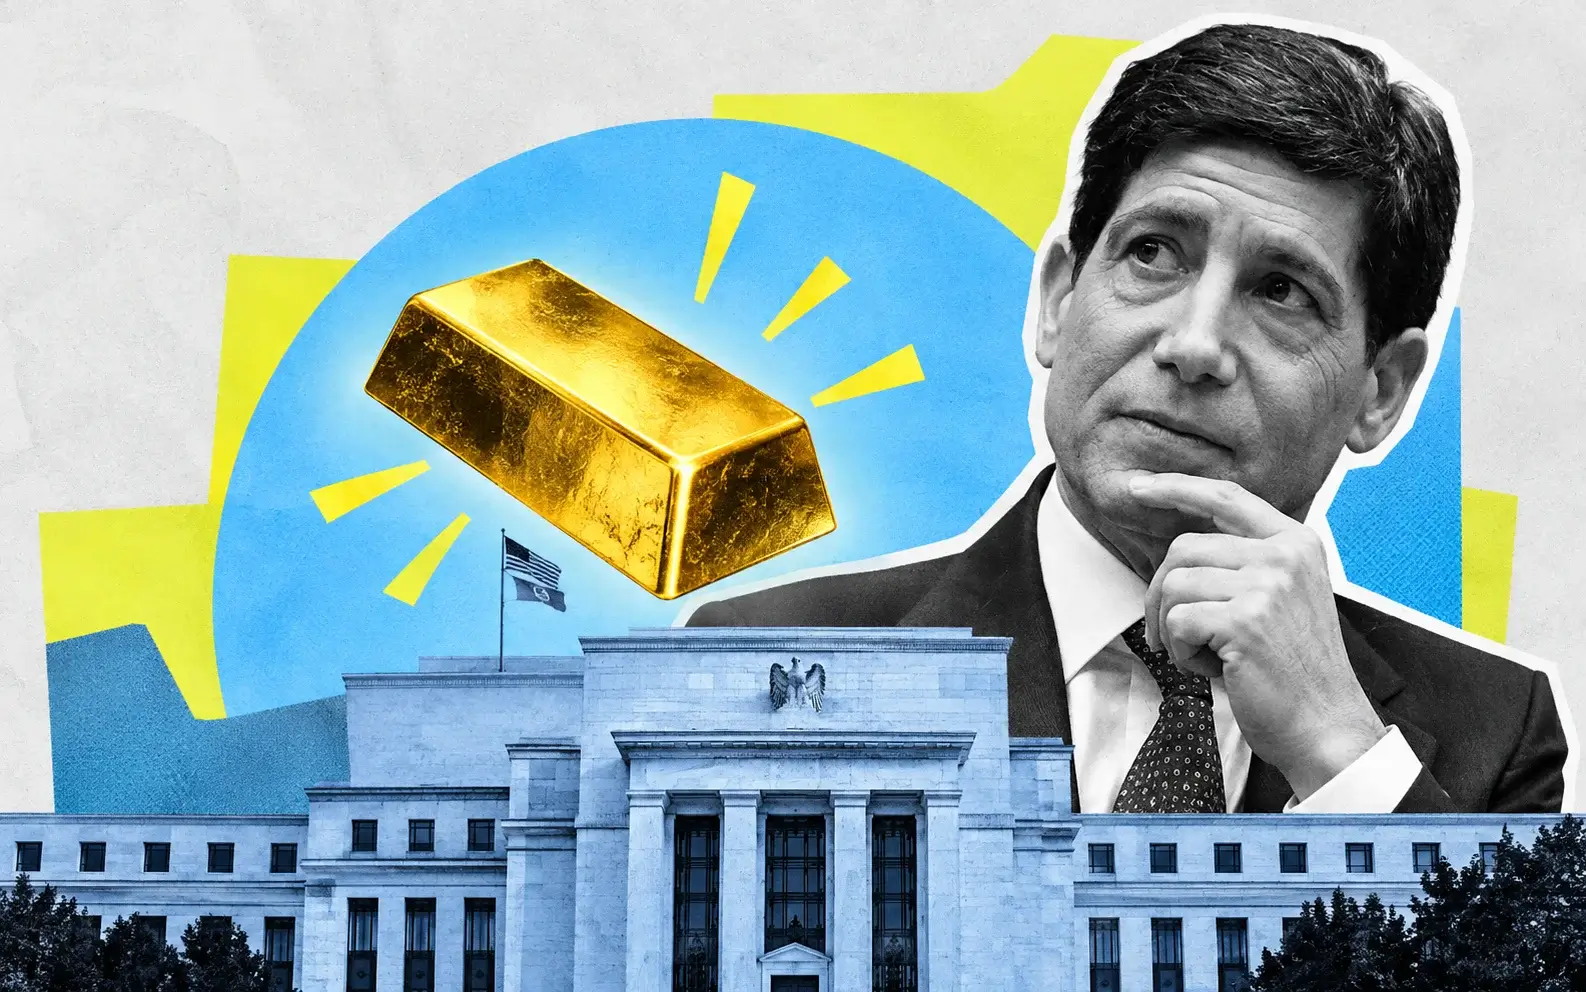
The move overnight came from Federal Reserve Chair Kevin Warsh. In a fireside chat with IMF Managing Director Kristalina Georgieva at the IMF–World Bank Annual Meetings in Bangkok, Warsh said conditions since the September meeting had “broadly conformed to our expectations.” On the October decision, he said: “I don’t prejudge meetings.”
For gold, that was enough. Markets were braced for a hawkish signal after September’s hot CPI and PPI reports. Warsh did not give one. The dollar index fell 0.7%, dropping to its lowest level in almost two weeks. It slid from close to an 18-month high near 103 to test 101.80. The dollar is now on track for its first weekly decline in five weeks.
Gold is priced in dollars, so a weaker dollar makes it cheaper for buyers using euros, yen, rupees and yuan. Before Warsh spoke, gold had dipped to the $4,150 area in Asian trading. Buyers stepped in there and lifted spot to $4,178.50 by 06:57 UTC. By the London morning it was at $4,176.92 and futures were at $4,198.10.
The bond market moved in the same direction. The 10-year Treasury yield fell to a three-week low below 5.10% on Thursday and is at 5.07% today. Gold pays no interest. Every basis point off long-term yields lowers the cost of holding it.
Fed pricing also shifted. Before the CPI report, markets put October hike odds at 22%. After CPI, they rose to 29%. After PPI and Warsh’s comments, an October hike is close to fully priced out, with odds in the high-20s. December remains open: markets were pricing an 85% chance of a hike by December earlier in the week, and the hot inflation data keeps that risk alive.
Other Fed officials have signaled the same patience. Vice Chair Philip Jefferson, New York Fed President John Williams and Governor Christopher Waller have all pointed toward an October hold. Waller noted that rate increases do not need to come at back-to-back meetings. Warsh’s appearance came just before the pre-meeting blackout period, so no more Fed guidance is expected before October 27–28.
Warsh also called the AI investment boom “probably the most important thing that’s happening in the global economy on the upside.” He has linked part of the rise in long-term yields to large technology firms competing for capital. That matters for gold. If AI-related borrowing keeps pushing yields up, it keeps the opportunity cost of holding gold high. If AI credit stress pushes investors into Treasuries, as it did Thursday, yields fall and gold benefits.
The Warsh effect is real but short-term. It lifted gold to the top of its range. Breaking out of that range needs more than a quiet Fed chair.
The Inflation Paradox: 6.3% PPI and 3.7% CPI Without a Breakout
On paper, this week’s inflation data should have sent gold higher. The September producer price index rose 1.3% for the month, more than double the 0.6% forecast. It was the largest monthly jump since March 2022. Year over year, PPI reached 6.3%, against a 5.3% forecast. Core PPI rose to 5.0%, above the 4.4% expected. Goods prices climbed 2.6% in the month, and services rose 0.8%.
Consumer prices were also hot. September CPI rose 0.6% for the month and 3.7% year over year, above the 3.6% forecast. Core CPI increased 0.3%, versus a 0.2% forecast, for an annual core rate of 2.6%. Energy prices rose 5.2% in a month and gasoline jumped 9.1%. September retail sales rose 0.8%, showing that consumer spending is holding up even with higher prices.
The paradox is that gold fell on the CPI report. On Wednesday, spot dropped 1.51% to $4,101.70 and touched $4,073.80. The reason is the Fed. Hot inflation raises the odds of more rate hikes, and higher rates raise real yields, the inflation-adjusted return on bonds. Real yields are gold’s main short-term headwind. For a day, the rate risk mattered more to gold than the inflation itself.
PPI on Thursday had the opposite effect. Gold rose 1.79%, even though the producer data was worse. Treasuries rallied, the 10-year yield dropped 10 basis points, and money moved into safe-haven assets as concerns over AI-related debt spread. CoreWeave’s 2031 bonds were yielding 15.78% on more than $50 billion of debt. That pushed investors toward government bonds and gold at the same time.
The inflation data matters over the medium term. A 6.3% PPI print points to more pressure on consumer prices in coming months. Gold’s long-term case rests on protecting purchasing power when inflation stays above central bank targets. Real yields near current levels are a headwind today, but sustained inflation tends to win out over time.
The key number to watch is the real yield, not the headline yield. With a 10-year Treasury at 5.07% and CPI at 3.7%, the real yield based on current inflation is 1.37%. If inflation keeps rising while the Fed holds, real yields compress and gold benefits. If the Fed hikes in December while inflation stabilizes, real yields rise and gold stays stuck.
The data does not settle the question. It supports both sides of the trade. The outcome depends on how the Fed responds at its next two meetings.
Record 4,256 Tonnes in ETFs: The Demand That Price Hasn’t Caught
The strongest support for gold this month is in the fund flow data. Global gold ETFs took in $10 billion in September, bringing third-quarter inflows to a record $31 billion. Holdings rose 67 tonnes in September to a record 4,256 tonnes. In the third quarter alone, holdings grew by 211 tonnes.
That buying happened while prices fell. Total ETF assets under management dropped 7% in September to $574 billion because the gold price declined. But holdings in tonnes increased. Investors added more metal even as the dollar value of their positions shrank. This is buying on weakness, not chasing a rally.
European-listed funds led the way. They took in $3.6 billion in September and a record $14 billion in the third quarter. UK funds were the largest contributor in September, adding $2.2 billion. German and French funds also had solid inflows. Swiss-listed funds recorded inflows even though their holdings dropped 1 tonne, a result of how currency-hedged products work.
Holdings at 4,256 tonnes with gold 25.2% below its January record creates a clear gap between demand and price. In past cycles, record ETF holdings came with record prices. This time, the price is being held down by real yields while physical demand keeps growing. That gap tends to close one of two ways: either prices rise, or ETF buyers start to sell. So far there is no sign of selling.
The second quarter was different. ETFs saw 44.8 tonnes of outflows as gold fell from its January high toward $4,000 by the end of June. The shift from second-quarter outflows to record third-quarter inflows shows investors stepped back in once prices stabilized in the $4,000 to $4,300 range.
GLD is the bellwether. It holds $141.7 billion in net assets. Its 52-week range runs from $360.12 to $509.70, and at $383.58 it sits 6.5% above its low and 24.7% below its high. Trading in GLD is light today, at 962,985 shares by 9:55 a.m. against a 9.28 million daily average. Investors are not rushing in after the Warsh-driven move.
Global gold trading volumes averaged $423 billion per day in September, down 2% from August. Liquidity is stable. The market can take large flows without disorder.
For the forecast, ETF demand acts as a floor. A record 4,256 tonnes held through a 25% drawdown from the peak shows that these buyers have long-term conviction. Dips toward $4,100 and $4,000 are likely to meet ETF buying, not forced selling.
Central Banks Add 63 Tonnes: The Official Bid
Central bank buying is the second pillar of support, and it picked up in September. Preliminary estimates put central bank gold purchases at 63 tonnes in September, the highest monthly total since November 2024.
The People’s Bank of China is the most visible buyer. It added 23 tonnes in September, its largest monthly purchase in close to three years, and extended its buying streak to 23 straight months. Chinese gold ETFs also saw strong inflows, and holiday demand for jewelry, bars and coins improved in China’s physical market. Strong buying from both the central bank and households points to a stronger fourth quarter for Chinese demand.
The longer-term numbers are large. Central banks bought 288.9 tonnes in the second quarter of 2026, up 62% from a year earlier and more than five times their first-quarter total. First-half purchases totaled 345 tonnes. September’s 63 tonnes signals that the pace is picking up again in the second half.
Central banks behave differently from ETF investors and futures traders. They buy for reserve diversification and long-term strategic reasons, not to trade. They care less about price. That makes their buying a steady source of demand that does not disappear when prices fall. In the second quarter, central banks bought 288.9 tonnes while ETFs sold 44.8 tonnes. Official buying kept a floor under gold during its weakest period.
The motivation is reserve diversification. Central banks around the world have been reducing their reliance on U.S. Treasuries. Higher U.S. yields make Treasuries more attractive on paper, but sanctions risk and concerns about U.S. fiscal policy have pushed reserve managers toward gold. Estimates of annual central bank demand run from 750 to 1,000 tonnes.
The link to Treasury yields is worth noting. When yields rise, it usually hurts gold. But when yields rise because of U.S. fiscal worries and heavy debt issuance, rather than strong growth, central banks have a stronger reason to diversify into gold. The 30-year Treasury yield reached its highest level in 19 years earlier this month, prompting the Treasury to buy back bonds. That kind of stress in the bond market supports central bank demand for gold.
For the forecast, official buying adds to the floor set by ETF holdings. Combined, 63 tonnes from central banks and 67 tonnes into ETFs in one month is 130 tonnes of demand that does not depend on day-to-day price moves. That is why gold has held above $4,000 through a year of high real yields and a hawkish Fed.
The Two-Week Box: $4,096 to $4,230
Gold has been stuck in a narrow range for two weeks. Since early October, spot has traded inside a box roughly centered on the October open at $4,158. The floor is $4,096 to $4,104, which has held on every test. The ceiling is $4,220 to $4,230, which has capped every rally.
The floor has been tested several times. On October 7, spot touched $4,061.70 intraday before closing at $4,100.50. On October 14, after CPI, it touched $4,073.80 and closed at $4,101.70. On October 15, it opened at $4,101.50, dipped to $4,096.80 and reversed to $4,175.10. Three sessions in October touched or broke below $4,100 intraday, and all three closed at or above that level. That is a defended floor.
The ceiling is just as clear. On October 9 spot hit $4,207 intraday. On October 12 it reached $4,216.20. On October 13, $4,200.40. Friday’s high so far is $4,199.50. Each attempt to break $4,200 has failed between $4,200 and $4,216. The top of October’s range sits at $4,230.
Gold has lost close to 10% from its September high. The September 23–27 period traded between $4,294.90 and $4,321.20. On September 28, gold fell 3.15% in one day. That drop pushed it below $4,200, and it has not closed above $4,220 since. The $4,300 to $4,330 area is now resistance from that breakdown.
The daily chart is showing momentum divergence. Price has made lower lows near $4,061 and $4,073, but momentum indicators have made higher lows. That pattern often comes before a reversal, as sellers lose strength. The October opening range is still intact, so a decisive break in either direction should give a clear signal for the next move.
The volume pattern supports the floor. The heavy selling into $4,100 on October 7 and October 14 was absorbed, and the bounces from there came quickly. Thursday’s 1.79% rally from $4,096.80 was the strongest one-day move of the month.
A break above $4,230 would end the two-week range. The next resistance levels would be the 100-day moving average at $4,242 and then the $4,307 to $4,319 band. A break below $4,096 on a closing basis would open the 2026 low daily close at $4,007, and then the yearly low near $3,942 to $3,951.
For now the range holds. Friday’s push toward $4,200 is the sixth test of the top of the box this month.
The Moving Averages: $4,242, $4,331 and $4,522
Gold is trading below all three of its main moving averages, which keeps the medium-term trend bearish. The 100-day simple moving average is at $4,242. The 50-day is at $4,331. The 200-day is at $4,522. Spot at $4,187.70 is $54 below the 100-day, $143 below the 50-day and $334 below the 200-day.
The order of the averages tells the story of 2026. The 200-day average is highest, reflecting the January run to $5,595.47 and the following months at elevated levels. The 50-day is lower, reflecting the summer slide to $4,000 by the end of June. The 100-day sits below both, showing the market has spent most of the last three months under $4,300. A bearish stack like that only turns bullish after a sustained rally above all three.
The 100-day at $4,242 is the first real test. It sits just above the $4,230 top of the October range, so a close above $4,242 would break the range and reclaim the 100-day in the same move. That would be the first bullish trend signal since September.
The 50-day at $4,331 lines up with the late-September highs between $4,294.90 and $4,321.20, and with the $4,307 to $4,319 resistance band. That cluster makes the $4,300 to $4,331 zone the main upside target if gold breaks out.
The 200-day at $4,522 is far away. The $4,400 horizontal level sits between the 50-day and the 200-day. Reclaiming $4,522 would require a significant change in the Fed outlook, such as rate cuts being priced in again.
The daily RSI is still in bearish territory, under 50. Momentum has not confirmed the latest bounce. On the four-hour chart, gold has climbed from the $4,073 low to $4,176.51 and above. Short-term momentum has improved, but the daily trend has not turned yet.
Other technical markers fill in the map. The October 2025 swing high at $4,382 is the next level above the 50-day. The 61.8% Fibonacci retracement of the January-to-June decline sits near $4,456. On the downside, the 2026 low daily close at $4,007 and the yearly low near $3,942 to $3,951 are the deeper supports.
The averages give a clear upside path: $4,242, then $4,331, then $4,382 and $4,456. Each step requires a daily close above the prior level. Gold has not cleared the first of these yet.
The Dollar and Yields: DXY 101.80 and the 10-Year at 5.07%
Gold’s main short-term drivers are the dollar and real yields. Both moved in gold’s favor this week, but not far enough to change the trend.
The dollar index is testing 101.80 after Warsh’s comments, down 0.7% on Friday. It has pulled back from its 18-month high near 103 and is now on track for its first weekly decline in five weeks. EUR/USD is up 0.43% and GBP/USD up 0.53%. USD/JPY has dropped below 158. The dollar is weakening across the board, not just against one currency.
A weaker dollar helps gold, but the relationship is not perfect. The dollar index is still not far from its 18-month high. Holding below 102 keeps the path to $4,200 and above open for gold. A move back above 103 would likely push gold back to the bottom of its range.
Yields are the bigger driver. The 10-year Treasury yield is at 5.07%. It fell to a three-week low below 5.10% on Thursday. The 30-year yield is at 5.43%. Those are some of the highest long-term yields in two decades.
Gold’s January peak at $5,595.47 came with much lower yields. The crash that followed started on January 30, when Kevin Warsh was nominated as Fed Chair and markets quickly priced in a more hawkish Fed. Since then, long-term yields have risen and gold has given up 25.2% of its value. That correlation explains the past nine months.
The key question for gold is the direction of real yields. Nominal 10-year yields at 5.07% with CPI at 3.7% leave a real yield of 1.37%. If inflation keeps rising while the Fed holds, that gap narrows and gold rises. If the Fed hikes again in December while inflation stabilizes, real yields rise and gold faces more pressure.
Credit risk is now a factor too. Thursday’s yield drop came partly from AI credit concerns pushing money into Treasuries. CoreWeave’s bond yields above 15% are a clear sign of stress in parts of the corporate debt market. If that stress spreads, Treasuries and gold could rally together, a classic flight to safety. Gold rose 1.60% to 1.79% Thursday on that dynamic.
Oil adds to the mix. Brent crude is above $106 and WTI is at $95.91. High oil keeps inflation expectations up, which supports gold over time. The IEA’s release of the last 100 million barrels from its March agreement and possible U.S. easing of shadow-fleet sanctions could pull oil lower. That would ease inflation pressure and, in the short run, take some support away from gold.
For the forecast, a dollar below 102 and a 10-year yield below 5.10% are the conditions for gold to break above $4,230.
Read More
-
Yen Stalls at 160 Despite a 3% JGB and Tokyo Core CPI at 2.0% — Intervention Sits at 164, Friday's Payrolls Decide
02.09.2026 · TradingNEWS ArchiveEnergy
-
Ford ($12.75) Breaks Out of Its October Range Ahead of Earnings as Super Duty Hits a 19-Year Production High — Upside to $13.35
16.10.2026 · TradingNEWS ArchiveStocks
-
XRP ($1.34) Defends $1.29 as Cross River and Standard Chartered Adopt RLUSD — Upside to $1.50
16.10.2026 · TradingNEWS ArchiveCrypto
-
WTI Jumps 5.6% This Week as U.S. Stocks Fall 8.56M Barrels While Brent Stays Near $105 — Upside to $102.50
16.10.2026 · TradingNEWS ArchiveCommodities
-
Dow Gains 0.48%, Nasdaq Loses 210 Points, S&P 500 at 7,735 as MU Slides 3.8%
16.10.2026 · TradingNEWS ArchiveMarkets
-
Sterling (1.3366) Tests the 100-Day SMA as 54 of 63 Economists Expect a BoE Hike — Upside to 1.3435
16.10.2026 · TradingNEWS ArchiveForex
Geopolitics: Hormuz, Iran and the Missing War Premium
Geopolitical risk is high, but gold is not reflecting it much. That gap is part of the forecast.
The Middle East has escalated on two fronts. Ships have caught fire or sunk in the Strait of Hormuz this week, and more than two dozen attacks have been recorded in the region since the start of October. Conflict along the Red Sea has also picked up, disrupting oil flows. President Trump said the U.S. may strike Iran’s nuclear facilities again, including the fortified Pickaxe Mountain site. He ruled out nuclear weapons and ground troops but said the Pentagon is considering using the largest non-nuclear bomb in the U.S. arsenal.
In past cycles, risks like these have pushed gold sharply higher. Today, the reaction is muted. Gold is still 25.2% below its January high and down 3.68% over a year, despite repeated escalation.
The reason is the Fed. With real yields at 1.37% and the dollar near an 18-month high, the rate headwind has outweighed the safe-haven bid. Middle East risk shows up in oil, with Brent above $106, more than in gold.
The war premium is likely to return if the Fed outlook softens. If October hike odds keep falling and the dollar stays below 102, the geopolitical bid can show up in price. A U.S. strike on Iran would be a clear test. A conflict that pushes oil above $110 would lift inflation expectations and safe-haven demand together, which is a strong combination for gold.
The U.S. political calendar matters too. The November 3 midterms are less than three weeks away. The White House has called for interest rates of 1% or less, putting pressure on the Fed. Fed independence is a long-term support for gold. A visible clash between the White House and the Fed tends to push investors toward gold as protection against policy uncertainty.
Global markets are fragile. Japan’s Nikkei 225 fell 4.90% on October 15 to 64,425.95, a 3,318.34-point drop. Taiwan’s Taiex lost 3%. U.S. chip stocks are on a nine-session losing streak. The S&P 500 is little changed, with the Nasdaq down and the Dow up as investors rotate between sectors. Thursday’s gold rally came as AI-related selling drove investors toward safe havens. Another wave of equity stress would likely help gold again.
Geopolitics is not today’s driver, but it is a source of upside if the Fed backdrop improves. A conflict that sends oil and fear higher while the Fed holds would remove the main obstacle to the war premium returning to gold.
Silver, Platinum and Miners: The Rest of the Complex
The other metals are following gold’s lead, but with weaker results. That tells us the current rally is a gold story, not a broad commodity move.
Silver is at $57.86 to $57.92, up 0.7% to 0.84% on the day after a 3% jump on Thursday. It touched $59.91 on COMEX early in the session. Silver is down 18.54% year to date, much worse than gold’s 4.38% loss in futures. The gold-to-silver ratio is 72.32, down from 72.64 on Thursday. A falling ratio means silver is outperforming gold in the bounce, which often happens early in a precious metals recovery.
Silver’s levels are clear. It needs to break above $64 to signal a real recovery. A drop below $55 would open $50. In January silver was above $80, and COMEX silver crashed more than 30% in a single day after Warsh’s nomination, its worst day since 1980. Silver now trades at roughly 70% of its January level.
Platinum is at $1,636.98, up 0.7%. Palladium is at $1,132.09, up 0.5%. Both are on track for weekly losses, along with silver. Industrial metals are not leading. The gains are limited to the safe-haven end of the precious metals group.
Gold miners usually amplify gold moves. With gold 25.2% below its peak, miners have taken larger losses than the metal. Equinox Gold rose 7.97% on Thursday to $11.11, showing how quickly miners respond when gold bounces. The VanEck Gold Miners ETF (GDX) has $26 billion in assets, and the VanEck Junior Gold Miners ETF (GDXJ) holds $8 billion.
Miners have strong cash flow at current prices. All-in sustaining costs for the major producers are far below $4,187.70, so margins remain wide. If gold holds above $4,100, miners have room to re-rate as investors return to the sector.
The lower-fee gold ETFs are also growing. SPDR Gold MiniShares (GLDM) has $31 billion in assets at a 0.10% fee, and iShares Gold Trust Micro (IAUM) has $8 billion at 0.09%. Investors are choosing the cheapest way to hold gold, a sign of long-term positioning rather than short-term trading.
The rest of the complex supports a cautious read. Silver’s outperformance in the bounce is constructive. Platinum and palladium heading for weekly losses shows there is no wider commodity rally to lean on. Gold has to break out on its own drivers: the dollar, yields and safe-haven demand.
Scenarios Into the October 27–28 FOMC
The Fed decision on October 27–28 is the next major catalyst for gold. Each scenario depends on Fed pricing, the dollar and the steady demand from ETFs and central banks.
Base case: break above $4,242 toward $4,331 (50% probability). The Fed holds in October as signaled. The dollar index stays below 102. The 10-year yield holds between 5.00% and 5.10%. ETF inflows continue at September’s pace. Gold breaks the $4,230 top of its range and closes above the 100-day average at $4,242. That opens the $4,300 to $4,331 zone, where the 50-day average meets the late-September highs. A move to $4,331 from $4,187.70 is 3.4% higher. A hold decision on October 28 that keeps December uncertain would support that move.
Bull case: $4,382 to $4,456 (20% probability). AI credit stress spreads and pushes the 10-year yield below 5.00%. The dollar index falls toward 100. Oil spikes on Hormuz escalation or a strike on Iran, adding to safe-haven demand. Central bank and ETF buying both pick up. Gold clears $4,331 and moves to the October 2025 swing high at $4,382, then to the 61.8% retracement near $4,456. That is a 6.4% gain from today’s level.
Bear case: break below $4,096 toward $4,007 (30% probability). The dollar index climbs back above 103. Fed speakers signal an October hike before the blackout, or the market prices a December hike near 100%. The 10-year yield returns to 5.20% or higher. Gold loses the $4,096 to $4,104 floor on a daily close. Next support is the 2026 low daily close at $4,007, then $3,942 to $3,951. A drop to $4,007 from $4,187.70 is a 4.3% decline.
Several events before the meeting can shift the odds. U.S. housing data on October 20 will show how 7.5% mortgage rates are affecting the economy. Big Tech earnings from Tesla, Meta and Netflix on October 20 and 21 will shape the AI credit story. Weekly jobless claims and any surprise from Middle East headlines are also wildcards.
The weekly close matters too. A close above $4,200 would be the first weekly close above that level in three weeks and would set up the base case. A close below $4,150 would mean the Warsh bounce has failed and leave the bear case in play.
The odds favor the base case. Record ETF holdings, the strongest central bank buying in close to two years, a weaker dollar and lower yields support a break higher.
Gold Price Forecast Verdict: Hold $4,096, Break $4,242, Target $4,331
Gold is at $4,187.70, testing the top of a two-week range just below $4,200. The setup leans constructive, but it needs confirmation.
The bull case rests on four points. First, demand is strong: global ETF holdings are at a record 4,256 tonnes after a record $31 billion in third-quarter inflows, and central banks added 63 tonnes in September, the most since November 2024. Second, the dollar is weakening, with the index down 0.7% to 101.80 after Warsh’s neutral comments and heading for its first weekly drop in five weeks. Third, yields are easing, with the 10-year at 5.07% after a three-week low below 5.10%. Fourth, the $4,096 to $4,104 floor has held through three intraday breaks this month, and momentum divergence on the daily chart points to selling exhaustion.
The bear case rests on three points. Gold is below its 50-day, 100-day and 200-day moving averages at $4,331, $4,242 and $4,522. It has failed six times in October to break above $4,200 to $4,216. And the Fed is still a risk: a December hike is far from ruled out, inflation is running at 3.7% on CPI and 6.3% on PPI, and real yields at 1.37% remain a headwind.
The gap between record physical demand and a falling price is the core of the forecast. Gold is 25.2% below its January record of $5,595.47 while ETFs hold more metal than ever and central banks are buying faster than at any point in close to two years. That kind of gap tends to resolve in favor of price when the rate headwind eases. Warsh’s neutral stance and a softer dollar are the first signs of that easing.
The forecast is a break above $4,242 that targets $4,331 into the October 27–28 FOMC, a 3.4% gain from the current price. The triggers are a daily close above $4,230, a daily close above the $4,242 100-day average and a weekly close above $4,200. The invalidation level is a daily close below $4,096, which would shift the outlook to the $4,007 bear target.
The risk-reward favors buyers. From $4,187.70, the distance to the $4,096 floor is $91.70 and the distance to the $4,331 target is $143.30, a ratio of 1.6 to 1. The longer-term case, backed by central bank demand, record ETF holdings and inflation above target, points well beyond $4,331. In the near term, the levels to watch are $4,096, $4,242 and $4,331.
The verdict is bullish with conditions: hold $4,096, break $4,242, target $4,331.