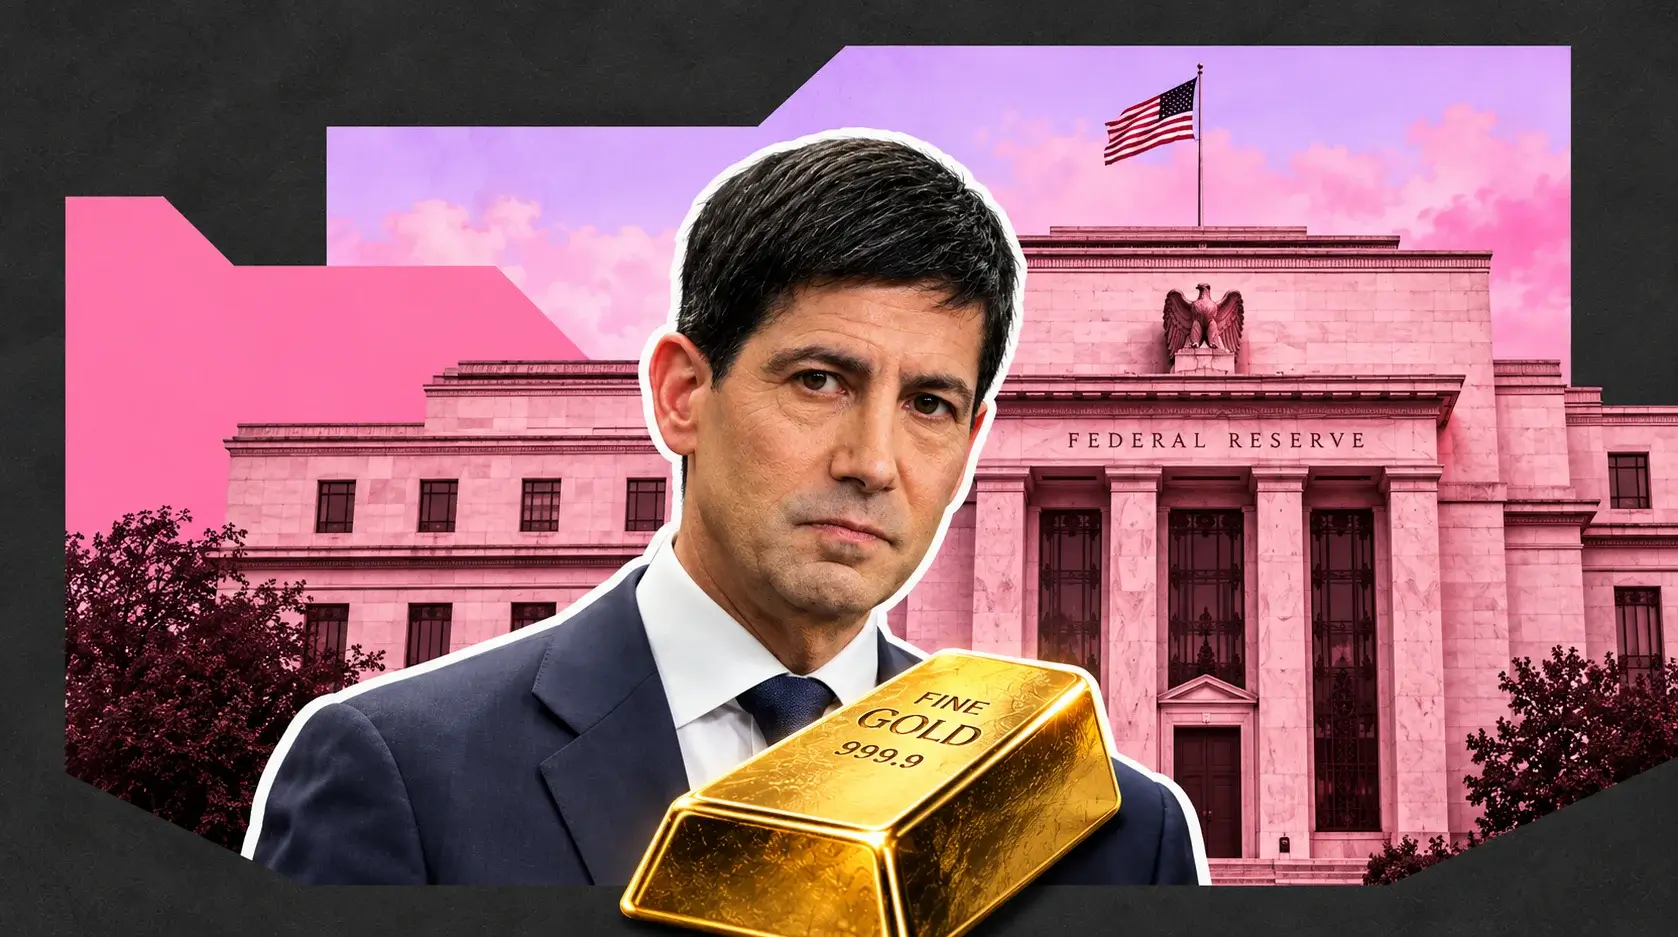
Gold (XAU/USD) Stalls at $4,051 With September Fed Hike Odds at 64.5% — Deutsche Bank Targets $4,700 as Central Banks Buy 289 Tonnes
Bullion sits 27.5% below the January 28 record of $5,589.38 and has coiled inside a 2.3% band for three weeks | That's TradingNEWS
Key Points
- Gold futures opened at $4,135.20 and slid to $4,111.50 as WTI crude collapsed 6.21% to $79.41 on the Iran pause.
- Deutsche Bank sees fair value near $4,700 by year-end, 16% above the $4,051 spot print and above its $4,600 Q4 forecast.
- Central banks bought 289 tonnes in Q2, up 62% year over year, while gold ETFs shed 45 tonnes on rising real yields.
December gold futures opened at $4,135.20 per troy ounce Monday, up 0.7% from Friday's settlement, then rolled over inside two hours. By 7:58 a.m. ET the contract had slipped to $4,111.50. Spot metal traded $4,045.55 at 9:00 a.m. against $4,040.49 at the same hour Friday, a $5.06 gain that amounts to 0.13%. By 10:00 a.m. the spot print sat at $4,051, up $13 versus the July 31 comparison and $688 above the level of a year ago. The CFD benchmark showed $4,061.51, up 0.46% on the day, down 2.48% over the past month, and 20.37% higher year over year.
The catalyst was the same one that moved every other asset class. President Trump called off planned strikes against Iran and announced negotiations opening Monday afternoon, with Gulf allies including Saudi Arabia pushing hard for the diplomatic route. West Texas Intermediate snapped 6.21% lower to $79.41. Brent dropped 5.11% to $83.24. The S&P 500 ripped 1.16% to 7,576.54 and the Nasdaq Composite gained 1.77%.
Gold's response to that setup is the entire story. A safe-haven asset should sell off hard when a war risk premium comes out of the market. Bullion did the opposite of selling off hard and the opposite of rallying: it opened up 0.7%, faded 0.6%, and settled into a range that has held for weeks. The SPDR Gold Shares ETF added 0.24% to $372.42. The dollar index slipped 0.10% to 99.8100, removing one headwind without providing a tailwind.
The reason the de-escalation produced almost no net move is that the Iran conflict has functioned as a bearish force for gold in 2026, not a bullish one. Higher crude fed inflation expectations, inflation expectations fed rate projections, and rate projections crushed the non-yielding metal. Taking oil out of the equation removes the safe-haven bid and the rate-hike pressure at the same time, and those two forces roughly cancel.
Physical markets showed the same inertia. Indian 24-carat gold printed ₹14,421 per gram, down ₹1 from the prior session, with 22-carat at ₹13,219 and 18-carat at ₹10,815, both lower by the same ₹1. Silver eased to ₹234.90 per gram and ₹2,34,900 per kilogram, off ₹100 on the kilo. A currency-adjusted move of one rupee across the largest retail gold market on earth describes a price that has stopped discovering.
The Fed Voted 9-3 and Three Presidents Wanted a Hike
The July 29 FOMC decision is the number that matters more than any Middle East headline. The committee voted 9-3 to hold rates, the most divided decision since September 2016. All three dissents came from regional bank presidents, and all three favored an immediate hike. Gold rallied more than $40 on the day, which reads as counterintuitive until the composition of the vote gets factored in: a hold is a hold regardless of the margin, and the market took the absence of action at face value for about 48 hours.
The bond market has been pricing the dissent, not the decision. CME FedWatch now shows a 64.5% probability of a rate hike at the September meeting, with other measures putting it near 63%. The two-year Treasury yields 4.25%. The ten-year sits at 4.69% after topping 4.73% on Friday, its highest in over a year. The thirty-year spiked to 5.25% last week, the highest long-bond yield since 2007.
For a non-yielding asset, that curve is the whole problem. Holding an ounce of gold means forgoing 4.25% on a two-year note and 5.25% on a thirty-year bond, and those opportunity costs compound every quarter the position sits. Ten-year real yields have climbed toward 2.08%, a level that has historically capped bullion regardless of what central banks are doing on the physical side. Gold is negatively correlated with real yields, and real yields have gone the wrong way for seven straight months.
Chair Kevin Warsh's hawkish pivot is the mechanism. Under his tenure the committee has moved from a projected easing path to a projected tightening path, and the July meeting delivered no forward guidance at all, which the market read as preserving optionality to hike rather than optionality to cut. That reading is what put September hike odds near two-thirds.
The week ahead loads the pressure further. July ISM Manufacturing printed 55.6 against a 54.0 estimate, the strongest factory reading since May 2022, with the Employment Index crossing into expansion at 52.8% for the first time in 33 months and the Prices Index at 71.1%. ISM services lands Wednesday, ADP the same morning, and July nonfarm payrolls Friday at 8:30 a.m. Every one of those prints skews the September calculus, and the ISM number already skewed it hawkish.
Deutsche Bank Says the Explosive Phase Has Not Ended
Deutsche Bank told clients Monday that gold remains inside an explosive phase of price behavior that began in August 2024, and that its models still point to fair value well above spot by year-end. Research analysts Michael Hsueh and Bryant Xu put the fair value figure near $4,700 an ounce, slightly above the bank's $4,600 fourth-quarter forecast, which it maintained.
The statistical framing is what gives the call weight. A measure of explosive price behavior identifies the current episode as ongoing and as only one of five to appear in data running back to 1975, after filtering out isolated single-month readings as noise and aggregating temporally linked observations. Five episodes across 51 years is a rare regime, and the bank's argument is that regime persistence beats mean reversion here.
The note approached the downside question from three angles and produced conflicting answers, which the bank resolved explicitly rather than splitting the difference. Adjusting gold-to-commodity relative price ratios for long-term growth rates, indexed to a 1986 reference, throws off substantial downside. Regression evidence on drawdowns inside explosive phases points the other way, implying limited further decline. The fair value model, built on gold's demonstrated sensitivities to financial market variables, lands at $4,700.
The resolution was to discount the commodity-ratio downside and overweight the fair value model. Against a spot price near $4,051, a $4,700 year-end fair value implies 16.0% upside over five months. Against the $4,600 Q4 forecast, the implied move is 13.6%.
That call sits inside a wide dispersion of institutional views. JPMorgan spent the spring defending a $6,000 fourth-quarter target and cut it 25% to $4,500 in early July, with its head of base and precious metals describing a market stuck in technical no-man's-land, capped below its 50-day moving average and pushed to the back burner for most investors. Morgan Stanley maintains an upside bias for the second half with a $5,200 target contingent on Western ETF buyers returning. The World Gold Council's mid-year outlook places fair value near $4,100 with upside to $4,500 or higher on a macro shift.
The spread between $4,100 and $5,200 across three of the largest research houses on the street describes exactly how much the September Fed decision matters to this asset.
Anatomy of a 28% Drawdown From $5,589.38
Gold set its all-time high at $5,589.38 on January 28, 2026, after a session that added more than $300 in a single day. From that peak to Monday's $4,051 spot print, the decline runs $1,538.38, or 27.5%. Measured against the June trough near $4,046, the drawdown reached 27.6%, the steepest quarterly correction since 2013.
Three traceable forces produced it. The Fed pivoted hard under Warsh, converting an expected easing path into a tightening path and driving real yields up. The Iran conflict worked backwards: escalation spiked Brent above $112 per barrel in late February, and $100-plus crude forced the FOMC to rethink its 2026 roadmap, which crushed the metal rather than lifting it. And profit-taking hit after a 2025 that delivered roughly 65% returns, gold's strongest annual performance in decades.
The path down was not linear. From $5,589.38 in January, gold traded $4,694 by May 12, a 16% decline. By mid-June it sat in the $4,180 to $4,320 band, down 20% to 25%. By late June it was $4,175. It printed near $4,046 in July and has spent the past three weeks compressing between $4,040 and $4,135.
Historical context matters for the structural read. Every significant gold bull market in modern history has included corrections of 15% to 47%. A 27.5% drawdown sits comfortably inside that range and toward the middle of it, not the extreme. In every prior case the underlying monetary thesis proved correct across the full cycle.
Silver took a far worse beating. From an all-time high of $121.62, the metal fell to roughly $58, a decline of more than 52%. Monday's September silver futures opened at $58.65, up 1.5% from Friday's close, then eased to $58.03 by 8:23 a.m. ET. Spot silver traded $58.22 at 8:41 a.m., $1.87 per gram, $1,871.82 per kilogram, and $58.26 on the CFD benchmark for a 1.10% gain. Silver is down 6.10% over the past month and up 55.68% year over year.
The gold-to-silver ratio reads 71.0 as of Monday, inside the long-term 60-to-70 average range and up from 69:1 last week. Neither metal is dramatically mispriced against the other at this level.
Central Banks Bought 289 Tonnes While ETFs Bled 45
The World Gold Council published Q2 2026 Gold Demand Trends on July 30, and the numbers explain why gold has floored at $4,040 rather than breaking down. Total demand landed flat year over year at 1,269 tonnes. First-half demand rose 2% to an estimated 2,522 tonnes worth $380 billion, a record value figure.
Central banks bought 289 tonnes in the second quarter, a 62% increase over Q2 2025, recovering sharply after a Q1 slowdown that followed a downward data revision. Q1 accounted for 244 tonnes, putting combined first-half sovereign accumulation above 530 tonnes. That pace runs at the lofty levels typical of the past four years, and it happened while the price was falling 25%.
Gold-backed ETFs went the other way, recording 45 tonnes of net outflows across the quarter, concentrated in North America. First-half ETF demand stayed modestly positive at 18 tonnes, which means the entire year's paper accumulation got erased and then some inside three months. The mechanism is direct: elevated inflation readings push bond markets to price a more aggressive Fed path, real yields rise, and Western ETF holders sell.
Investment in ETFs, bars, and coins together fell to 262 tonnes in Q2. Bar and coin demand held steady year over year at 307 tonnes, a return to typical levels after two extraordinarily strong quarters. Jewellery demand volumes dropped 17% year over year as consumers cut purchases and shifted toward lighter products, though first-half jewellery value rose 22% to $86 billion globally on the price effect.
The sovereign bid is not going away, but it is decelerating. The WGC Central Bank Gold Reserves Survey found 45% of respondents intend to increase gold reserves over the next 12 months. Guidance for the second half calls for central banks to remain significant buyers at a slightly slower pace than the last four years, with investment driving demand growth and the composition shifting toward OTC activity and Asian buyers. Western ETF interest gets tied explicitly to real yields, US monetary policy expectations, and the dollar.
The People's Bank of China bought nearly 10 tonnes in May alone, extending accumulation to 19 consecutive months.
The OTC Channel Is Now the Largest Single Source of Demand
Over-the-counter physical gold demand reached 327 tonnes in Q2 2026, making it the biggest individual demand category of the quarter and exceeding ETF outflows by a factor of more than seven. That single number reframes the entire flow narrative. Headline ETF redemptions dominate financial media coverage because the data publishes daily, while OTC volume publishes quarterly and moves seven times the metal.
OTC transactions run outside exchange-traded wrappers: institutional buyers, high-net-worth individuals, family offices, and sovereign entities purchasing physical bullion directly. The WGC attributes a meaningful portion of Q2 OTC demand to Asian private investors who prefer direct ownership over paper exposure. That preference has hardened as the price fell, which is the inverse of how Western ETF holders behaved.
The East-West split is the defining structural feature of this market. Western capital treats gold as a rate-sensitive allocation and sells when real yields rise. Eastern capital treats it as a store of value and buys when the price falls. In Q2 those two flows netted to approximately zero, which is exactly what a flat 1,269-tonne demand print with a 25% price decline looks like.
Gold has also crossed a threshold that changes its institutional standing permanently. According to European Central Bank data, gold has surpassed US Treasuries as the world's largest reserve asset. Central bank demand for gold expanded from 10% to 24% of the gold market since 2022; their Treasury demand represents only 7% to 10% of net issuance over the same span.
That shift is why the drawdown has not turned into a rout. A 27.5% decline in an asset held predominantly by leveraged speculators produces cascading liquidation. A 27.5% decline in an asset increasingly held by sovereign reserve managers with no mark-to-market pressure and multi-decade horizons produces a floor. Reserve managers are lowering exposure to dollar assets specifically because of the threat of foreign asset freezing, and that motivation does not reverse on a Fed dot plot.
Bank of America's June fund manager survey found 58% of 198 managers overseeing $540 billion expect stagflation. Gold's overvalued reputation among that cohort sits at its lowest point since February 2024, which sets up positioning for a squeeze if the September hike does not materialize.
Read More
-
Yen Stalls at 160 Despite a 3% JGB and Tokyo Core CPI at 2.0% — Intervention Sits at 164, Friday's Payrolls Decide
02.09.2026 · TradingNEWS ArchiveEnergy
-
CHAT Fund Holds $96.37 as Korean Memory and Chip Exposure Drive a 109.73% Year — Break of $98.02 Opens $105.20
18.09.2026 · TradingNEWS ArchiveStocks
-
First-Generation XRPR and XRPI Ride XRP's Rebound to $1.386 as Spot Funds Post First Outflow — Break of $1.40 Opens $1.54
18.09.2026 · TradingNEWS ArchiveCrypto
-
NG Holds $2.9255 as Storage Surplus Narrows From 5.5% to 3.7% in 3 Weeks — Break of $3.00 Opens $3.15
18.09.2026 · TradingNEWS ArchiveCommodities
-
Dollar Surges to 157.90 as BoJ's Divided Hike Fails to Lift the Yen — Break of 158.87 Opens 159
18.09.2026 · TradingNEWS ArchiveForex
Supply Is Rising and Recycling Is Falling
Total gold supply in Q2 2026 came in unchanged year over year at 1,269 tonnes, matching demand exactly. Underneath that flat headline, the two components diverged sharply. Mine production rose an estimated 2% year over year to 966 tonnes, supported by new output from Canada and Chile. Recycling declined 6% year over year despite prices that remain 20% above where they sat 12 months ago.
The recycling number is the more informative of the two. Scrap supply is the most price-elastic source of gold on earth: when prices spike, jewellery boxes empty out. Recycling falling 6% at $4,050 an ounce, after a January peak of $5,589.38 pulled forward every marginal seller, says the willing scrap supply has already been harvested. That removes a meaningful buffer from the sell side going forward.
Mine supply growth of 2% sits well inside the historical band and does nothing to change the medium-term picture. Large mining projects still use planning price assumptions well below market levels, which keeps capital allocation conservative and supply elasticity slow even after major price gains. A significant disruption at Indonesia's Grasberg complex offsets a portion of new project additions.
The producer economics at current prices remain exceptional rather than merely good. Newmont reported all-in sustaining costs near $1,680 per ounce in 2026, up sharply from roughly $1,400 two years ago on labor, energy, and grade pressure. At $4,051 gold, that leaves a gross margin above $2,370 per ounce, or 58.5%. The 16% drawdown that had already occurred by early June compressed margins from an extreme level to an exceptional one without breaking a single producer's cash generation.
Newmont's operational picture carries its own complications. The company designated 2026 a trough year, guiding total attributable production to 5.3 million ounces against nearly 6 million the prior year, on a sequencing reset at Boddington in Australia and technical delays across Nevada. Miners are earning more while producing less. Q1 2026 free cash flow ran $3.1 billion with $2.7 billion returned through dividends and buybacks and a $3.2 billion net cash position at quarter end.
The Nevada Gold Mines joint venture remains the sector's live dispute. Newmont issued a formal Notice of Default to Barrick, the JV operator, on February 3, 2026.
China Just Deleted Its Retail Paper Gold Market
The Industrial and Commercial Bank of China, the world's largest bank by assets, halted intermediary services for individual precious metals trading on the Shanghai Gold Exchange after settlement on July 24. Postal Savings Bank of China, Ping An Bank, China Guangfa Bank, and China Construction Bank all executed the same wind-down. Existing clients faced three options: close positions, liquidate holdings, or take physical delivery before the deadline.
The trigger was the volatility itself. Gold peaked near $5,600 an ounce in January and fell below $4,000 by June, a swing of roughly 30% that turned leveraged retail positions into margin emergencies across banking apps and teller counters nationwide. Banks responded first by raising margin requirements to as high as 140%, a level at which a trader posts more collateral than the notional value of the position, which defeats the purpose of leverage entirely. When that failed to clear the risk, they shut the product.
New retail SGE-linked accounts have been paused since late 2020, when the Crude Oil Treasure scandal wiped out thousands of Chinese retail investors on negative-price WTI contracts. What happened in July closes the final chapter: existing accounts terminated, margin deposits refunded.
The structural consequence favors physical demand. Physical gold purchases are completely unaffected, as are non-leveraged accumulation plans and ETFs. The Shanghai Gold Exchange continues operating normally for institutional participants and physical delivery. Displaced retail capital has one obvious destination, and China already runs deep infrastructure for retail physical purchase through bank-sold bars and jewellery stores that function as de facto bullion dealers.
The read-through to the global price is a reduction in speculative paper turnover from the world's largest gold consumer and a probable increase in physical offtake. That fits the Q2 demand mix precisely: OTC physical at 327 tonnes leading all categories while paper products bled. Household money is moving from borrowed-money bets on metal into the parts of the market Beijing can supervise.
Chinese gold imports have surged to their highest level in more than two years, which is the same signal from the customs side of the ledger.
Technical Structure: A Three-Week Coil Between $4,040 and $4,135
Gold has spent three weeks compressing into one of the tightest ranges of the year. The floor sits at $4,040.49, Friday's 9:00 a.m. reference and the level that has been tested repeatedly since the June low near $4,046. The ceiling is Monday's futures open at $4,135.20. That is a 2.3% band, extraordinarily narrow for an asset that moved $300 in a single session seven months ago.
The projected trading range for Monday runs $4,059.90 to $4,114.01, and price has stayed inside it. A break below $4,059.90 on rising volume opens a sequential downside ladder at $4,007.83, $3,951.68, $3,893.96, $3,820.00, $3,729.82, $3,643.24, and $3,580.75. The first of those levels is the psychological $4,000 handle, and the market has not traded a sustained session below it since June.
The 50-day moving average remains the operative ceiling and gold remains capped beneath it, which is the definition of technical no-man's-land. Until a daily close clears that average, every bounce inside the band is range noise rather than trend change.
Intraday quotes across venues cluster tightly enough to confirm the compression. Spot printed $4,074.60 at 8:05 a.m. ET, $4,045.55 at 9:00 a.m., $4,051 at 10:00 a.m., and $4,061.51 on the CFD benchmark. Gram pricing sat at $131.00 and kilogram pricing at $131,001.43.
Volatility compression of this magnitude resolves violently in one direction. The catalysts that break it are scheduled: ISM services Wednesday, ADP the same morning, and July nonfarm payrolls Friday at 8:30 a.m. A payrolls print that pushes September hike odds above 75% takes gold through $4,040 and toward $4,000. A soft print that cuts those odds below 50% clears $4,135 and opens the $4,300 zone where price traded in mid-June.
Historical data shows gold averaged a 0.84% gain in the month following a 25-basis-point Fed hike. In three specific tightening cycles the metal rallied outright as rate hikes triggered growth fears. The hike itself is not automatically bearish; the anticipation of it is what has done the damage.
Miners Are Pricing a Lower Gold Price Than the Metal Is
Gold equities have compressed alongside bullion but the margin math has not deteriorated at anything close to the same rate. Newmont trades near $93.86 with a market capitalization above $54 billion, an all-in sustaining cost near $1,566 per ounce on some measures and $1,680 on others, and a 1.22% dividend yield. Barrick, which changed its ticker from GOLD to B to reflect its copper pivot, trades around $36.86 with a $35.2 billion market capitalization. Agnico Eagle sits near $145.34. AngloGold Ashanti gained 3.37% to $81.99.
The VanEck Gold Miners ETF trades near $74.50 with approximately $23.2 billion in assets across more than 50 producers at a 0.51% expense ratio. It recorded record inflows in the first quarter of 2026, and the relative performance of GDX against the junior fund GDXJ has become the sector's cleanest read on whether capital prefers established production or exploration optionality.
Operational leverage is why the equities move more than the metal in both directions. A miner's cost base is largely fixed; once the gold price clears the cost to produce, every incremental dollar drops through as pure profit. At $4,051 gold against $1,680 AISC, Newmont captures $2,371 per ounce, and 5.3 million attributable ounces of guided 2026 production translates that spread into roughly $12.6 billion of gross margin before overhead, taxes, and sustaining capital already embedded in AISC.
The sector's problem in 2026 has been that the market stopped paying for it. A 27.5% bullion drawdown compressed miner multiples faster than it compressed miner cash flow, which is the disconnect patient capital has historically exploited. Free cash flow of $3.1 billion in a single quarter against a $54 billion market capitalization annualizes to a 23% yield on the largest producer in the industry.
Barrick's copper pivot adds a second engine. The company is deploying $2 billion into an expansion at an existing Zambian copper mine and building a copper-gold mine in Pakistan scheduled to come online in 2028. Newmont carries significant copper assets alongside 118 million ounces of gold reserves and 149 million ounces of resources.
The variables that determine whether these equities lead or lag from here are quarterly AISC progression at Newmont, the Nevada Gold Mines legal resolution, and whether gold holds $4,000.
Forecast: $4,000 Is the Line, $4,700 Is the Target
Base case holds gold between $3,950 and $4,300 through the third quarter with a skew toward the upper half of that band as the year progresses. Spot at $4,051 sits 27.5% below the January 28 record of $5,589.38 and 20.37% above where it traded a year ago, which frames the position precisely: deep in a cyclical correction, still inside a structural bull market.
The bear case requires $4,040 to break. Losing that floor opens $4,007.83 immediately, then the psychological $4,000 handle, then $3,951.68 and $3,893.96. A September hike delivered at 64.5% implied odds, confirmed by a hot July payrolls print Friday, is the mechanism that gets price there. Downside from $4,051 to $3,893.96 is 3.9%. Downside to $3,820.00 is 5.7%. The commodity-ratio work that Deutsche Bank explicitly discounted implies substantially more than that, which is the tail nobody is positioned for.
The bull case runs through the fair value model. Deutsche Bank's $4,700 year-end estimate implies 16.0% upside; its $4,600 Q4 forecast implies 13.6%. Morgan Stanley's $5,200 target implies 28.4% and requires Western ETF buyers to return, which requires real yields to fall, which requires the September hike to be priced out. The World Gold Council's $4,100 fair value with $4,500-plus upside brackets the middle of that range.
Three conditions have to align for the upper scenarios. Real yields need to retreat from 2.08%. Western ETF flows need to reverse the 45-tonne Q2 outflow. And central banks need to sustain something close to the 289-tonne quarterly pace that produced a 62% year-over-year increase in Q2. Two of those three are already in place on the physical side; the third is entirely a Federal Reserve question.
Watch three things this week. Whether ISM services Wednesday confirms the 55.6 manufacturing acceleration. Whether Friday's July payrolls push September hike odds through 75%. And whether spot holds $4,040 on any hawkish print. Gold has coiled inside a 2.3% band for three weeks with a 9-3 Fed vote, a 62% jump in sovereign buying, and a $4,700 fair value estimate all sitting unresolved on the same chart. That resolves this month.