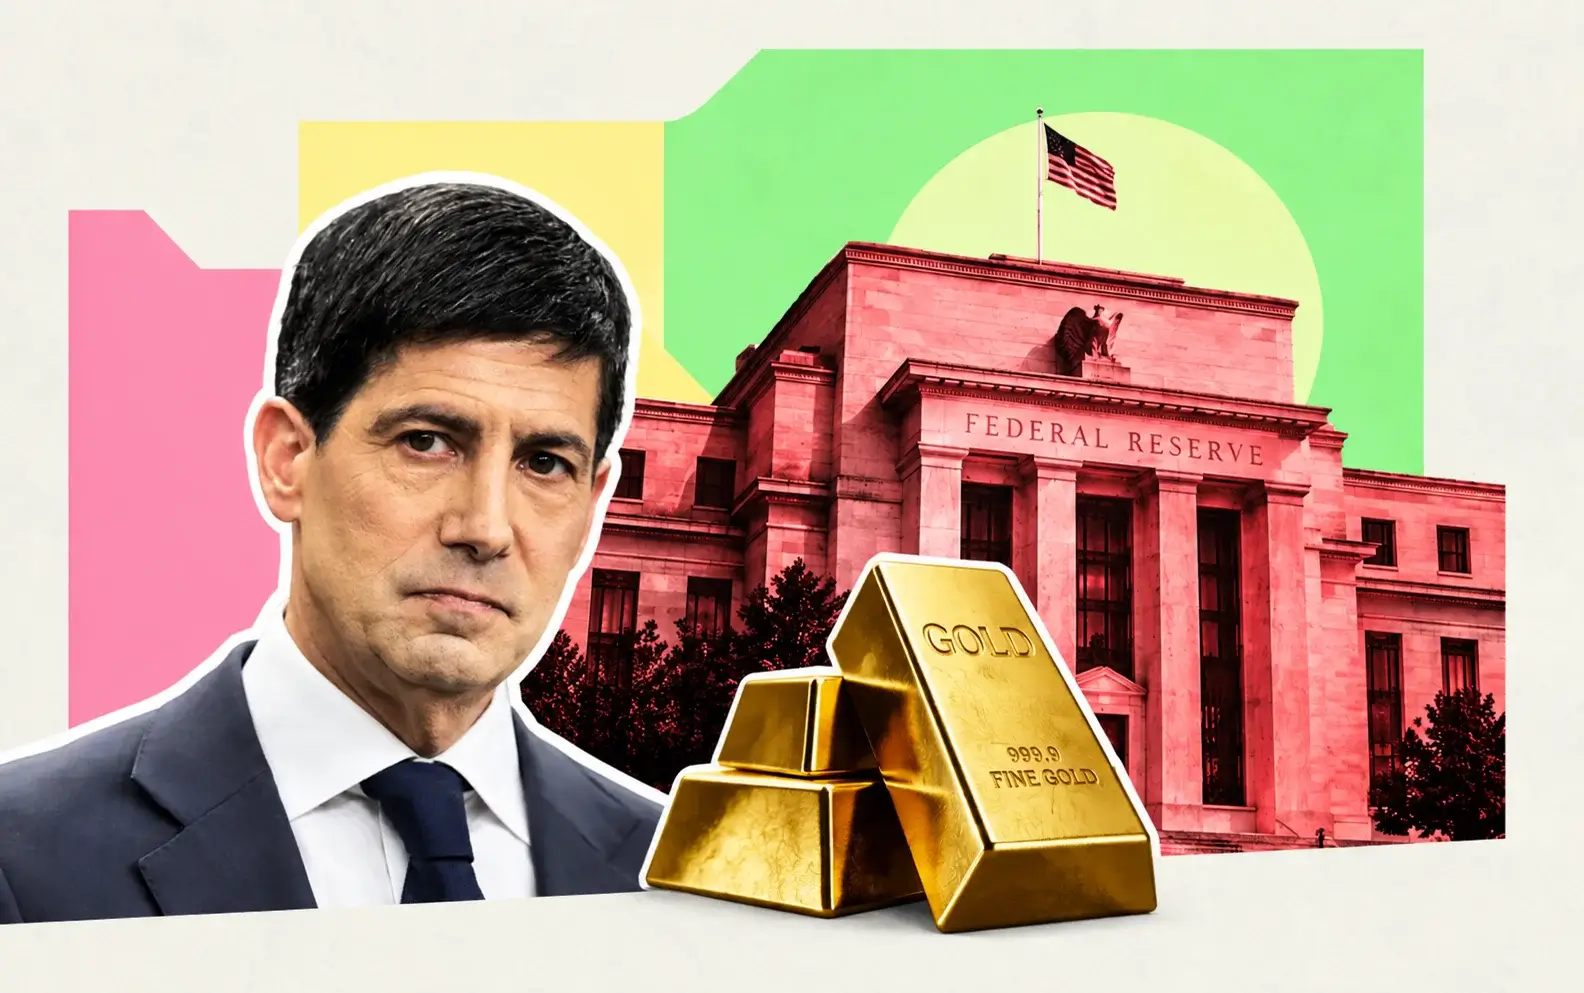
Gold (XAU/USD) Tags $4,106 in Asia Then Slips to $4,075 — Silver Jumps With Wednesday's FOMC Deciding Whether $4,200 or $4,000 Breaks First
Gold gapped higher on the US-Iran strike pause, ran above $4,106 in Asian hours | That's TradingNEWS
Key Points
- XAU/USD ran above $4,106 in Asia then faded to about $4,075, barely changed from Friday's $4,070.80 settle.
- Brent fell over 7% to around $87, cutting July Fed hike odds to 30.5% from 37.4% Friday.
- Gold reclaimed its 50-day EMA at $4,072 and 100-day EMA at $4,066 after bouncing off trendline support.
Gold opened the week with a gap higher and spent the rest of the session handing it back. XAU/USD gapped up on the Sydney open, climbed more than 1% in Asian hours and printed above $4,106 before the first trim. By 04:17 GMT the spot market was quoted at $4,088.13, down $2.05 on the candle. Through the European session it consolidated near $4,097, still up roughly 1% on the day, before fading through the New York morning to trade around $4,075 — barely changed against Friday's $4,070.80 COMEX settle and up just 0.10% to 0.16% on the futures screen.
That is a full round-trip of the risk-relief bid inside eight hours, and it mirrors what happened everywhere else Monday. The S&P 500 opened up 0.85% on futures and closed the morning flat at 7,411. Bitcoin touched $65,359 at 7 a.m. Eastern and sank to $64,580. Gold ran to $4,106 and sat back down at $4,075. One catalyst lifted every asset at the open, and every asset failed to hold it.
The weekly context makes the fade less surprising. Gold has just completed one of its more violent seven-day stretches of the year: a spike above $4,160, a slide toward $4,000, and a scramble back above $4,100, all inside a single week. Monday's tape is calm by comparison, consolidating above the intraday 50- and 200-period moving averages after last week's whipsaw. The one-month range runs from roughly $3,962 to $4,200 — a $238 box, or 5.9%, that has contained every attempt in either direction.
Performance metrics tell the real story. Gold is up 2.44% over one week and 1.96% over one month, which reads constructive. It is down 5.67% year to date and up 22.94% over twelve months, which reads as an asset that peaked and has been correcting ever since. The 52-week range spans $3,311.56 to $5,602.23. Both ends of that band were printed inside the last twelve months.
Silver outperformed decisively, trading $59.43 against Friday's $58.12 for a 2.26% gain, compressing the gold-silver ratio to 68.93 from 69.73. That relative move is the cleanest sign that Monday's bid was a risk-on inflation-relief trade rather than a safe-haven rotation — the industrial metal led, the monetary metal followed and then faded.
Brent's Seven Percent Collapse Is the Only Catalyst That Mattered
The mechanism behind Monday's gold gap runs entirely through crude. Brent September futures fell as much as 7.4% to 8.2% at the open, breaking below $90 a barrel from Friday's settle near $96.80 and trading around $87 into the London session — roughly $10 lower than last week's peak above $100. West Texas Intermediate dropped 6.7% to $83.37 before stabilising near $83.50 against Friday's $89.31.
The trigger was the pause in hostilities. The United States halted a nearly two-week strike campaign against Iran starting late Friday without formal announcement, and Tehran signalled it would refrain from retaliation as long as the American pause holds. Iran opened a channel with Oman specifically on the Strait of Hormuz, the waterway carrying roughly a fifth of global oil and gas before the war. Mediator talks continued through the weekend, and hopes for a second round of peace negotiations are what repriced the energy curve.
For gold this is a double-edged input, and that duality explains the intraday reversal. Lower oil reduces the inflation impulse that has been forcing the Federal Reserve toward tightening, which supports gold by capping real yields. Lower oil also removes the geopolitical premium that has been the metal's most reliable bid all year. Gold rallied on the first effect at the Asian open and surrendered to the second effect by the New York morning.
The critical detail is that gold stopped functioning as a pure safe-haven months ago. It now trades primarily off rate expectations. Last week proved it: the Middle East escalated, gold initially rallied, and the entire gain was erased once Brent's surge above $100 pushed bond yields higher and hardened the hawkish case. A war that lifts oil now hurts gold on net, because the inflation-driven tightening response outweighs the crisis bid. That inversion is the single most important structural change in the gold market this year.
Whether Monday's relief persists depends on a fragile arrangement. Iran-backed Houthi forces claimed weekend attacks on Saudi Aramco-linked facilities at the Red Sea ports of Jizan and Yanbu, the alternate export route Riyadh has leaned on because Hormuz is compromised. This is a hold-fire, not a settlement.
Real Yields, Not Headlines, Are Setting the Price
Treasuries did exactly what falling oil dictates, and gold's morning strength tracked them precisely. The two-year yield fell almost four basis points to 4.29% and the ten-year dropped more than four basis points to 4.63%, both retreating from cycle highs set Thursday and Friday — the highest levels across the entire curve since late 2024. The thirty-year sits at 5.16%.
That retreat is what mechanically supports a non-yielding asset. Gold's opportunity cost is the real yield available on Treasuries, and 2026 has been a masterclass in that relationship running against the metal. The dollar reached a 13-month high in late June as hawkish repricing accelerated under the new Fed chair. Gold fell 29% from its January peak over roughly the same window. There is no mystery in the correlation.
Monday reversed both legs. The dollar weakened against every one of its G10 counterparts — a broad, uniform move that speaks to genuine unwinding of the geopolitical premium rather than a technical adjustment. A softer dollar makes gold cheaper for holders of every other currency, which is the second channel supporting the Asian-session rally.
The two-year is the instrument worth watching into Wednesday. Desk commentary through July has been consistent that its level carries more information about the policy path than anything at the long end, and gold's sensitivity to it has been near-perfect. A four-basis-point decline is a nod to cheaper energy. It is not a repricing of the Fed, and gold's inability to hold above $4,100 reflects that distinction accurately.
Notes circulated late Friday made the point that while easing energy prices support shorter-dated Treasuries, yields remain near the top of their recent range because investors continue pricing a hawkish central bank. That is the honest read on Monday's whole session across every asset class: the curve took the oil relief and kept the policy risk.
Gold's rebound found technical validation in the process, reclaiming both its 50-day exponential moving average at $4,072 and its 100-day at $4,066 after bouncing off a rising trendline. Holding those averages through Wednesday is the minimum requirement for the constructive case.
Wednesday Is Live, and There Is No Dot Plot to Cushion the Reaction
The Federal Open Market Committee meets July 28-29 with the statement at 2 p.m. Eastern Wednesday and a press conference at 2:30. Consensus is a hold at the 3.50% to 3.75% target range, extending a level maintained by unanimous vote in June and marking a fifth consecutive meeting without a change. A quarter-point increase would lift the range to 3.75% to 4.00% — the first hike in three years.
Pricing has whipsawed with the oil tape. Hike probability sat at 10.7% on July 15, tripled to 34.7% by July 22, printed 35.8% to 38% at Friday's close, and fell to 30.5% Monday on the ceasefire. Some readings put the hold probability as high as 85.6%. September carries the conviction: hike odds there have climbed to roughly 82%, up from 68% in late June and 52% earlier in July. Headline inflation runs near 4.1%.
Three structural features make this decision unusually hazardous for precious metals positioning. There is no Summary of Economic Projections and no dot plot; both return at the September 15-16 meeting, leaving only a statement, a vote tally and a press conference. The chair has explicitly abandoned forward guidance since taking office in June, declined to submit projections at his first meeting, and stated publicly in early July that prices are too high while dismissing tolerance for any target above 2%. And the committee is split precisely down the middle — of eighteen policymakers submitting June projections, half favoured holding or cutting and half advocated raising rates before year-end.
Gold is not trading Wednesday's number. It is trading whether the statement preserves a clear runway to September. A hold that reads as a genuine pause caps real yields and lets the metal work on $4,100 to $4,200. A hold that reads hawkish, or one pointed sentence about September, sends real yields back to last week's cycle highs and puts $4,000 back in play immediately.
The week does not stop there. Weekly ADP employment lands Tuesday, second-quarter GDP and PCE inflation Thursday, and Chicago PMI plus University of Michigan inflation expectations Friday. PCE is the second-order risk nobody is discussing.
A 27% Drawdown From January and the Worst Quarter in Thirteen Years
The scale of what gold has already given back reframes every level on the chart. The all-time high is $5,602.23, set on January 29, 2026. At roughly $4,097, gold trades approximately 27% below that record. The 52-week low is $3,311.56. Both extremes printed inside twelve months, which describes a market that has done something violent in both directions.
The second quarter delivered gold's worst quarterly performance in thirteen years. Prices fell further through the start of July, briefly slipping below $4,000 for the first time since November 2025 and triggering broad concern across both retail and institutional holders. The year-to-date reading of -5.67% understates the damage, because it measures from a January starting point that was already well below the late-January spike.
Context cuts the other way when measured from the bottom rather than the top. Gold traded near $1,560 in January 2020. At roughly $4,090 it has gained approximately 160% over six years even after this correction. The one-year return is +22.94%. This is not a broken asset; it is an asset that ran too far, too fast into January and has spent six months digesting.
Silver's correction is far deeper. It peaked at $121.67 on January 29, 2026 — the identical session gold topped — and trades at $59.43, roughly 51% below the record and down 16.39% year to date. That the two metals topped on the same day identifies the peak as a single macro event rather than metal-specific dynamics. Silver's twelve-month gain of 53.35% still comfortably beats gold's, which is the tell that its drawdown is a leverage unwind rather than a demand failure.
What caused the January top has not reversed. The new Fed chair's hawkish turn recast the entire rate outlook, converting an environment priced for cuts into one pricing hikes. Every holder who bought gold on the rate-cut thesis has been sitting on a broken position since February. That cohort is the supply overhang the market is still working through, and it explains why rallies keep failing in the same $4,100 to $4,200 zone.
Historical precedent on drawdown depth offers no clean answer here. A 27% correction is deep enough to have cleared speculative excess and shallow enough that it need not mark a durable floor.
The Level Map: $4,000 Is the Floor That Has to Hold
The technical structure is unusually clean, which is what happens when a market spends a month inside a $238 range. The $4,000 handle is the defining reference. Gold slipped beneath it in early July for the first time since November 2025, then recovered with a gain of more than 1.30% during the North American session on July 9. That sequence completed a classic role reversal: $4,000 converted from a former resistance ceiling into an active support floor, and it has held every test since.
Above it, the immediate structure runs through the moving averages gold reclaimed Monday — the 50-day EMA at $4,072 and the 100-day at $4,066. Those two lines sit almost exactly where gold is trading, which makes them the day's fulcrum rather than a distant reference. Holding above them through Wednesday keeps the short-term bias constructive. Losing them opens $4,050, and beneath that the $4,000 to $4,020 shelf.
Resistance is where the work is. The $4,100 to $4,200 zone has capped every rally in July, including last week's $4,160 spike and Monday's $4,106 tag. The one-month ceiling stands at $4,200. Clearing $4,100 on a daily close would be the first genuine structural improvement since the June breakdown; clearing $4,200 would open the gap toward the mid-$4,300s, where the June breakdown originated.
The working framework into Wednesday is straightforward: neutral-to-bullish while gold holds above $4,050, with the Fed and PCE capable of producing abrupt reversals in either direction. A sustained break above $4,100 confirms the recovery. A loss of $4,000 invalidates the role reversal and puts the $3,962 one-month low in play, then the psychologically loaded $3,900 handle.
Silver's map runs parallel but with wider bands. Resistance sits at $59.80 to $60.00, an area that rejected price on the last approach, with heavier resistance near $61.00. The metal has been trading below a descending trendline and beneath the Ichimoku cloud on recent sessions, which argues Monday's 2.26% pop is a test of the ceiling rather than a breakout. Weekly resistance extends to $63.53. The gold-silver ratio at 68.93 sits below the 70-to-100 band that has prevailed in recent years, meaning silver is not cheap relative to gold on that measure.
298 Tonnes of ETF Gold Sits Underwater, and That Is the Ceiling
The single most useful number in the gold market right now is 298. That is the approximate tonnage of gold held inside exchange-traded funds priced below its holders' average cost basis at prices around $4,000 an ounce — roughly $38 billion of metal owned by investors whose rational response to any recovery is to exit near breakeven rather than hold for upside.
That is not a sentiment observation. It is a supply mechanism. Every rally toward $4,100 walks into a wall of holders who bought the rate-cut thesis, watched it evaporate, and want out at whatever level restores them to flat. It explains why the $4,100 to $4,200 zone has capped four separate attempts this month, and why Monday's Asian-session strength failed to survive into New York.
The flow record shows the process working through. Global gold ETFs recorded net outflows of 16 metric tonnes in May, pushing total assets under management down 2% month-over-month to $604 billion. Collective holdings ticked 0.4% lower to 4,121 tonnes, remaining just below the record 4,176 tonnes reached on February 27, 2026. North America turned modestly negative, recording $1.1 billion of outflows in May, with redemptions continuing into the first half of June before a $1.1 billion inflow week snapped four consecutive weeks of selling.
June then delivered a genuine turn. Physically-backed gold ETFs globally recorded a third consecutive month of net inflows, with total fund levels reaching marks not seen since early 2024. That is a meaningful change in direction, though it has not yet cleared the underwater overhang above current prices.
The regional split explains the tension. Bullion fund investors across Asia, including China, sold roughly $3.6 billion in late May and June. Against that, local gold price premiums in China averaged 1.0% in June, the highest level since April 2025 — and the last time that premium spiked, Asian gold fund inflows rebounded sharply through the second half of 2025 to the tune of roughly $14.7 billion.
Institutional positioning is not stretched. Global gold ETF holdings remain well below their pandemic-era peak despite the second-quarter selloff, which means the rebound has room whenever the marginal buyer returns.
Central Banks Never Stopped Buying, and That Is the Floor
Set against the ETF overhang is the most reliable bid in the gold market, and it did not flinch once during the 27% drawdown. Central banks purchased a net 244 tonnes in the first quarter of 2026, up from 208 tonnes in the fourth quarter of 2025 and exceeding both the prior quarter and the five-year quarterly average. They added another 41 tonnes in May. The run-rate that anchors the structural case sits near 60 tonnes per month.
The composition matters as much as the total. Poland has accumulated 64 tonnes so far this year, adding 14 tonnes in April alone. China has added 25 tonnes to official reserves year to date, with its central bank extending a buying streak that now runs 18 consecutive months. The Czech National Bank added 2 tonnes. Uzbekistan ranks among the largest buyers. The expansion has been broad and persistent across both emerging and developed economies rather than concentrated in one or two reserve managers.
The critical behavioural point is that this buying continued uninterrupted while gold traded roughly 28% below its January peak. For reserve managers, the price decline was an operational detail rather than a disqualifying signal. Central banks buy on mandate and diversification objectives, not on momentum, which makes them the exact inverse of the ETF investor's incentive structure. ETF holders sell into strength to escape losses; sovereigns buy into weakness because the allocation target has not changed.
Forward intent is documented rather than assumed. The 2026 official-sector survey found a record 45% of central banks plan to add to their gold reserves, and 89% expect global reserves to rise over the next twelve months. Reserve managers have been explicit that the driver is diversification away from the dollar, and European official data published in June showed gold's role in global reserves continuing to expand.
This is the regime change that defines the current market. Through 2025, Western ETF buyers set the marginal price of gold. In 2026 they became net sellers, and sovereign demand became the floor. That handoff explains a market that can fall 27% without breaking, and it explains why $4,000 has held every test. It also explains why rallies stall: sovereigns provide a floor, not a bid that chases.
Read More
-
Yen Stalls at 160 Despite a 3% JGB and Tokyo Core CPI at 2.0% — Intervention Sits at 164, Friday's Payrolls Decide
02.09.2026 · TradingNEWS ArchiveEnergy
-
T-Rex 2X Inverse MSTR ($4.39) Rips 10.44% as Strategy Pauses Bitcoin Buys for a 2nd Week — $4.63 Close Opens $5.27
15.09.2026 · TradingNEWS ArchiveStocks
-
XRPR ($10.59) and XRPI ($7.04) Open at Highs and Close at Lows After Senate Kills CLARITY Act
15.09.2026 · TradingNEWS ArchiveCrypto
-
NG ($2.908) Holds Above $2.80 Low as LNG Feedgas Hits 18.8 Bcf and TTF Trades 9.2x Henry Hub
15.09.2026 · TradingNEWS ArchiveCommodities
-
USD/JPY (155.09) Faces 275bp Policy Gap as BOJ Prepares 31-Year-High Rate — Close Below 154 Opens 153.40
15.09.2026 · TradingNEWS ArchiveForex
The Sell Side Has Cut Targets by Twenty-Five Percent and Stayed Bullish
Forecast revisions this summer have been brutal in magnitude and remarkably consistent in direction, which is unusual and worth reading carefully. One major US bank cut its year-end 2026 target from $5,400 to $4,900 in June, citing the shift away from rate cuts and fading ETF inflows, and flagged that an actual Fed hike could send gold to $4,400 by year-end. Another cut its fourth-quarter target by roughly 25% on July 3, from $6,000 to $4,500, pointing to softer demand from key buying sectors and heightened sensitivity to real rates, while projecting a third-quarter average of $4,300. A major Asian bank expects gold to decline through the end of 2026 on rising Treasury yields, a stronger dollar and weaker investor demand.
What is notable is that none of these houses abandoned the structural case while cutting the number. The first retained a floor argument built on the 60-tonne-per-month sovereign run-rate and on what it calls the debasement trade — institutional demand driven by fiscal deficit concerns, a category of demand that did not exist in prior gold cycles. The second maintained long-term bullishness on central bank buying and physical demand into 2027. Both are saying the same thing: the destination is intact, the timeline moved.
The industry body's upside scenario sits at $4,500, and the identified pivot is specific. If the investors who have been selling gold ETFs since May reverse and begin re-allocating, the combination of institutional inflows plus persistent sovereign buying pushes prices meaningfully above that level. That is the entire bull case in one sentence, and it hinges on a flow reversal that June's third consecutive month of global inflows suggests may already be starting.
The dispersion across these targets — $4,300 for the current quarter, $4,400 in a hike scenario, $4,500 to $4,900 for year-end — brackets the current $4,097 print on both sides. That spread is honest. It says the outcome depends on a policy path nobody can price with confidence given a chair who has removed forward guidance from the toolkit.
Against all of it sits a simpler observation: gold at $4,097 is up 160% in six years.
Miners Are Trading Worse Than the Metal, and They Usually Lead
Gold mining equities have been the more bearish signal all summer, and the divergence deserves attention because mining stocks frequently lead the underlying metal at turning points. The VanEck Gold Miners ETF (GDX) closed Friday at $75.21 against a previous close of $75.02, having traded a $74.62 to $76.48 range, with pre-market at $75.52. Its 52-week band runs $51.37 to $117.18, and it reached $117.18 earlier in 2026 before entering a prolonged correction. Market capitalisation stands at $24.27 billion with a trailing P/E of 9.52.
The chart structure is a descending wedge. GDX has produced a sequence of lower highs while its lows drift toward a descending support line, with the two trendlines converging — price is still falling, but the distance between support and resistance keeps narrowing. Main support sits at $72 to $74, and holding above roughly $72 keeps the wedge intact. A move back through $76 to $78 shows early improvement. Buyers need $80 to $81 to repair the recent breakdown. The falling upper trendline sits around $84 to $86. Sustained trade below $72 exposes approximately $69, then the wedge's projected lower area near $66.
Junior miners are worse. The junior ETF (GDXJ) closed Friday at $97.80 against a $63.90 to $157.49 annual range, trading at 8.16 times earnings with $5.84 billion in assets. Newmont (NEM) fell 1.62% Friday to $93.19. The silver miners ETF (SIL) closed at $75.44. Physical vehicles held up better: the gold trust (GLD) closed at $371.90, up 0.10%, and the silver trust (SLV) at $52.59, up 1.02%.
The leverage relationship is what makes miners informative. A 1% decline in gold typically translates into a 2% to 4% decline in the major mining ETFs, reflecting operating leverage embedded in mine economics. When GDX, GDXJ and their Canadian counterpart all register technical sell signals while the bullion trust still shows a short-term buy, the equity market is anticipating weakness the metal has not yet expressed.
One contrarian datapoint cuts the other way. The bullish percent index for gold miners recently hit zero — a reading that has historically marked exhaustion rather than continuation. Single-digit P/E multiples across both ETFs say the same thing.
A $39.7 Trillion Debt Pile Is the Argument That Survives Every Correction
Underneath the rate-driven volatility sits the one variable moving in a single direction. Treasury data put federal debt at an all-time high of $39.7 trillion as of Friday, growing by roughly $7 billion per day. That arithmetic is the foundation of what institutions now describe as the debasement trade — a category of demand driven by fiscal deficit concerns rather than by rate expectations, and one that did not meaningfully exist in prior gold cycles.
It is the reason central banks continue accumulating at a 60-tonne monthly pace while sitting on unrealised losses from purchases made near the highs. Reserve managers are not making a directional bet on the metal. They are reducing dollar concentration in portfolios where the issuer's debt trajectory has no visible ceiling, and gold is the only reserve asset with no counterparty.
The comparison with bitcoin is instructive and unflattering to the digital alternative. Both assets are pitched as debasement hedges. In 2026 only one has behaved like one. Gold is up 22.94% over twelve months. Bitcoin trades roughly 48% below its October 2025 record and has spent the year trading as levered technology beta — selling off when oil-driven inflation forced hawkish repricing, rallying Monday on the same ceasefire that lifted equities. Gold captured the debasement flow this year. Bitcoin captured the liquidity beta.
Silver's fundamental floor operates on entirely different logic and is worth separating from the monetary argument. Industrial demand is projected above 700 million ounces in 2026 as investment in solar capacity, AI infrastructure and consumer electronics continues expanding. That demand is price-inelastic in the short run and structurally growing, which is why silver's 51% drawdown from January reflects speculative unwinding rather than any deterioration in physical consumption. Monday's 2.26% outperformance against gold is consistent with that read.
The honest limitation on the debasement case is timing. Fiscal deterioration is a multi-year force operating on a market that reprices daily against two-year yields. It sets the floor and the destination. It does not tell you whether gold trades $4,000 or $4,200 on Thursday morning, and pretending otherwise is how holders ended up 27% underwater from January.
Forecast: Neutral-to-Bullish Above $4,050, With Wednesday Setting the Direction
The base case into month-end is continued range trade between $4,000 and $4,200, with a modest upward bias while the ceasefire holds and hike odds sit at 30.5% rather than 38%. Assign that roughly 50% weight, targeting a weekly close between $4,050 and $4,150. The structure supports it: sovereign buying floors the market near $4,000, the underwater ETF overhang caps it near $4,200, and neither side has the flow to force a resolution without an external catalyst.
The bullish path requires two things in sequence. A Wednesday statement that reads as a genuine pause rather than a hawkish hold, followed by soft PCE on Thursday. That combination pushes real yields lower, clears $4,100 on a daily close, and opens the $4,200 ceiling with the mid-$4,300s above it. Assign 25%, targeting $4,200 with extension toward $4,300 — a 2.5% to 5% advance from $4,097. Silver would lead that move, testing $60.00 and then $61.00, with the gold-silver ratio compressing further below 68.
The bearish path is a hawkish hold, a pointed reference to September, or a hot PCE print. Real yields return to last week's cycle highs, the dollar recovers, and gold loses the 50- and 100-day averages at $4,072 and $4,066 in short order. That puts $4,050 then $4,000 in play, and a break of the role-reversal floor exposes the $3,962 one-month low. Assign 25%, with $4,000 the realistic objective — 2.4% lower. A confirmed break below $4,000 would target $3,900 and would likely be preceded by GDX losing $72.
The trigger checklist is short. The two-year yield in combination with the dollar, not gold's first-minute reaction to the statement. Thursday's PCE, which carries more risk than the decision itself given the absence of new projections. Whether $4,100 converts from resistance to support on any test. Whether ETF flows extend June's third consecutive month of global inflows or resume the May pattern. And whether the Iran hold-fire survives the week, given Houthi activity continued through it.
Calendar: weekly ADP Tuesday, FOMC Wednesday at 2 p.m. with the press conference at 2:30, second-quarter GDP and PCE inflation Thursday, Chicago PMI and University of Michigan inflation expectations Friday. Four separate opportunities for a $238 range to break.