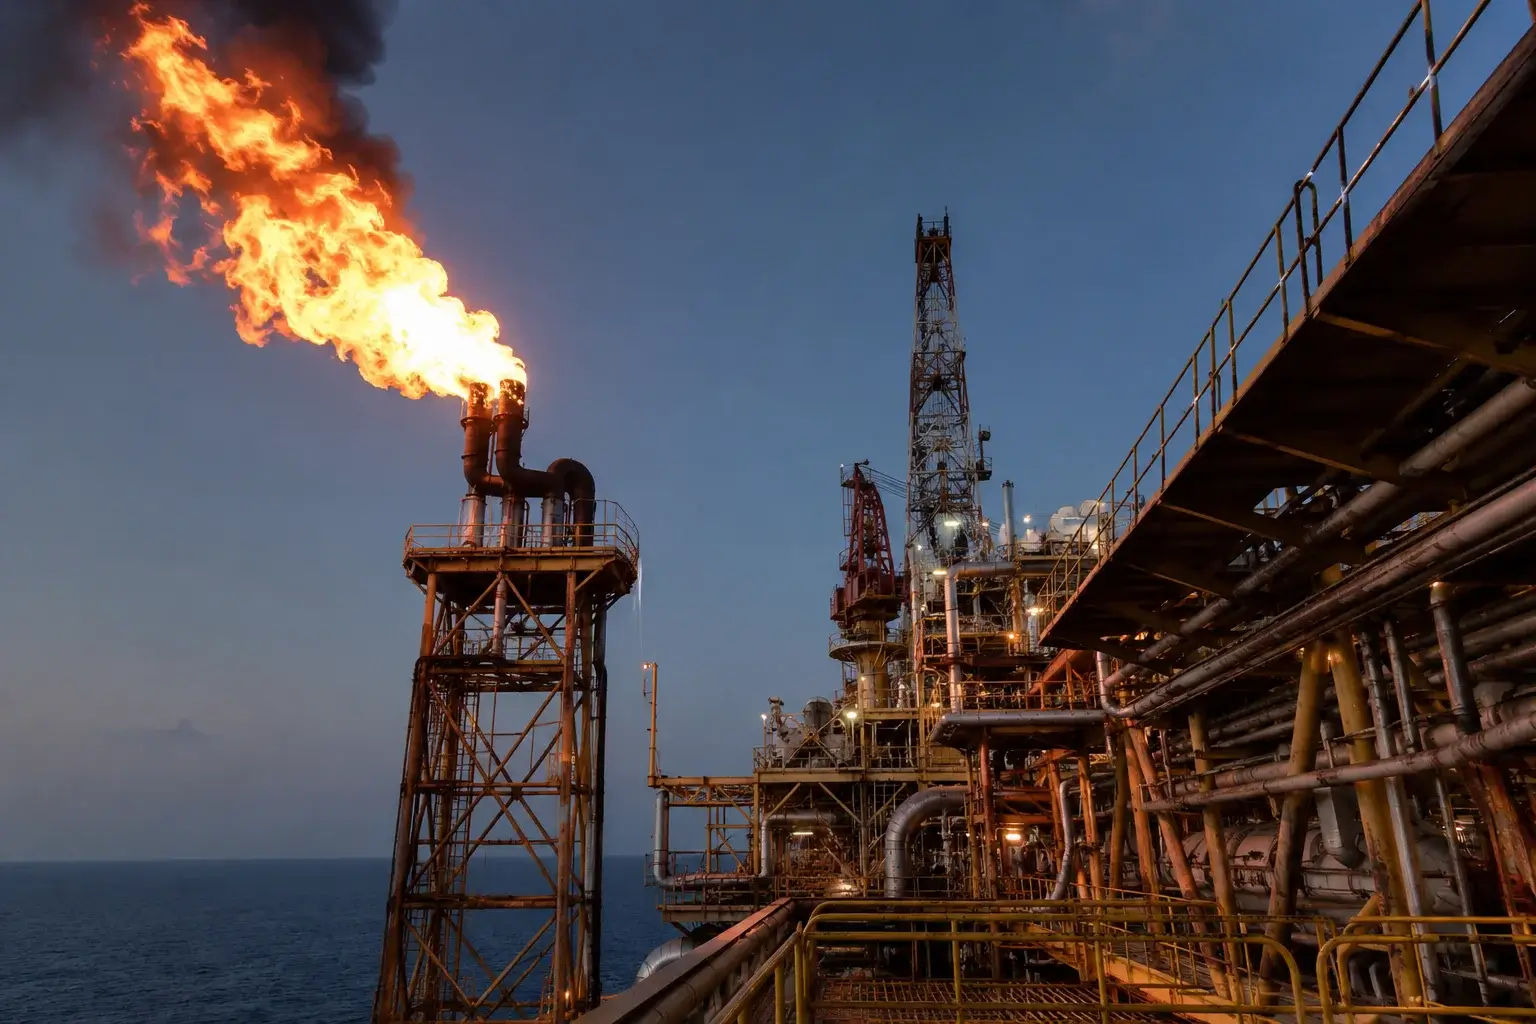
Natural Gas Grinds at $3.23 as Ample Storage Caps Summer While December Futures Above $4 Bet on Winter
NG front-month holds near $3.23/MMBtu, a fraction of January's record $7.72, as production around 109 bcfd | That's TradingNEWS
Key Points
- NG front-month near $3.23/MMBtu, down 19% YoY, range-bound after crashing from January's record $7.72.
- LNG feedgas slipped to 17 bcfd on maintenance and production holds ~109 bcfd; EIA pegs 2H26 at $3.34.
- December futures above $4 price the winter bull case; bull/bear scenarios span $2.00 to $8.00 on weather.
Natural gas is stuck in a holding pattern. The NYMEX front-month contract is trading near $3.23/MMBtu, having risen for a third consecutive session on a rebound in LNG export activity after touching a three-week low near $3.00 earlier in the week. The price sits in a tight $3.22–$3.30 band, down roughly 19% over the past year, and the range reflects a market caught between a bearish summer-shoulder setup and the winter premium that's keeping December futures above $4.
The contrast with the start of the year is staggering. Henry Hub hit a monthly average record of $7.72/MMBtu in January 2026 — the highest ever recorded — as a polar vortex drove record storage withdrawals of 2,020 Bcf over the heating season. Prices then crashed below $3 by mid-March as mild spring weather returned, storage normalized, and new LNG export capacity came online. The front-month at $3.23 is a fraction of January's record, and the round-trip captures natural gas's defining characteristic: weather-driven volatility around a supply-demand balance.
The current setup is a shoulder-season standoff. Production around 109 bcfd is outpacing demand, LNG feedgas has dipped to 17 bcfd on seasonal maintenance, and storage is comfortable heading into summer — all bearish for the front month. But December futures above $4 reflect the market's expectation that winter reasserts the bull case, the same dynamic that drove January to $7.72. The front of the curve is heavy; the back of the curve is bid.
The one-line thesis for the forecast: natural gas is range-bound near $3.23, caught between a bearish summer setup of ample storage and production outpacing demand, and a winter premium baked into December futures above $4 — with the near-term swing factors being a Texas tropical storm, the LNG maintenance recovery, and summer cooling demand, while the structural question is whether winter reasserts the bull case toward $5-8 or a mild winter caps it at $2-2.80.
The setup is a commodity grinding sideways at $3.23, its direction set by weather and storage rather than any single macro catalyst. The front month is heavy; the curve bets on winter.
The Round-Trip From January's Record $7.72
To understand where natural gas sits, follow the extraordinary arc it's traced this year. Henry Hub averaged a record $7.72/MMBtu in January 2026 — the highest monthly average ever recorded — as a polar vortex drove demand to extremes and pulled a record 2,020 Bcf out of storage over the heating season. That spike was a genuine supply-demand shock: bitter cold met a market with LNG exports already running near capacity, leaving little margin for error and sending prices to records.
The crash was just as dramatic. By mid-March, prices had collapsed below $3/MMBtu as mild spring weather returned, heating demand evaporated, storage normalized, and new LNG export capacity from Golden Pass and Corpus Christi Stage 3 began adding to the supply-demand balance. The round-trip from $7.72 to below $3 in roughly two months is the textbook natural gas pattern — violent weather-driven spikes that reverse the moment the weather normalizes.
The longer history shows this is the norm, not the exception. Henry Hub traced an extraordinary path since the pandemic low of $1.63/MMBtu in June 2020 — rising through the post-COVID recovery, spiking to a 14-year high of $9.85/MMBtu in August 2022 on Russia-Ukraine supply fears, crashing below $2 in early 2023, recovering through the 2024 LNG export ramp, and now executing another dramatic round-trip from below $2 in early 2024 to $7.72 in January 2026 and back below $3 by spring. Natural gas is the most volatile major commodity, and its history is a series of these arcs.
The current level reflects the post-spike normalization. At $3.23, natural gas has settled into the range that the summer-shoulder fundamentals support — well above the pandemic lows but a fraction of the January record, in the zone where ample storage and steady production meet moderate summer demand. The front month has found its equilibrium for the season, while the curve prices the next potential spike.
For the forecast, the round-trip frames the volatility risk. Natural gas at $3.23 is in a calm phase, but the January record proves how violently it can move when weather turns — and the December futures above $4 reflect the market's memory of that spike. The front-month range is a temporary equilibrium that the next weather event could shatter, in either direction. The arc from $7.72 to $3.23 is the warning: this market doesn't stay calm for long.
The Summer-Shoulder Bearish Setup
The fundamentals pressuring the front month are seasonal and structural, and they tilt bearish. The shoulder season — the period between winter heating demand and peak summer cooling demand — typically sees natural gas at its weakest, and 2026 fits the pattern. Storage is comfortable after the spring normalization, production is robust, and demand hasn't yet ramped to summer peaks, leaving the front month heavy.
Production is the structural weight. US Lower 48 dry gas production has been running around 109.3 bcfd in June, easing slightly from 109.7 bcfd in May but holding at high levels — and some forecasts see production climbing toward 118+ bcfd. Rising crude oil prices drive crude production higher, which generates growth in associated natural gas production as a byproduct, adding supply regardless of gas-specific economics. That production growth is outpacing demand, which is the core bearish factor capping the front month.
The storage picture supports the bearish read. After the record withdrawals of the polar-vortex winter, storage normalized through the mild spring, leaving inventories comfortable heading into summer. A market with ample storage and production outpacing demand has little reason to rally in the shoulder season — the supply cushion absorbs demand spikes, and prices stay range-bound until either a weather event or a structural demand increase shifts the balance.
The supply-demand framing is the EIA's central case. The agency expects natural gas prices to remain relatively flat in 2026 as supply growth outpaces demand, with the Henry Hub spot price averaging about $3.34/MMBtu in the second half of 2026 — close to the current $3.23 level. The flat forecast reflects the standoff: rising demand from electricity generation and LNG exports is offset by the production growth, leaving prices range-bound around $3.
For the forecast, the summer-shoulder setup is the bearish anchor for the front month. Production around 109 bcfd outpacing demand, comfortable storage, and the seasonal lull keep the front contract heavy near $3.23. The EIA's $3.34 forecast for 2H26 reflects this balance — flat prices as supply meets demand. The bearish setup caps the upside until a catalyst shifts the balance; the question is what that catalyst is.
LNG Export Demand and the Maintenance Dip
The single most important structural demand driver for US natural gas is LNG exports, and the current picture is a temporary dip within a growth trend. Average gas deliveries to the nine major US LNG export facilities slipped to 17.0 bcfd so far in June, down from higher levels, due to seasonal maintenance at several sites — including ExxonMobil and QatarEnergy's Golden Pass facility and Freeport LNG in Texas. The maintenance dip is a near-term bearish factor that's pressured the front month.
The LNG growth story is the structural bull case. US LNG export capacity has been ramping for years, with Golden Pass and Corpus Christi Stage 3 adding capacity in early 2026, and feedgas demand of 17+ bcfd represents a massive, growing call on US production. Every cubic foot exported as LNG is gas removed from the domestic market, tightening the balance — and the long-term trajectory is for LNG demand to keep rising as new terminals come online. The maintenance dip is a pause, not a reversal.
The rebound is already underway. The third consecutive session of gains to $3.23 was supported by signs of a rebound in LNG export activity as maintenance at some facilities wound down — the feedgas recovering toward higher levels. That recovery is the near-term bullish factor offsetting the bearish production and storage picture, and the pace of the LNG rebound is one of the key swing variables for the front month over the coming weeks.
The global LNG context adds a wrinkle. QatarEnergy is ready to resume LNG production at Ras Laffan quickly and reach full production within a month, while higher US LNG production is helping but cannot fully replace Qatari supplies for Europe — dynamics tied to the Middle East situation that affect global gas balances. The interplay between US exports, Qatari supply, and European demand shapes the global pull on US gas, which feeds back into the domestic price.
For the forecast, LNG is the structural demand engine and the near-term swing factor. The dip to 17 bcfd on maintenance pressured the front month, but the rebound is the bullish offset, and the long-term growth in export capacity is the structural support. The pace of the maintenance recovery and the global LNG dynamics — including the Qatari resumption — are the variables to watch. LNG is the bull case's foundation; the maintenance dip is a temporary headwind.
The Winter Premium in December Futures
The clearest expression of the market's structural view sits at the back of the curve. While the front month trades near $3.23, December 2026 futures hold above $4 — a premium that reflects the market's expectation that winter will reassert the bull case. The curve is in contango, with the winter contracts pricing the risk of another cold-weather demand spike like the one that drove January 2026 to its record.
The premium is the market's memory of January. The polar vortex that pushed Henry Hub to $7.72 and drove record withdrawals of 2,020 Bcf is fresh in the market's mind, and the December futures above $4 price the possibility of a repeat. With LNG exports running near capacity and leaving little margin for error, even a normal winter draws storage down hard, and a cold one could trigger the same dynamic that produced the record. The curve is pricing that asymmetric winter risk.
The contango structure shapes the trade. The gap between the $3.23 front month and the $4+ December contract reflects the seasonal demand pattern — gas is cheap in the shoulder season and expensive in winter — and it's a structural feature of the natural gas curve. The premium isn't a prediction of where the front month goes; it's the market pricing the seasonal demand swing and the risk that winter tightens the balance dramatically. The curve bets on winter every year.
The storage trajectory into winter is the key variable. If the summer's production growth and the LNG maintenance keep storage building above the five-year average through the injection season, the market enters winter with a cushion that suppresses the December premium. If summer cooling demand and the LNG rebound draw storage down toward or below the five-year average, the winter setup tightens and the December premium could prove conservative. The path of storage through the summer determines whether the winter bull case materializes.
For the forecast, the December premium above $4 is the structural bull signal embedded in the curve. The market expects winter to tighten the balance, and the front-month weakness at $3.23 is a seasonal phenomenon that the curve looks past. The trade is the spread between the heavy front month and the bid winter contracts, and the storage trajectory through summer decides whether the winter premium is too high or too low. The front is bearish; the curve is bullish on winter.
The Texas Tropical Storm and Weather
The single largest driver of short-term natural gas price moves is temperature, and a near-term weather catalyst is brewing. A tropical storm was expected to form off the Texas coast — a development that matters for natural gas because the Gulf Coast is the heart of US production, LNG export infrastructure, and gas-fired power demand. A tropical system can cut both ways for prices, which is why the market is watching it closely.
The bearish weather angle is demand destruction and supply disruption's offset. A tropical storm that knocks out LNG export terminals or industrial demand along the Gulf Coast reduces the call on gas, which is bearish — if a storm forces Golden Pass, Freeport, or other Texas facilities offline, the feedgas demand that supports prices vanishes temporarily. The Gulf Coast's concentration of LNG capacity means a storm hitting the region directly affects the export demand that's been propping up the front month.
The bullish weather angle is production disruption and heat. A storm that disrupts Gulf production cuts supply, which is bullish, and the broader summer heat pattern drives cooling demand. Above-average temperatures this summer are forecast to contribute to a 3% increase in US electricity generation compared with the summer of 2025 — and gas-fired power is a major component of that generation. Hot weather that drives air-conditioning demand pulls gas into power burn, which is the bullish summer demand factor.
The net effect depends on the storm's path and intensity. A storm that primarily disrupts LNG exports is net bearish (demand loss outweighs supply loss); one that primarily disrupts production is net bullish (supply loss outweighs demand loss); and one that brings heat in its wake could boost cooling demand. The uncertainty is why the market is watching — the storm is a near-term wildcard that could move the front month sharply in either direction once its path clarifies.
For the forecast, the Texas tropical storm is the immediate weather catalyst layered on the summer demand picture. Temperature is the dominant short-term driver, and a Gulf Coast storm affects production, LNG exports, and power demand simultaneously. The net price impact depends on the storm's path, making it a genuine near-term swing factor. The weather is the wildcard; the storm is the immediate one to watch.
Summer Cooling Demand and Power Burn
The seasonal demand story that could tighten the balance is summer cooling, and the setup is supportive. Above-average temperatures this summer are forecast to drive a 3% increase in US electricity generation compared with the summer of 2025 — and natural gas is the largest source of US power generation, which means hot weather translates directly into higher gas demand through power burn. The summer heat is the bullish seasonal factor offsetting the bearish production picture.
The power-burn mechanism is the key demand channel. When temperatures rise, air-conditioning load spikes, utilities ramp gas-fired power plants to meet the demand, and gas consumption for electricity generation surges. A hot summer can pull enough gas into power burn to draw down storage faster than the injection season builds it — which tightens the balance heading into winter and supports prices. The forecast for above-average temperatures and 3% higher generation is the bullish demand signal.
The structural electricity demand growth adds to it. Beyond the seasonal heat, US electricity demand is rising structurally — driven in part by data centers and the AI buildout that's straining the power grid — and natural gas is a primary fuel for meeting that growing baseload and peaking demand. The EIA's forecast cites rising natural gas demand for electricity generation as a factor putting upward pressure on prices in the second half of 2027. The power-demand story is a multi-year structural tailwind.
The cooling demand is the swing factor for storage. If the summer runs hot and power burn is strong, storage builds more slowly through the injection season, leaving less cushion for winter and supporting the December premium. If the summer is mild, storage builds comfortably above the five-year average, suppressing both the front month and the winter premium. The summer temperature pattern is the bridge between the current shoulder-season weakness and the winter setup.
For the forecast, summer cooling demand is the seasonal bull factor that could tighten the balance. The forecast for above-average temperatures and 3% higher generation supports power burn, which draws down storage and supports prices. Combined with the LNG export demand and the structural electricity growth, it's the demand side of the equation pushing against the bearish production. The summer heat is the near-term bull case; the storage trajectory it produces sets up winter.
The EIA Forecast and the Supply-Demand Balance
The official supply-demand framework comes from the EIA, and it points to flat prices through 2026. The agency expects the Henry Hub spot price to average about $3.34/MMBtu in the second half of 2026 and $3.55/MMBtu in the second half of 2027 — modest levels close to the current $3.23, reflecting a balanced market where supply growth offsets rising demand. The forecast captures the standoff between the bullish demand drivers and the bearish production growth.
The supply side is the EIA's bearish factor. Rising crude oil prices drive crude production higher in the agency's forecast, which results in growth in associated natural gas production — gas produced as a byproduct of oil drilling, regardless of gas economics. That associated production growth, combined with the dedicated gas production, keeps supply ample and caps prices. The agency's view is that supply growth outpaces demand in 2026, which is why it sees prices remaining relatively flat.
The demand side is the EIA's bullish factor. Rising natural gas demand for electricity generation — driven by the summer heat and the structural power-demand growth — and ongoing growth in US LNG exports put upward pressure on prices, particularly in the second half of 2027. The agency sees demand catching up to supply over time, which is why its 2H27 forecast of $3.55 is higher than its 2H26 forecast of $3.34. The demand growth is the slow-building bull case.
The balance is the key insight. The EIA's flat 2026 forecast reflects a market where the bullish demand (power burn, LNG exports) and the bearish supply (associated production growth) roughly offset, holding prices near $3. The forecast doesn't capture the weather-driven volatility — a cold winter or a hot summer could push prices well above the average — but it frames the central tendency around which the volatility oscillates. The balance is flat; the weather is the swing.
For the forecast, the EIA framework anchors the central case. A balanced market with supply growth offsetting demand growth supports prices around $3.34 in 2H26, close to the current $3.23. The weather drives the deviations — a cold winter toward the bull scenario, a mild one toward the bear scenario — but the structural balance is flat. The EIA's forecast is the base case; the weather scenarios are the tails.
The Technical Map
The chart reflects the range-bound consolidation. The front-month contract at $3.23 has been trading in a tight band, with the recent session range of $3.22–$3.30 capturing the consolidation. The third consecutive session of gains to $3.23 came after a bounce off the three-week low near $3.00, suggesting the $3.00 level is acting as near-term support. The 52-week range of $2.483 to $7.827 frames the broader context — the front month sits in the lower-middle of its annual range.
The support structure is layered below. The $3.00 psychological level is the immediate support, reinforced by the recent three-week low, with the $2.80 level the next reference and the 52-week low of $2.483 the structural floor. The bear/warm-winter scenario targets the $2.00–$2.80 zone, which would require storage building well above the five-year average. As long as the front month holds above $3.00, the consolidation stays intact.
The resistance is overhead. The recent session high near $3.30 is the immediate ceiling, with the higher congestion from the spring and the move toward $4 (where December futures trade) the broader targets. A break above $3.30 on strong LNG rebound or summer heat would open the path toward higher levels, while the winter premium suggests the upside builds as the calendar moves toward the heating season. The front month's resistance is capped by the ample summer supply.
The technical signals have been constructive near-term. Some technical readings show a buy signal on the third consecutive session of gains, reflecting the LNG rebound and the bounce off $3.00. But the broader range-bound structure and the bearish summer fundamentals temper the bullishness — the front month is consolidating, not trending, and the next directional move depends on the weather and storage rather than the chart alone.
For the forecast, the technical map frames the range. The $3.00 support and the $3.30 resistance are the near-term boundaries, with $2.483 below and the $4 winter contracts above as the extended references. A hot summer or strong LNG rebound pushes toward $3.30 and higher; a mild summer or LNG maintenance extension pressures toward $3.00 and $2.80. The range is defined by the fundamentals, and the weather is the catalyst that breaks it.
Read More
-
VOO Sits at $691 Near Record Highs as the Market-in-One-Ticker Meets the Fed With the S&P 500 Eyeing 8,000
17.06.2026 · TradingNEWS ArchiveStocks
-
XRP ETF Complex Holds $1.44 Billion as a Second Positive Week and an Absorbed Goldman Exit Meet the Fed
17.06.2026 · TradingNEWS ArchiveCrypto
-
Oil Crude Cracks to 3-Month Lows at $76 as Friday's Iran Deal Threatens to Flood the Market With Stranded Barrels
17.06.2026 · TradingNEWS ArchiveCommodities
-
Yen Clings to 160 After the BoJ's Historic Hike to 1% Falls Flat, Leaving Intervention and the Fed to Decide the Next Move
17.06.2026 · TradingNEWS ArchiveForex
The Iran Deal and the Energy-Complex Spillover
Natural gas got caught in the broad energy-complex move on the US-Iran peace deal, though it's more weather-driven than oil-driven. US natural gas prices fell 2% to around $3.00/MMBtu — their lowest in nearly three weeks — tracking broader declines across energy markets following the US-Iran peace deal, before recovering on the LNG rebound. The spillover was real but secondary to the gas-specific fundamentals.
The oil connection runs through substitution and sentiment. Cheaper oil prices affect natural gas, which is positioned as a viable energy alternative to crude in some applications, and the broad energy-complex sentiment moves the whole sector together on geopolitical catalysts. When the Iran truce sent oil cratering 40% from its conflict peak, the bearish energy sentiment bled into natural gas, pushing it to the three-week low. But the connection is weaker than for oil itself — gas trades on weather and storage, not geopolitics.
The global LNG dimension is where Iran matters more directly. The Middle East situation affects global LNG balances — QatarEnergy's readiness to resume full production at Ras Laffan within a month, and the dynamic of higher US LNG production helping but not fully replacing Qatari supplies for Europe, are tied to the regional situation. A normalization of Qatari LNG flows would add global supply, which is a bearish factor for the global gas market and indirectly for US export economics.
The decoupling is the key point for US gas. Unlike oil, which is driven by the Iran supply story, US natural gas is fundamentally a domestic weather-and-storage market — the Henry Hub price reflects US production, US storage, US power demand, and US LNG exports, not the Strait of Hormuz. The Iran spillover pushed gas to a three-week low, but the recovery on the LNG rebound shows the gas-specific fundamentals reasserting themselves. The Iran deal is a sentiment factor, not a driver.
For the forecast, the Iran spillover is a secondary factor that's already largely played out. The peace deal pushed gas to $3.00, but the LNG rebound and the weather fundamentals are reasserting control, lifting the front month back to $3.23. US natural gas is decoupled from the oil-driven Iran story — its catalysts are the Texas storm, the LNG maintenance recovery, summer heat, and storage. The Iran deal moved gas briefly; the fundamentals drive it.
The Producers: EQT, Chesapeake, Coterra, and Cheniere
The natural gas equity complex offers leveraged exposure to the price, and the producers' positioning reflects the market dynamics. EQT, one of the largest US natural gas producers, is a pure-play bet on Henry Hub prices — its earnings move directly with the gas price, giving it leverage to both the summer weakness and the winter premium. A move toward the bull scenario lifts EQT sharply; the bear scenario pressures it.
Chesapeake and Coterra are the other major producers. Chesapeake, a leading independent gas producer, and Coterra, with significant gas exposure alongside oil, are both leveraged to the Henry Hub price and the production economics. The producers benefit from the structural demand growth — LNG exports and power burn — but face the headwind of the production growth that's capping prices. Their stocks trade as leveraged proxies for the gas price and the winter setup.
Cheniere is the LNG export play. As the largest US LNG exporter, Cheniere benefits from the structural growth in export capacity and the global demand for US gas — its business is the feedgas demand that supports Henry Hub prices. The LNG maintenance dip to 17 bcfd is a near-term headwind for the export volumes, but the long-term growth in capacity is the structural tailwind. Cheniere is the way to play the LNG export thesis rather than the front-month price.
The leveraged ETFs offer tactical exposure. The natural gas ETFs that track the front-month price provide direct exposure, while the leveraged long and short ETFs amplify the moves — tactical tools for the range trade or the winter bet. The producers and the ETFs span the spectrum from leveraged price exposure to structural LNG growth, giving the complex multiple ways to express a view on the gas market.
For the forecast, the producers reflect the bull-bear debate. EQT, Chesapeake, and Coterra are leveraged to the Henry Hub price — bullish if winter reasserts the $5-8 case, bearish if a mild winter caps prices at $2-2.80. Cheniere is the structural LNG growth play, benefiting from the export demand regardless of the front-month swings. The complex offers leveraged exposure to whichever scenario plays out, with the producers tracking the price and Cheniere tracking the export thesis.
The Forecast Split: Bull and Bear Winter Scenarios
The forecast for natural gas comes down to winter, and the scenarios span a wide range. The bull/cold-winter case, assigned roughly 25% probability, sees prices reaching $5.00–$8.00/MMBtu — driven by an early or severe winter that draws storage below the five-year average by November, triggering the same dynamic that pushed January 2026 to $7.72. With LNG export demand of 17+ bcfd leaving little margin for error, a cold winter could revisit January's record zone, and Morgan Stanley's $5/MMBtu structural target would be reached.
The bear/warm-winter case, assigned roughly 20% probability, sees prices at $2.00–$2.80/MMBtu — a mild winter that leaves storage at or above the five-year average into spring 2027, suppressing any fourth-quarter price recovery. Production at 118+ bcfd and LNG maintenance seasonality keep supply comfortable, and without the cold-weather demand spike, prices drift lower. The bear case is the mirror image of the bull: warm weather and ample supply cap the price.
The base case is the EIA's flat forecast. With the bull and bear scenarios at roughly 45% combined probability, the remaining majority falls to a base case of prices around $3.34 in 2H26 — a balanced market where supply growth offsets demand growth and the weather is normal. December futures above $4 reflect a blend of the base case and the cold-winter risk, pricing the seasonal premium plus the asymmetric upside from a potential cold snap.
The asymmetry favors the upside on a probability-weighted basis. The bull case ($5-8) has a higher probability (25%) and a larger magnitude than the bear case ($2-2.80, 20%), reflecting the asymmetric risk that LNG exports running near capacity create — the supply cushion is thin enough that a cold winter triggers an outsized spike, while a warm winter only modestly suppresses prices. That asymmetry is why the December futures hold above $4 despite the front-month weakness.
For the forecast, the scenario split centers on winter weather. The bull case is a cold winter toward $5-8, the bear case is a mild winter toward $2-2.80, and the base case is flat around $3.34. The probability-weighted outcome tilts modestly bullish given the thin supply margin and the LNG demand, which is why the curve prices a winter premium. The front month is range-bound; the forecast is a bet on winter.
Scenarios and the Levels That Decide
The forecast resolves into a near-term range trade and a structural winter bet. Near-term, the front month at $3.23 is bounded by $3.00 support and $3.30 resistance, with the swing factors being the Texas tropical storm, the LNG maintenance recovery, and summer cooling demand. A strong LNG rebound or a hot summer pushes toward $3.30 and higher; a mild summer or extended LNG maintenance pressures toward $3.00 and the $2.80–$2.483 support zone.
The structural winter bet is the bigger trade. December futures above $4 price the winter premium, and the storage trajectory through summer determines whether that premium proves conservative or expensive. If summer power burn and LNG exports draw storage down toward the five-year average, the winter setup tightens and the bull case toward $5-8 comes into play. If storage builds comfortably above the five-year average, the bear case toward $2-2.80 gains probability and the December premium compresses.
The catalysts to watch in sequence: the Texas tropical storm is the immediate weather wildcard — its path determines whether it's net bearish (LNG disruption) or bullish (production disruption, heat). The weekly EIA storage report tracks the injection pace and the five-year-average comparison. The LNG feedgas recovery from the 17 bcfd maintenance dip signals the export demand trajectory. And the summer temperature pattern drives the power burn that sets the storage trajectory into winter.
The Fed is largely irrelevant to gas. Unlike oil, which got swept into the Iran-driven energy complex, and unlike the equity and crypto markets pinned on the dot plot, natural gas is a domestic weather-and-storage market that trades on its own fundamentals. The 2 PM Fed decision affects the broad risk tone and the dollar, with minor spillover to the energy complex, but the gas price is set by the Texas storm, the LNG rebound, the summer heat, and the storage trajectory — not the dot plot.
The structural backdrop stays constant: production around 109 bcfd outpacing demand, LNG feedgas recovering from the 17 bcfd maintenance dip, comfortable storage heading into summer, and December futures above $4 pricing the winter premium. The summer fundamentals are bearish for the front month; the winter setup is the structural bull case. The weather decides which scenario plays out.
The bottom line for the forecast: natural gas at $3.23 is range-bound, caught between a bearish summer setup of production outpacing demand and ample storage, and a winter premium baked into December futures above $4 — with the near-term swing factors being the Texas tropical storm, the LNG maintenance recovery, and summer cooling demand. The EIA pegs 2H26 at $3.34, close to the current price. The bull/cold-winter case targets $5-8, the bear/warm-winter case targets $2-2.80, and the base case is flat. The front month is heavy; the curve bets on winter; and the weather is the catalyst that decides.