OPEC+ Output Fell 9.64M Barrels a Day and the Quota Hikes Are Paper — This Market Has No Middle Ground
The EIA's $74 third-quarter Brent forecast assumed a June deal that never held | That's TradingNEWS
Key Points
- WTI trades $80.42, up 2.86%, clearing the $78.00 level it had repeatedly failed at.
- OPEC+ output collapsed to 33.13 million bpd in May from 42.77 million in February.
- Brent holds a $13 risk premium over the $70-$72 pre-war baseline it touched on July 1.
Crude is higher across the board Monday and the move accelerated through the session. Brent for October delivery opened near $83.48, climbed to $84.39 by 0424 GMT on a gain of 84 cents, reached $84.70 by 7:18 a.m. ET, and is marked at $84.18 on the benchmark CFD, up 0.75% on the day. September WTI moved from $78.77 through $79.31 and is marked at $80.42, an advance of 2.86%. Over the past month Brent has gained 1.05% and WTI 2.91%. Year-over-year both are up roughly 26%.
The forecast here rests on a structural point that the daily price action obscures. This market is not trading a supply-demand balance. It is trading a binary political outcome, and the distribution around that outcome is bimodal rather than normal.
Consider what has happened in seven months. Brent opened 2026 near $62 a barrel. It reached a four-year high near $120 in March after U.S. and Israeli strikes on Iran at the end of February closed the Strait of Hormuz. It peaked at $138 on April 7 and averaged $117 for that month. Following a June 18 memorandum of understanding between Washington and Tehran, it collapsed below $70 by July 1 — approximately where it traded before the war began. Renewed strikes in mid-July pushed it back toward $84.50, and it has stayed there.
That is a $76 round trip in a single benchmark inside seven months. No inventory cycle produces that. Only a waterway does.
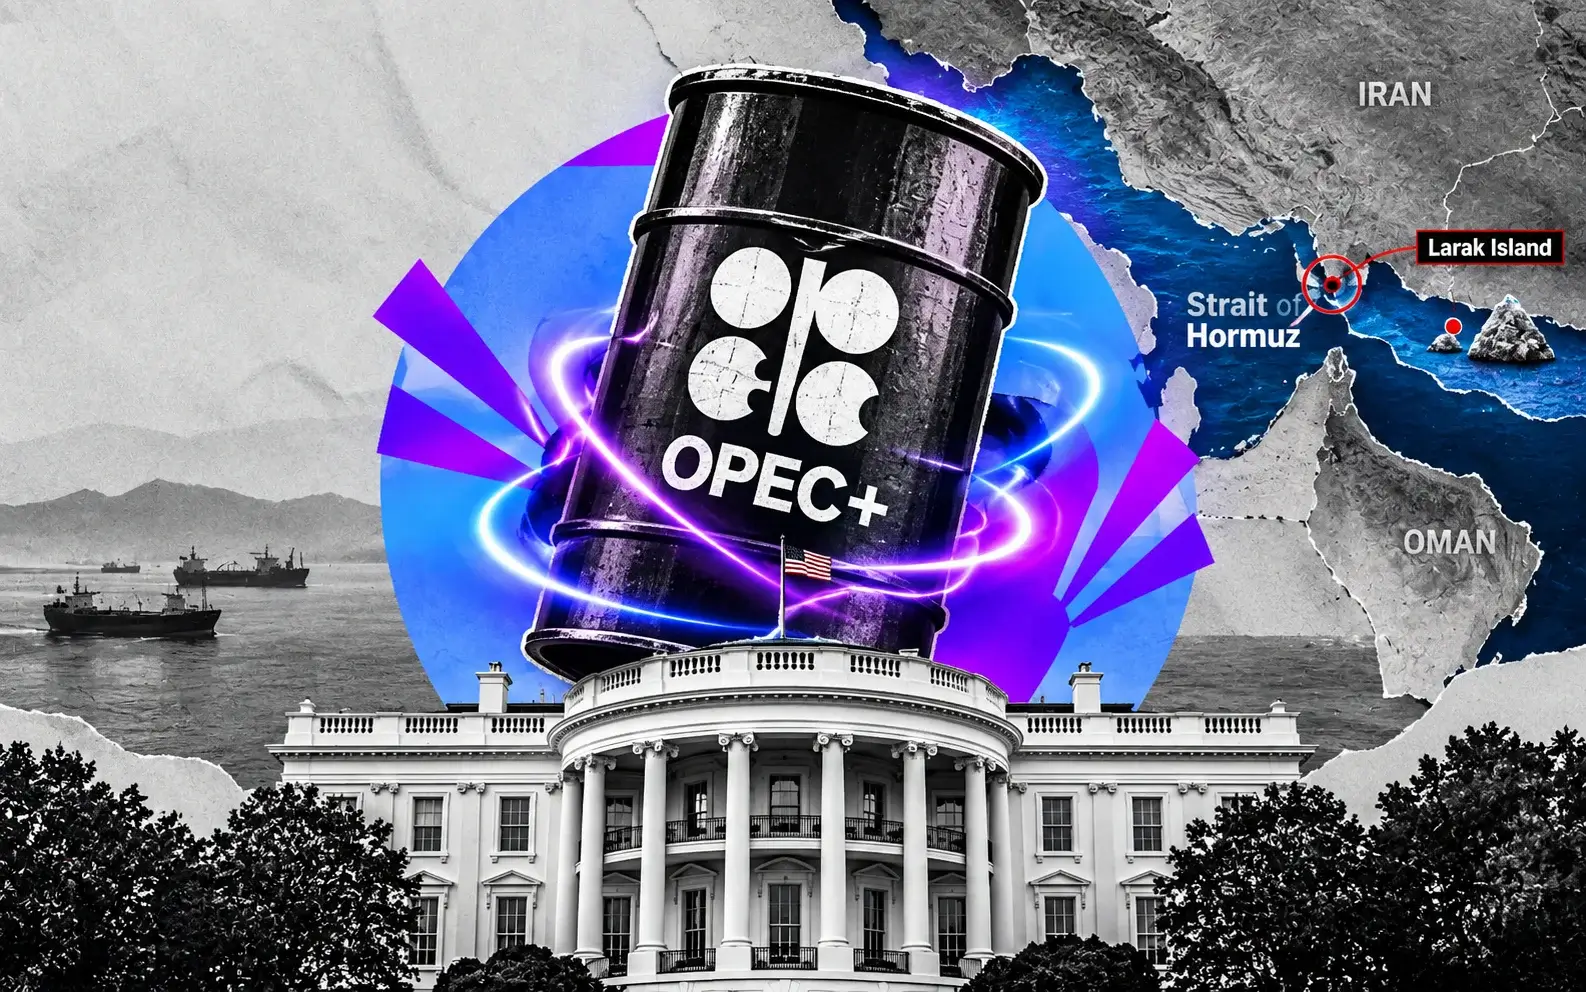
The waterway remains shut. Iran confirmed Sunday that a transit agreement with Oman on new shipping lanes is in its final stages while insisting the strait reopens only after Washington meets six conditions. Both benchmarks fell more than 7% last week on deal optimism and reversed it Monday when the optimism faded. Brent sits roughly 16% above pre-war levels, which is the market's estimate of the remaining risk premium.
Everything below develops one thesis: with 9.6 million barrels per day of OPEC+ output displaced and 800,000 bpd of quota increases sitting on paper, the resolution of Hormuz determines whether crude trades $65 or $100 — and there is very little probability mass between them.
The Numbers Behind the Closure: OPEC+ Output Fell From 42.77 to 33.13 Million Barrels
The single most important statistic in the oil market this year has received remarkably little attention, and it defines the upside and downside tails simultaneously.
OPEC+ crude output fell to 33.13 million barrels per day in May 2026, down from 42.77 million bpd in February, according to the group's own data. That is a decline of 9.64 million bpd — roughly 22.5% of the alliance's production — removed from the market in three months.
The mechanism was not policy. It was geography. The war effectively blocked the Strait of Hormuz from the end of February, cutting exports from Saudi Arabia, Kuwait, Iraq and the United Arab Emirates. Those are the producers whose barrels physically transit the waterway, and no amount of production capability matters when the tankers cannot sail.
Understand what that means for the forecast in both directions.
On the bullish side, it explains why Brent reached $138. Losing nearly 10 million bpd from a market consuming roughly 103 million bpd is a supply shock without modern precedent — larger in absolute terms than the 1973 embargo or the 1979 Iranian revolution. The fact that Brent trades at $84 rather than $200 is itself remarkable and reflects both demand destruction and drawdown of accumulated inventory.
On the bearish side, it defines the flood. Every one of those barrels remains producible. Long-term damage to oil production in the Gulf region is believed to be minimal — the wells, the gathering systems and the export terminals are intact. The constraint is a shipping lane. When that lane opens, supply does not return gradually in response to price signals. It returns as fast as tankers can be loaded.
Evidence for the speed already exists. Following the June 17 memorandum, Saudi Arabia more than doubled its shipping volume in the period since compared with the prior three months combined, and Iran pushed close to 50 million barrels of crude to market once the naval blockade eased. That is what a partial reopening produced in weeks.
A full reopening releases the balance of 9.6 million bpd into a market that OPEC+ has simultaneously authorised to produce more. That combination is why the downside scenario is not a gentle drift toward $75 but a break toward $65.
OPEC+ Just Approved Another 188,000 Barrels That Cannot Be Delivered
The alliance's quota decisions have become an exercise in paper accounting, and the accumulated paper is the loaded spring beneath this market.
Seven OPEC+ countries — Saudi Arabia, Russia, Iraq, Kuwait, Kazakhstan, Algeria and Oman — met virtually on August 2 and decided to implement a production adjustment of 188,000 barrels per day for September, drawn from the additional voluntary adjustments originally announced in April 2023. The group noted the measure provides an opportunity for participating countries to accelerate their compensation for prior overproduction.
That September increase follows an identical 188,000 bpd increase for August agreed on July 5, and similar increases for June and July. Across April through July the seven core members raised quotas by almost 800,000 bpd. Before that, April and May each carried 206,000 bpd increases, with the April decision taken on March 1 — one day after the initial strikes on Iran.
The increases have remained largely on paper precisely because the war closed the strait for the members that needed it. Analysts described the April hike as representing less than 2% of the supply disrupted by the Hormuz closure. Raising a quota for a producer whose export terminal cannot dispatch cargoes is a statement of intent, not an addition of barrels.
Two structural developments compound this. The United Arab Emirates has departed OPEC+ as a core member, removing one of the group's largest producers from the coordination mechanism entirely. Iraq has signalled it wants higher quotas. An alliance losing members and facing internal quota disputes has less capacity to manage a downside price scenario than the headline production numbers suggest.
The compensation framework matters for the timing of any flood. Every country that overproduced since January 2024 must fully compensate, tracked monthly by the Joint Ministerial Monitoring Committee. Compensation schedules assume producers can restrain output — but after six months of forced shut-ins, several members are running well below quota through no choice of their own, which converts compensation obligations into permission to produce aggressively once shipping resumes.
The producers explicitly reserved the right to increase, pause or reverse the phase-out. That flexibility is the only thing standing between a Hormuz reopening and a price collapse.
Iran's Six Conditions Are Structurally Incompatible With Washington's Position
The political resolution everyone is trading has a specific obstacle, and it is not a matter of negotiating goodwill.
Iran said Sunday that a deal with Oman defining new shipping lanes through the strait is in its final stages, then reiterated that the waterway reopens only once Washington meets further conditions. The head of Iran's supreme national security council put the number at six: ending the war and aggression against Iran and its allies, lifting the U.S. counterblockade of Iranian ports, ending sanctions, releasing frozen assets, and compensation for wartime damage. Tehran also insists on retaining control of the waterway and charging tolls for passage.
Washington's position is that any reopening must preserve unrestricted freedom of navigation without Iranian approvals, tolls or controls.
Those positions cannot both be satisfied. The dispute is not over the size of a payment or the sequencing of steps — it is over whether Iran exercises sovereign control of an international waterway. That is a binary question with no midpoint, which is precisely why the market cannot price a gradual convergence.
Talks are not occurring. Iran's foreign minister said Tehran is not in direct discussion with the United States and will not begin while Washington breaches the interim deal signed in June. That June memorandum included a provision creating a $300 billion reconstruction fund for Iran, and it has been breached on several occasions while still nominally holding. The Revolutionary Guards said their strategy is to maintain the blockade until every condition is accepted, describing the strait as a theatre of war rather than a waterway.
Against that, President Trump has maintained an optimistic tone, saying the conflict could end pretty soon and that discussions are progressing. Reports Friday indicated the United States could lift its naval blockade once commercial shipping through the strait resumes without restrictions, which caused crude to reverse some gains in post-settlement trading.
That gap — Tehran ruling out talks while Washington describes a deal as near — is the volatility engine. Last week's 7% decline and Monday's reversal are both the same trade being put on and taken off as the two narratives alternate. Neither side is lying. They are describing different processes: Iran-Oman technical arrangements on shipping lanes, and U.S.-Iran political terms on reopening. The first is nearly done. The second has not started.
The EIA Has Brent at $74 for This Quarter and Its Assumption Broke
The most consequential piece of published analysis in the market right now is wrong in a specific, identifiable way, and the correction arrives tomorrow.
The Energy Information Administration's Short-Term Energy Outlook, released July 7 with a forecast completed July 1, projects Brent averaging $74 per barrel in the third quarter of 2026 — a reduction of $27 from the prior month's outlook — and falling to an average of $65 in 2027 on continued inventory accumulation. It noted Brent averaged $85 in June, down $22 from May and $32 from the April peak, and that daily spot prices had dropped below $70 on July 1.
The assumption underneath that forecast is stated explicitly. On June 18 the United States and Iran signed a memorandum of understanding to end the conflict and open the Strait of Hormuz. Following the signing and increased traffic through the strait, the agency raised its expectations for global oil production for the remainder of the year, expecting most crude production to return to near pre-conflict averages by year-end and the majority of shut-in production back online in the first quarter of 2027.
That assumption has not held. The strait remains effectively closed, the memorandum has been breached repeatedly, and Brent trades at $84.18 rather than $74.
The next STEO release is scheduled for August 11 — tomorrow. It will be the first official U.S. government revision to incorporate the July re-escalation and the current conditions dispute. That makes it a genuine event risk for a market that has been anchoring on a $74 third-quarter number that spot has exceeded by $10 for weeks.
The demand side of the same outlook is worth carrying forward because it is less assumption-dependent. The agency forecasts global oil consumption decreasing by an average of 1.2 million bpd in 2026, with 0.8 million bpd of that decline from non-OECD countries, before rebounding by 2.0 million bpd in 2027 to 104.8 million bpd. U.S. retail gasoline is projected at $3.80 per gallon in the third quarter, down from more than $4.20 in the second, with low gasoline inventories keeping crack spreads elevated.
Demand destruction of 1.2 million bpd is the reason $138 did not become $200, and the projected 2.0 million bpd rebound in 2027 is the reason a reopening does not automatically mean $50.
Wall Street Is Split Between $86 and $65 and Both Sides Are Coherent
Institutional forecasts on crude have the widest dispersion of any major asset class right now, and the split maps directly onto the Hormuz binary.
J.P. Morgan Global Research forecasts Brent averaging $86 per barrel in the third quarter of 2026, $80 in the fourth quarter and $78 at year end. Its reasoning is that the market has rebalanced through larger-than-expected demand losses and smaller-than-expected OECD commercial inventory draws, with China serving as a case study in demand destruction. It assesses long-term damage to Gulf production as minimal while flagging that the uncertain future of OPEC may complicate the outlook.
The EIA has Brent at $74 in the third quarter and $65 for 2027. Earlier bank work built around no Iranian disruption produced far lower numbers still: Goldman Sachs at one point forecast Brent averaging $64 for 2026 with a 2.3 million bpd surplus, assuming no major supply disruption. ING's bearish framework had Brent averaging $57 through 2026, against a Saudi fiscal break-even near $90.
Structural bearish factors remain intact for the medium term regardless of the war. OPEC+ was unwinding voluntary cuts through 2026, U.S. shale production sits at record highs near 13.6 million bpd, and global demand growth is moderate. Those forces reassert downward pressure the moment the conflict premium fades.
At the other extreme, one senior industry analyst argued in March that a prolonged near-closure of Hormuz could push oil to $150 to $200 per barrel and trigger severe global economic fallout.
So the credible range runs from $57 to $200 on the same commodity within the same year. That is not analytical incompetence — it is the honest consequence of a single political variable dominating a physical market.
The technical picture has already flipped to reflect the shift. Monthly indicators on both Brent and WTI moved from Strong Sell in early 2026 to Buy by July, with moving averages across all timeframes signalling bullish momentum on the monthly chart. Trend-following systems are long crude for the first time this cycle.
For a working forecast, J.P. Morgan's $86 third-quarter average is the most defensible central estimate because it assumes neither full reopening nor further escalation. Spot at $84.18 sits just beneath it.
The Houthi Front Is Widening the Risk Beyond Hormuz
A second theatre has opened and it removes the alternative supply route that would otherwise cap prices.
Iran-aligned Houthi forces said they struck Saudi Aramco's Jazan refinery on Sunday. That came two days after the kingdom signed a defence pact with Turkey and Pakistan in response to growing regional instability. The group also claimed a large-scale attack against forces aligned with Yemen's Saudi-backed government late last week. Risks remain elevated outside Hormuz, with Houthi groups continuing attacks and threats against Saudi-linked shipping in the Red Sea and around Bab el Mandeb.
The strategic significance is about routing rather than about the refinery itself. Saudi Arabia's principal workaround for a closed Hormuz is the East-West pipeline carrying crude from the Eastern Province to Red Sea terminals at Yanbu and Jazan, bypassing the strait entirely. That is the release valve the market has been counting on to moderate the supply loss. Striking Jazan and threatening Red Sea shipping attacks the workaround.
The physical risk data supports treating this as material rather than symbolic. ADNOC reported Friday that 15 of its vessels have been attacked while transiting the Strait of Hormuz since the conflict began. Iran was reported attacking hostile targets in the strait following explosions near Qeshm Island. Tanker owners pricing war risk premiums against that record will demand extraordinary compensation to sail, which means a political reopening does not immediately produce commercial traffic.
That distinction matters enormously for the forecast timeline. Even in a bullish-resolution scenario — Iran and Oman finalise transit lanes, Washington lifts the naval blockade, the strait formally reopens — insurance markets, charterers and crews need time to normalise. History suggests these understandings can prove fragile, and each day without a breakthrough makes traders more cautious.
The practical read: the widening Houthi front raises the floor under crude by eliminating the alternative route, and it delays the downside scenario even if the political question resolves. A reopening announcement is worth perhaps $8 immediately and $20 over months, not $20 in a day.
Six Months of Inventory Drawdown Is the Hidden Bullish Variable
The stock picture is the most underanalysed part of this market and it argues against the bearish consensus.
J.P. Morgan's framing is specific: the market rebalanced through larger-than-expected demand losses and smaller-than-expected OECD commercial inventory draws. The EIA expects ongoing inventory accumulation over the next year to keep downward pressure on prices, with Brent falling to $65 in 2027 as a result.
Those two statements describe different worlds and only one of them can be right.
Work the arithmetic. Nearly 10 million bpd of OPEC+ supply came off the market from February through May. Demand fell by roughly 1.2 million bpd on the EIA's own annual estimate. The gap between those figures — call it 8 million bpd at the peak of the disruption — had to be filled from somewhere, and the only available sources were non-OPEC production increases and inventory.
Six months of that arithmetic means global commercial stocks have almost certainly been drawn down substantially, even if official OECD data has lagged. Low gasoline inventories keeping crack spreads elevated is direct confirmation on the products side: the agency's own gasoline forecast depends on it.
Why this is bullish beyond the immediate: a market that has consumed its inventory cushion has no buffer against the next disruption. The reason Brent could not sustain $138 was that stocks absorbed the shock. If those stocks are now materially lower, the price response to any further escalation is larger than it was in April, not smaller.
It also complicates the downside case. A reopening flood of 9.6 million bpd meets a market that needs to rebuild inventory before it can build surplus. Restocking absorbs barrels at a rate that cushions the price decline, which is one reason $65 rather than $50 is the realistic bear target for 2027 even in a full-resolution scenario.
The tell to watch is the futures curve. Deep backwardation confirms tight prompt supply and drawn inventory. A flip toward contango would signal the market anticipates the flood and is beginning to pay for storage. That transition, when it comes, is the highest-conviction sell signal available in this market and it will precede the price move.
Read More
-
Yen Stalls at 160 Despite a 3% JGB and Tokyo Core CPI at 2.0% — Intervention Sits at 164, Friday's Payrolls Decide
02.09.2026 · TradingNEWS ArchiveEnergy
-
Microsoft Rebounds From $491 Low as $678B Backlog and Positive Free Cash Flow Shield It From 5.15% Yields
24.09.2026 · TradingNEWS ArchiveStocks
-
XRP Slides to $1.50 After $1.66 Peak as Escrow Supply Meets $20M Daily ETF Bid, With $1.70 in Reach
24.09.2026 · TradingNEWS ArchiveCrypto
-
Brent Retakes $105 From $98 Low as Houthis Hold Bab al-Mandab and Hormuz Runs at Half Capacity, WTI at $93.96
24.09.2026 · TradingNEWS ArchiveCommodities
-
Nasdaq Falls to 26,804, S&P 500 Drops to 7,688, Dow Sheds 191 Points as Oracle Tumbles 7% on Project Jupiter Notice
24.09.2026 · TradingNEWS ArchiveMarkets
-
Euro Sinks to 1.1380 on 125–150bp ECB-Fed Rate Gap as RSI Hits Oversold 25.47
24.09.2026 · TradingNEWS ArchiveForex
What the $16 Risk Premium Is Actually Pricing
Decomposing the current price into its components clarifies what has to happen for it to move.
Brent at $84.18 sits approximately 16% above pre-war levels. Brent traded near $72 in early July — described at the time as back to levels immediately preceding the February 28 strikes — and dipped below $70 on July 1. Taking $70 to $72 as the war-free baseline puts the current risk premium at roughly $12 to $14 per barrel.
That premium is not compensation for barrels lost. It is compensation for barrels that might be lost tomorrow.
The distinction is critical because it explains the price behaviour that otherwise looks irrational. When roughly 10 million bpd was physically absent in April, Brent traded $138 — a $68 premium. Today, with the strait still shut, Brent trades $84 — a $13 premium. The physical disruption has not eased materially, but the market has decided the disruption is priced and only escalation or resolution matters now.
That is a market that has adapted. Refiners have resourced, trade flows have redirected, and non-Gulf producers have stepped up — Russia and Kazakhstan in particular have found significant opportunity as Gulf customers scramble for alternatives, though Russian supply carries its own constraints from Ukrainian strikes on energy infrastructure and from tariff policy.
For the forecast, the $13 premium defines the mechanics of both scenarios. A credible reopening deletes it, taking Brent to $70 to $72 immediately, before the physical flood then pushes toward the EIA's $65 through 2027. That is a 22% decline in two steps.
Escalation expands it. The premium reached $68 at the April peak, which means the market has demonstrated willingness to pay far more than $13 when the situation deteriorates. A Houthi strike that materially damages Saudi export capacity, or Iranian action that sinks a major tanker, re-expands the premium toward $30 or beyond — putting Brent above $100 without any change in the underlying closure.
Neither outcome involves crude sitting at $84. The current price is the market's holding pattern, not its estimate of fair value under any specific resolution.
WTI's $78 Level and Why the Spread Matters
The domestic benchmark has its own technical structure and the Brent-WTI spread carries information about the closure.
WTI stalled just below resistance in the $77.53 to $77.93 zone during the recent consolidation, with desk commentary noting bulls awaited a sustained move above $78.00 amid supply concerns. Monday's advance to $80.42 clears that resistance decisively — a 2.86% gain that takes the contract through a level it had failed at repeatedly.
That breakout matters because it is confirmation rather than a headline reaction. WTI clearing $78 with volume, while Brent gains only 0.75%, indicates the strength is not purely geopolitical premium expansion. If it were, Brent would lead — it is the waterborne benchmark most exposed to the strait.
The spread tells the story. Brent at $84.18 against WTI at $80.42 is a differential of $3.76. That is narrow by the standards of a Middle East supply crisis, when Brent typically commands a substantial premium because it prices the crude that cannot reach market. A compressing spread suggests either that international supply anxiety is easing or that U.S. crude is being pulled toward export markets aggressively enough to tighten the domestic balance.
U.S. shale output at record highs near 13.6 million bpd is the reason WTI has not run further. Domestic supply is abundant, and the constraint on American barrels reaching disrupted markets is logistics rather than production. Every dollar of Brent premium above WTI incentivises more U.S. export volume, which is the mechanism through which the global market self-corrects without OPEC+.
Levels for the week: WTI's $78.00 breakout level becomes first support, with $77.53 beneath it. Resistance sits at $82 and then the psychologically important $85. Brent support is $83.48, Monday's low, then the $80 handle. Resistance is $85, then $87.
A close back below $78 on WTI would signal the reopening trade is reasserting and would be the first technical confirmation that last week's 7% decline resumes.
Wednesday's CPI Adds a Second, Opposing Force
Oil this week is exposed to a macro variable that runs against the geopolitical one, and the interaction deserves attention.
July U.S. CPI publishes Wednesday, August 12 at 8:30 a.m. ET, with PPI Thursday and retail sales Friday. Consensus expects the headline annual rate stepping down to 3.4% from 3.5% in June and 4.2% in May, with reduced gasoline price volatility cited as a contributor. July payrolls contracted by 23,000 against an 80,000 consensus, cutting September Federal Reserve hike odds to roughly 44% to 46% from about two-thirds a week earlier.
The two channels pull in opposite directions.
Through the demand channel, weaker U.S. employment and a possible growth slowdown are bearish crude. The EIA already forecasts global consumption falling 1.2 million bpd in 2026, and a deteriorating U.S. labour market extends that. A cool CPI print that confirms a slowing economy reinforces the demand-destruction narrative that has kept prices from spiralling.
Through the financial channel, a cool print lowers real yields and weakens the dollar, both of which support dollar-denominated commodities. A softer greenback makes crude cheaper for non-U.S. buyers and mechanically lifts the price.
Historically the financial channel dominates on the day and the demand channel dominates over months. So the tactical expectation is that a soft CPI print lifts crude modestly Wednesday and a hot print pressures it, with the durable effect running the other way.
There is a reflexive loop worth naming. Elevated crude is itself a driver of the inflation the Fed is watching, and Federal Reserve officials remain divided on whether to raise rates as they monitor the oil shock from the Middle East and its pass-through. Higher oil raises hike probability, which strengthens the dollar, which caps oil. That negative feedback is part of why Brent has been unable to sustain moves above $85 despite a closed strait — the macro response acts as a brake on the commodity that triggers it.
For the forecast, treat CPI as a modifier rather than a driver. It can move crude $2 in either direction. Hormuz can move it $20.
Refining Margins Are the One Unambiguously Tight Market
Product markets are sending a clearer signal than crude and they lean bullish.
Low gasoline inventories are keeping gasoline crack spreads elevated, which the EIA expects to partly offset the crude-driven decline in retail prices during the third quarter. Retail gasoline is forecast at $3.80 per gallon for the quarter against more than $4.20 in the second. Refiner equities have been trading near record highs on Iran-driven margins.
Product tightness during a crude supply disruption is logical but not automatic, and the reason it has emerged here is instructive. Hormuz closure removed not just crude but refined product exports from Gulf refineries, and the Houthi strike on Jazan targeted a refinery rather than a crude terminal. The disruption has hit the refined layer of the supply chain at least as hard as the crude layer.
That has two forecast implications.
First, it puts a floor under crude demand from refiners. Elevated crack spreads mean refineries run at maximum rates because every barrel processed is highly profitable, which sustains crude purchasing even at $84. Demand destruction shows up at the consumer level rather than at the refinery gate, and consumer demand adjusts with a lag.
Second, it means the price relief from any Hormuz reopening reaches consumers more slowly than it reaches crude. Rebuilding product inventory and normalising Gulf refinery exports takes longer than restarting crude loadings, so gasoline stays expensive after crude falls. The EIA's own forecast embeds this — crude down, margins up, retail prices declining less than crude.
For traders, the cleanest expression of the current setup may be in the crack rather than in flat price. Long crude at $84 is a bet on a political outcome with a bimodal distribution. Long refining margin is a bet on physical product tightness that persists under either political outcome, because a reopening restores crude flows faster than it restores refined product flows.
That said, refiner equities near record highs on Iran-driven margins are priced for the current environment continuing. The risk is symmetric there too.
The Bimodal Distribution Is the Whole Point
Before laying out scenarios it is worth stating plainly why conventional range forecasting fails on this asset right now.
A normal commodity forecast assumes a continuous distribution: most probability clustered around a central estimate with thinning tails. That framework works when price is set by inventory, marginal cost and demand elasticity. It does not work when a single political switch controls 9.6 million barrels per day.
The switch has two positions. Hormuz is open or Hormuz is closed. There is no partial state that persists — the Iran-Oman shipping lane arrangement is nearly complete while the U.S.-Iran political terms have not been negotiated, and the strait either carries commercial traffic or it does not.
With the switch closed, the physical deficit persists, inventory continues drawing, and any incremental escalation expands a $13 premium toward the $30 to $68 range the market has already demonstrated it will pay. That path leads through $90 to $100 and, in a severe scenario involving damage to Saudi export infrastructure, toward the $150 figures serious analysts floated in March.
With the switch open, 9.6 million bpd returns as fast as loading rates permit, meeting 800,000 bpd of authorised quota increases plus U.S. shale at 13.6 million bpd plus whatever OPEC+ adds next. Saudi Arabia doubled shipping volume within weeks of the June easing. The EIA's $74 third-quarter and $65 for 2027 become the realistic path, with ING-style $57 forecasts back in play for 2027.
The area between $75 and $85 — where crude trades now — is the least likely place for it to be six months from now. It is a waiting room.
The practical consequence is about instrument selection rather than direction. A bimodal distribution with fat tails on both sides is precisely the condition under which options are cheap relative to realised outcomes and directional futures positions are dangerous. Straddles and strangles express this market better than flat-price length. Anyone running directional risk should be sized for a $20 gap, not for a $3 daily range.
Levels, Scenarios and What to Watch Into Friday
The forecast resolves into three paths with defined triggers.
Base case, roughly 50%: no resolution and no major escalation. The strait stays shut, Iran-Oman technical talks continue without U.S.-Iran political negotiation, and crude chops between $78 and $88 Brent with WTI $75 to $83. J.P. Morgan's $86 third-quarter Brent average is the reference. Tomorrow's EIA Short-Term Energy Outlook revises the $74 third-quarter forecast higher, which supports the current level rather than challenging it. Wednesday's CPI moves crude $2 in either direction and nothing more.
Bull case, roughly 30%: escalation. A Houthi strike materially damages Saudi export capacity beyond Jazan, or an incident in the strait halts what limited traffic exists. The $13 premium re-expands toward $25 to $30. Brent takes $88, then $95, then tests $100 — the level reached in March when Iran's leadership confirmed the closure would continue. WTI follows to $92 to $95. Sustained closure into the fourth quarter with drawn inventories is the path toward the $120 to $138 zone already visited this year.
Bear case, roughly 20%: resolution. Washington lifts the naval blockade once commercial shipping resumes without restrictions — the arrangement reported Friday — and Iran accepts terms short of tolls and control. The premium deletes immediately, taking Brent to $70 to $72 and WTI to $66 to $68. The physical flood of 9.6 million bpd against 800,000 bpd of quota increases and record U.S. shale then drives the second leg toward the EIA's $65 average for 2027.
Watch list, in order: the EIA Short-Term Energy Outlook tomorrow, August 11. Any confirmation of direct U.S.-Iran talks beginning. Tanker transit counts through the strait and war-risk insurance rates. Further Houthi activity against Saudi Red Sea infrastructure. The futures curve shifting from backwardation toward contango. The OPEC+ September implementation of 188,000 bpd and whether Iraq's quota demands fracture the group.
Discipline: WTI's $78 breakout is the line that separates the escalation trade from the resolution trade, and Brent's $83.48 is its equivalent. Below those levels last week's 7% decline resumes. Above $88 Brent the market is pricing escalation rather than stalemate. Size for a gap, not for a range.