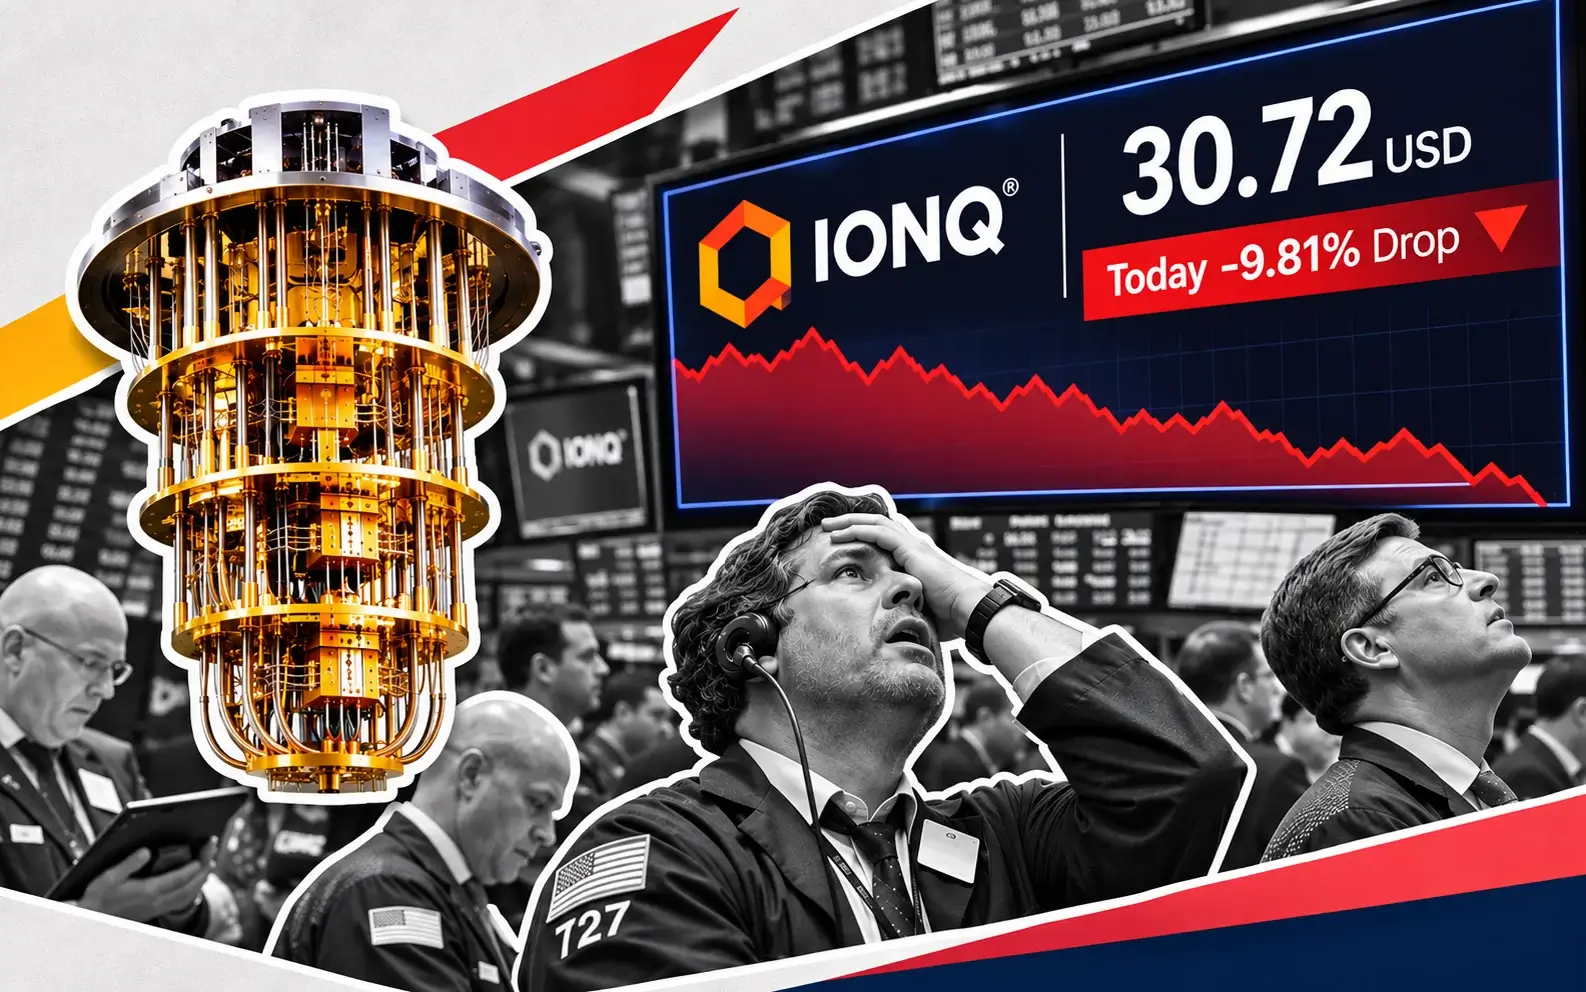
S&P 500 Slides to 7,510, Nasdaq Sheds 468 Points, Dow Holds 52,156 as Chip Rout Delays 7,845 Record Retest
October PPI rose 0.3% against a 0.4% forecast, but 6.5% annual wholesale inflation and a 5.16% 10-year yield turned a green open into a semiconductor liquidation | That's TradingNEWS
Key Points
- The Nasdaq Composite fell 1.85% to 24,897.76 as a gauge of the largest chipmakers dropped 4% by mid-morning.
- October PPI rose 0.3% month over month against a 0.4% forecast, while annual wholesale inflation hit 6.5%.
- Modine jumped 38.37% from its $106.10 close on reports Samsung is in talks to buy the cooling maker.
The S&P 500 (SPX) traded at 7,510.00 shortly after 11:00 a.m. ET on Friday, down 82.40 points or 1.09% from Thursday’s close of 7,592.40. The Nasdaq Composite (IXIC) carried the heavier wound, sliding to 24,897.76, a loss of 468.33 points or 1.85% that pushed the tech benchmark back under the 25,000 handle. The Dow Jones Industrial Average (DJI) held up best at 52,156.20, off 140.89 points or 0.27%, while the Russell 2000 traded at 2,784, down 0.51%, after Thursday’s 1.66% drop to 2,799.06 had already done the small-cap damage.
The shape of those numbers tells the story before a single headline is read. A 1.85% Nasdaq loss against a 0.27% Dow loss is a 158-basis-point spread, and a gap that wide only opens when selling concentrates in a narrow group of very large stocks. Today that group is semiconductors. A gauge of the largest chipmakers was down 4% by mid-morning, Nvidia (NVDA) was off 4.67%, Advanced Micro Devices (AMD) had given up 9.72% and Broadcom (AVGO) was down 6.77%. Those three names carry enough index weight to drag the S&P 500 lower even on a morning when most of its members were trading green.
That split between the index and the average stock defines the tape. Most S&P 500 components were up while the cap-weighted benchmark fell more than 1%, the signature of a liquidation in mega-cap leadership rather than a broad flight from risk.
The reversal from the open was violent. The Dow printed 52,403.96 at 9:38 a.m., up 106.87 points, and the S&P 500 opened 0.35% higher after a softer-than-expected monthly wholesale inflation print. From that early high to the late-morning low the S&P 500 swung more than 140 basis points, the second straight session where the opening move was fully reversed inside 90 minutes.
The weekly ledger still favors the bulls on paper. Through Thursday the S&P 500 was up 3.25% for the week and the Nasdaq Composite was up 4.32%, gains built almost entirely on Monday’s 2.35% and 2.74% surges. At current levels the S&P 500 holds a weekly gain just above 2% and the Nasdaq a gain just under 2.4%. Three consecutive sessions of chip selling have now consumed half of what Monday built, and the market goes into next Tuesday’s Nvidia report with the leadership group visibly broken.
From Green Futures to a Red Tape: How the Session Rolled Over
The overnight setup was quiet, almost deceptively so. At 5:42 a.m. ET, Nasdaq-100 futures were down 0.13% while S&P 500 futures were up 0.12% and Dow futures were up 0.21%. December S&P 500 E-mini futures traded at 7,626.5 before 6:00 a.m., more than 34 points above Thursday’s cash close, and Nasdaq-100 E-minis sat at 28,360.5. Nvidia was up 2.29% in early premarket trading, a relief bounce after Thursday’s chaotic session.
Europe gave the futures a reason for optimism. The STOXX 600 had closed Thursday at a record, the DAX gained 0.4% to 26,772 and the FTSE 100 added 0.25% to 10,863. European chip names did not share that confidence on Friday morning, with ASML and ASM International down 1.5% early, BE Semiconductor down 1.1% and Infineon down 1.8%. That was the first signal the semiconductor bid was not coming back.
The 8:30 a.m. producer price release was the catalyst bulls wanted. October PPI rose 0.3% month over month against a 0.4% consensus, a sharp slowdown from September’s 1.3% surge. Futures ticked higher, Nvidia extended its premarket gain and the opening bell delivered exactly what the overnight tape promised. The Dow opened up 0.39%, the S&P 500 up 0.35% and the Nasdaq up 0.21%. At 9:34 a.m. the Dow was ahead 0.33% and the S&P 500 ahead 0.27%, while the Nasdaq had already slipped to a 0.01% loss.
That Nasdaq number was the tell. Even with Nvidia green, the rest of the chip complex opened under pressure, and within the first half hour the selling broadened from second-tier semiconductors into the largest names. Nvidia turned negative, AMD and Broadcom gapped through their opening levels, and optical, data center and AI cloud stocks followed.
By 10:06 a.m. the indexes were mixed, the 10-year Treasury yield had pushed to 5.16% and Nvidia was down 2%. By 10:26 a.m. Nvidia was off 3.76%, AMD down 9.59% and Broadcom down 6.55%. By 10:59 a.m. the S&P 500 was down 0.99% and the Nasdaq down 1.70%. Shortly after 11:00 a.m. the losses had deepened to 1.09% and 1.85%.
The sequence matters for anyone reading the afternoon. This was not a gap-down open driven by an overnight shock. It was a green open that sellers methodically dismantled, a pattern that typically reflects institutional distribution rather than retail panic.
October PPI: A Softer Monthly Print Wrapped Around a 6.5% Annual Problem
The headline gave traders a reason to buy the open. The Producer Price Index for final demand rose 0.3% in October, below the 0.4% consensus and a fraction of September’s 1.3% jump, the largest monthly gain in more than four years. Core producer prices were expected to rise 0.3% after September’s 0.7%. On the surface, the wholesale pipeline cooled.
The annual numbers say something very different. Producer prices rose 6.5% from a year earlier, up from 6.3% in September and the largest 12-month increase since November 2022. The consensus had called for 6.6%, so the annual print came in a tenth below forecast, but the direction is unmistakable. September’s 6.3% reading was itself the biggest since December 2022, and October pushed past it. Core producer prices rose 5.0% year over year. Those are not numbers a central bank can ignore, regardless of the monthly deceleration.
Energy is the swing factor. September’s spike came with energy prices up 10.8% in a single month and transportation and warehousing services up 3.4%, both fed by the oil shock tied to the U.S.-Iran conflict. Crude has backed off since then, with WTI trading in the high $80s this week after settling above $104 per barrel at the end of October, and that retreat is what pulled the monthly October number down. The annual comparison still carries the full weight of a year of rising input costs.
The PPI matters more than usual because of what landed earlier in the week. October’s Consumer Price Index rose 0.4% month over month, above forecasts, with core prices up 0.3%. That print sent the 2-year Treasury yield up 17 basis points on Tuesday to 4.74%, its biggest one-day jump since April 2025, and pushed the 10-year yield back to 5%.
Chicago Fed President Austan Goolsbee spelled out the problem Friday morning. He said the central bank still has work to do to rebuild credibility on inflation, that “lately we’re not making any progress,” and that inflation is moving the wrong way. He tied the price pressure to demand overheating from the AI data center buildout, which he said is spreading beyond its own sector. Goolsbee is not a 2026 voter on the rate-setting committee, but he rotates into a voting seat in 2027, and his framing puts the AI capital spending boom directly in the inflation conversation. That is a hostile backdrop for the exact stocks being sold today.
The 10-Year at 5.16% and a December Hike Already in the Price
The single most important number on the screen Friday is not an index level. It is the 10-year Treasury yield at 5.16%, up 6 basis points on the session and the highest since October. On Thursday the benchmark yield rose 11.6 basis points to 5.105%, returning above 5%, after an oil spike triggered a bond selloff and a soft 30-year auction drained demand from the long end. The 2-year yield climbed to 4.867% Thursday, its highest since October 14.
The rate path is set. Futures markets price a quarter-point hike at the December 8 and 9 policy meeting as the base case, with odds of a half-point move above 10%. Earlier in the week, after the CPI print, hike odds ran between 85% and 89%, and talk of a 50-basis-point move gained traction after a Fed governor said a half-point hike was on the table if core CPI ran at 0.3% or higher. Core CPI printed exactly 0.3%.
The yield level matters because of what it does to valuation math. At a 5.16% risk-free rate, the equity risk premium on a market trading at elevated multiples compresses toward zero. Long-duration growth assets, the stocks whose value rests on cash flows years in the future, take the biggest hit. That explains why Thursday’s heaviest losers were the most heavily financed and most capital-intensive corners of the AI buildout rather than the rival chip designers, and why Friday’s selling extended into the designers themselves.
There is a ceiling on the current move, at least for now. In early October the 10-year reached 5.28% and the 30-year tested 5.64%, levels not seen since 2007. The current 5.16% is 12 basis points below that peak.
The dollar is amplifying the squeeze. The dollar index sits near 19-month highs, and the yen has weakened to 160.10 per dollar, a level that has Japan’s officials issuing intervention warnings. EUR/USD traded at 1.1059 overnight. A strong dollar tightens global financial conditions, pressures the overseas earnings of multinationals, and draws capital out of risk assets abroad and into Treasury bills at home.
For equity investors the arithmetic is unforgiving. The S&P 500 trades 4.3% below its October record of 7,844.67, while the 10-year sits within 12 basis points of its own October peak. Stocks are pricing a softer path than bonds. One of those two markets is wrong, and Friday’s chip selling suggests equity holders are beginning to concede the point.
Nvidia Without Huang: Day Two of a Leadership Vacuum
Nvidia traded down 4.67% late Friday morning, pricing the stock at $158.43 against Thursday’s close of $166.19.
The backdrop is unprecedented for a company of Nvidia’s size. Jensen Huang resigned as chief executive, president and board member, effective immediately, after reports of multiple affairs, including one with a woman U.S. intelligence officials suspect of being a Chinese intelligence asset and others with company subordinates. Huang co-founded the company and led it for 33 years. Chief Financial Officer Colette Kress has stepped in as interim CEO while the board searches for a permanent successor. Nvidia reports its third quarter next Tuesday, November 17, with Kress leading the call and no permanent leader in place.
Thursday’s session showed how violently the market first priced the news. Nvidia opened down as much as 14%, at one point down 16% intraday to its lowest level since June 2025, then recovered to close down 4.34% at $166.19. Volume topped 730 million shares, five times a normal session. The stock’s total market value fell below $4 trillion in early trading for the first time since 2025, and the week’s slide erased $490 billion in value.
Retail investors bought the collapse at record pace. Individual traders put a net $111 million into Nvidia in the first 30 minutes of Thursday’s session, the stock’s biggest opening on record for retail flows and more than 40 times a normal start.
The governance story carries a national security edge. Reports this week said $7.5 billion worth of Nvidia chips reached Chinese firms through a network tied to the woman at the center of the probe. Treasury Secretary Scott Bessent said Friday that Treasury, Defense, State and the U.S. Trade Representative have favored placing a company called Megaspeed on the Commerce Department’s Entity List for months, that Commerce controls the process, and that he was frustrated given the administration’s stated limit on Nvidia chip sales to China at nothing above H100-class processors. The prospect of tighter export enforcement adds a revenue risk on top of the leadership risk.
Valuation is where the bull case lives. Nvidia trades at 12 to 13 times forward earnings, its lowest multiple since 2012, while revenue grows 60% year over year. The stock sits 40% below its peak. That compression has been building for six weeks, with the stock facing its first six-week losing streak since 2012. Tuesday’s report now carries more weight than any quarter in the company’s history.
AMD and Broadcom Hand Back Thursday’s Rotation Trade
Thursday looked like a rotation inside the semiconductor sector. Friday revealed it as a temporary parking spot. When Nvidia collapsed at Thursday’s open, money moved into its closest competitors. AMD closed up 5.9% and Broadcom rose 5.5%, leading all gainers in the S&P 500, as traders bet that customers would diversify away from a leaderless Nvidia. The Philadelphia Semiconductor Index fell only 0.54% to 10,506.67 Thursday, cushioned by those two names.
Friday erased that logic entirely. AMD was down 9.72% late in the morning and Broadcom down 6.77%, giving back more than Thursday’s gains in both cases. Intel fell 5%. Taiwan Semiconductor Manufacturing, which builds Nvidia’s chips, was down 2.85%, and semiconductor equipment maker ASML was down 1.91%. Memory names Micron and SK Hynix fell, and storage maker SanDisk extended Thursday’s losses. A gauge of the largest chip stocks fell 4%.
The reversal exposes what Thursday’s rotation actually was. Traders were not making a durable call that AMD and Broadcom would take share from Nvidia. They were hedging a single-stock event by staying long the sector through substitutes. When the selling extended into a second day and the 10-year yield moved higher, the hedge became the problem.
The context of the past two weeks makes the fragility clearer. On November 5, the day after the midterm elections, the Nasdaq Composite fell 5.5% and the S&P 500 dropped 4.4%. Chipmakers as a group lost more than $1.5 trillion in value that day. AMD fell 14%, Nvidia and Broadcom each shed more than 6%, Micron dropped 13% and SanDisk plunged 20%. Then Monday of this week brought a 2.74% Nasdaq surge and a 13.26% jump in AMD. The group has whipsawed between double-digit losses and double-digit gains inside seven trading days, which tells you positioning is crowded and conviction is thin.
The Nasdaq-100 held its 200-day moving average through Thursday’s close, up 4.8% on the week at that point. That level is the line the bulls must hold. A close below the 200-day for the Nasdaq-100 would turn a sector correction into a technical breakdown in the market’s largest growth index.
The sector’s next catalysts are compressed into a single week. Nvidia reports Tuesday. Any guidance shortfall or ambiguity from an interim CEO would land on a chip complex that has already demonstrated it cannot absorb sustained selling without breaking.
Applied Materials Posts a Record $10.41 Billion Quarter and Still Gets Smoked
Applied Materials (AMAT) delivered the strongest quarter in its history after Thursday’s close, and the stock traded down 6.23% Friday morning. That drop pushed shares to $357.22 against Thursday’s close of $380.95, which itself followed a 3.58% decline ahead of the report.
The fiscal fourth-quarter results were spotless on the numbers. Revenue reached a record $10.41 billion, up 53% year over year and 14% from the prior quarter, against a $10.30 billion consensus. Non-GAAP earnings per share came in at a record $4.16, up 92% year over year and ahead of the $4.06 estimate. GAAP EPS was $3.40. Non-GAAP gross margin hit 50.6%, up 250 basis points from a year earlier and the company’s 14th straight quarter of year-over-year gross margin expansion. Non-GAAP operating income reached a record $3.68 billion, or 35.3% of revenue.
The semiconductor systems business drove the quarter, generating $7.996 billion in revenue against $4.879 billion a year earlier. The services business delivered $1.896 billion. Management said it is on track to grow semiconductor systems more than 40% in calendar 2026, expects advanced packaging revenue to rise near 90% for the calendar year and guided its services segment to its first $2.0 billion quarter, up 28% year over year.
Fiscal 2026 closed with record revenue of $34.45 billion, up 21%, and record non-GAAP EPS of $12.89, up 37%. Free cash flow hit a quarterly record of $2.6 billion, and the company returned $2.42 billion to shareholders, including $2.00 billion in buybacks, its largest quarterly repurchase in more than eight years, and $421 million in dividends.
Shares initially rose 0.5% to $382.85 after hours. By Friday morning the semiconductor tape had overwhelmed the fundamentals.
The chart shows how far sentiment has fallen. Applied Materials set a 52-week closing high of $723.00 on June 30, 2026. At $357.22 the stock is down more than 50% from that peak. It fell 13.6% on November 5 alone, during the post-midterm rout, and lost 38.7% between October 7 and November 5. Before that slide, the stock had more than doubled in 2026.
The disconnect between results and price action is the clearest evidence of what is driving this market. Equipment demand is accelerating. None of it matters to a fund manager cutting semiconductor exposure into a weekend with the 10-year at 5.16% and Nvidia leaderless. When a 53% revenue beat cannot hold a green print, the sell decision has nothing to do with the company.
Read More
-
Yen Stalls at 160 Despite a 3% JGB and Tokyo Core CPI at 2.0% — Intervention Sits at 164, Friday's Payrolls Decide
02.09.2026 · TradingNEWS ArchiveEnergy
-
NVD ETF ($6.48) $7.74 Upside Target as Nvidia Loses Huang Before Its $108B Earnings Test
12.11.2026 · TradingNEWS ArchiveStocks
-
Bitcoin (BTC-USD) Holds 200-Week Line at $68,644; $75,200 Upside Target in Play
13.11.2026 · TradingNEWS ArchiveCrypto
-
Gold (XAU/USD) Holds $3,883 Above Yearly Low as Central Banks Buy; $4,150 Target in Sight
13.11.2026 · TradingNEWS ArchiveCommodities
-
Dollar Presses 159.93, Eyes 162 Upside Target as Tokyo Warns Against Forgetting the ¥15.4T Summer Intervention
12.11.2026 · TradingNEWS ArchiveForex
Cisco’s Record Quarter Collides With a 250-Basis-Point Margin Squeeze
Cisco Systems (CSCO) traded down 5.41% late Friday morning after reporting the strongest growth quarter in more than 15 years. The stock was already down 3.46% in premarket trading, and the semiconductor selloff extended the decline once the regular session opened.
The headline numbers in Cisco’s first-quarter fiscal 2027 report beat on every line. Revenue rose 24% to a record $18.5 billion, ahead of the $18.12 billion consensus, with product revenue up 32% and services up 1%. Non-GAAP EPS climbed 40% to $1.40, beating the $1.32 estimate by 8 cents. GAAP net income jumped 59% to $4.6 billion, or $1.14 per share. Non-GAAP operating income hit a record $7.0 billion and operating margin reached a record 37.8%.
Networking did the heavy lifting. Networking revenue surged 43% to $11.13 billion, accounting for 60% of total sales, and networking product orders rose 28%, the ninth consecutive quarter of double-digit growth. Total product orders grew 21%. Cisco raised its fiscal 2027 outlook for AI infrastructure revenue from hyperscalers to $9 billion from $7.5 billion, more than double the fiscal 2026 total. Full-year revenue guidance moved up to $74.8 billion to $75.8 billion from $72.2 billion to $73.4 billion, and non-GAAP EPS guidance rose to $5.47 to $5.53 from $5.05 to $5.11.
The problem sits in the gross margin line. Non-GAAP gross margin fell 250 basis points year over year to 65.6%. Product gross margin dropped 350 basis points to 63.7%, which management attributed to a heavier hardware mix and elevated memory costs, partly offset by productivity gains and price increases. Services gross margin improved 220 basis points to 72.9%.
The second-quarter guide added to the unease. Cisco guided Q2 revenue to $18.0 billion to $18.2 billion, below the $18.5 billion it just reported, with non-GAAP gross margin of 65% to 66%. Management now expects full-year gross margin just shy of 65%.
The same debate sank the stock in August, when Cisco fell 8.4% the day after its fiscal fourth-quarter report as non-GAAP gross margin dropped 210 basis points to 66.3%.
Management argues that operating margin, a record 37.8% this quarter, better reflects hyperscaler economics because the incremental expense to win that business is minimal. The market is not buying the argument on a day like this. Cisco’s sell-off is the networking version of the Applied Materials story: AI demand is real, it is accelerating, and it is showing up in revenue. It is also coming at lower margins and in a rate environment where investors refuse to pay up for growth that dilutes profitability. With the 10-year at 5.16%, a dollar of AI hardware revenue at 61.8% product margin is worth less than it was a quarter ago.
Nebius, CoreWeave and Super Micro: The AI Financing Chain Cracks Again
The companies most dependent on borrowed money and outside capital to fund the AI buildout took the hardest hits this week, and Friday’s chip slide extended the pressure. Thursday’s losses were concentrated in Nvidia’s direct supply chain: Super Micro Computer fell 11.30%, CoreWeave dropped 6.86%, SanDisk lost 4.11% and Micron gave up 1.59%.
Nebius Group (NBIS) is the case study. The AI cloud provider plunged 17.72% to $127.58 on Thursday after reporting results that beat on revenue and profit. Third-quarter revenue rose 571% year over year to $980.8 million, ahead of the $907.5 million consensus. Adjusted EBITDA reached $465.8 million, a 47.5% margin, and operating income turned positive at $50.4 million. The AI cloud segment generated $973.8 million in revenue, up 643%, with a 53.2% EBITDA margin.
The guidance broke the stock. Nebius cut its 2026 revenue range to $3.0 billion to $3.2 billion from $3.0 billion to $3.4 billion, landing below the $3.35 billion consensus, because delays at third-party data center sites pushed capacity into 2027. The largest slip is in New Jersey, where the remaining Microsoft-contracted capacity is now due in the second quarter of 2027. The company’s goal of exceeding $7 billion in annualized run-rate revenue slid from December to February, and Nebius will stop guiding to that metric after February.
The capital spending numbers spooked investors further. Third-quarter capex reached $7.3 billion. Full-year 2026 capex guidance rose to $27 billion from a prior $20 billion to $25 billion range, and the initial 2027 capex plan calls for $40 billion to $45 billion against 2027 revenue guidance of $12 billion to $13 billion. Nebius also disclosed that $325 million of third-quarter revenue was non-recurring, tied to its asset-light partnership model.
Management pointed to the offsets. Customer prepayments now cover more than 100% of the capital needed for contracted capacity, up from 50% to 60% a quarter earlier, and 2027 prepayments are expected at $17 billion to $20 billion.
None of that held the stock. Nebius has fallen 40% in a month. CoreWeave lost 37% in October as its bond yields surged and credit markets priced elevated default risk. The pattern across the group is consistent: revenue growth is enormous, but the capital needed to deliver it keeps rising, and with the 10-year at 5.16%, the financing cost of $40 billion in annual capex is a direct threat to equity value. Goolsbee’s comment that AI spending is overheating demand and feeding inflation lands squarely on this cohort. The higher rates go, the harder this trade gets.
Where the Bid Held: Modine, Cerebras and HawkEye 360
Not every AI-linked name got smoked. Three stocks posted double-digit gains, each on a company-specific catalyst strong enough to override the sector tape.
Modine Manufacturing (MOD) led the board after reports that Samsung Electronics is in talks to acquire the data center cooling specialist, with a deal possible as soon as the coming weeks. The stock closed Thursday at $106.10, giving the company a $5.6 billion market value, then jumped 28% in after-hours trading. In Friday’s premarket it traded up 22.53% at $130.00 and later extended to a gain of 38.37% before the bell.
The strategic logic is visible in Modine’s numbers. Data center segment revenue rose 95% year over year to $439.7 million in the July-to-September quarter, with segment operating profit up 70% to $61.2 million, though segment gross margin slipped 4.7 percentage points to 19.7%. The shares had fallen 15% since its November 3 report before the deal talk surfaced. Samsung already owns German cooling firm FläktGroup, acquired for €1.5 billion last year, and a Modine purchase would give it a North American manufacturing base in thermal management as racks get denser and chips run hotter.
Cerebras Systems (CBRS) jumped 11% after reporting third-quarter results that beat its own guidance and raising its outlook. Core revenue rose 70% to $230.9 million, above the company’s $214 million to $216 million guidance range. Cloud revenue surged 272% to $144.9 million. The company posted a surprise profit and named Microsoft as a cloud customer. Fourth-quarter core revenue guidance of $310 million to $330 million cleared the $271.2 million consensus by a wide margin, and full-year 2026 adjusted revenue guidance moved up to $940 million to $960 million from $880 million to $890 million, against an $887.04 million consensus. Cerebras signed two new hyperscaler deals, and Chief Executive Andrew Feldman said he expects revenue to triple in 2027.
HawkEye 360 (HAWK) ripped 17% after its third-quarter report. Revenue rose 84% to $59.3 million, topping the $56 million consensus, with international revenue up 76% to a record $23.3 million. GAAP EPS came in at breakeven against an expected 5-cent loss. Backlog reached $300.3 million, and the signals intelligence company raised full-year revenue guidance to $225 million to $227 million from $215 million to $220 million. The stock had fallen 39.2% between its August and November reports.
The common thread is specificity. Each of these companies delivered a hard, quantifiable catalyst, whether a takeover bid, a guidance raise or a backlog record, that the market could price independently of Nvidia’s leadership crisis.
Microsoft’s Outage and Bitcoin Below $70,000 Widen the Risk-Off Circle
Microsoft (MSFT) fell 1.43% to $515.53 in early trading as a global outage disrupted Outlook, Teams and other Microsoft 365 services. Outage reports spread across 74 countries. For a company carrying one of the largest weights in both the S&P 500 and the Nasdaq-100, a 1.43% decline adds meaningful drag to indexes already under pressure from semiconductors. Microsoft’s capacity contracts with Nebius are part of the delays that pushed Nebius revenue into 2027.
Crypto markets confirmed the risk-off tone. Bitcoin fell 3.80% to $68,838.91, dropping below $70,000 for the first time since August and touching a low of $68,000 before a partial recovery. The world’s largest cryptocurrency is down more than 10% in November. More than $1.3 billion in crypto futures positions were liquidated over 24 hours, including $677 million in bitcoin positions. The average funding rate on bitcoin perpetual futures turned negative at $68,500 for the first time in a month, so short sellers are now paying longs, a sign that bearish positioning has become crowded.
The drivers overlap with equities. Macro risk aversion, persistent outflows from spot bitcoin ETFs and the unwinding of leveraged long positions all weighed on prices. A dollar near 19-month highs and real yields at multi-year peaks remove two of the main supports for non-yielding assets. On Wednesday, MSCI removed Strategy (MSTR), the largest public corporate holder of bitcoin, from two U.S. stock indexes, cutting off a source of passive demand for the stock.
Crypto-linked equities followed bitcoin lower. Coinbase (COIN), Robinhood (HOOD) and Circle (CRCL) fell in early trading. Bitmine Immersion (BMNR) slipped 1.14% in premarket trading on crypto weakness and scrutiny following its full-year report.
The overlap between bitcoin and the AI trade has become tighter in 2026. Both are long-duration, high-beta assets that depend on abundant liquidity and falling real rates. Both have rolled over since early fall, and both are now trading through key support levels as the 10-year climbs toward its October high. Bitcoin is also testing its 200-week moving average, a level that held through prior drawdowns. A break below that average would deepen the liquidation in crypto-linked stocks and add another source of forced selling to an already fragile growth complex.
Oil, Gold and the Dollar: The Macro Crosscurrents Behind the Tape
Crude oil is the variable that drives the inflation story, and it moved in both directions this week. On Thursday prices spiked after President Trump said the U.S. does not need a deal with Iran, reversing expectations that diplomacy would ease the Middle East supply risk. That spike pushed energy stocks to the top of the S&P 500 and triggered Thursday’s bond selloff.
Friday brought a mixed picture. December WTI crude traded at $89.45 per barrel, up 0.80%, after dipping 0.15% to $88.61 earlier in the morning. Brent crude rose 0.41% to $96.21. Both benchmarks are down sharply from late October, when WTI settled at $104.12 and Brent at $113.43.
Supply data argue for lower prices. U.S. commercial crude inventories rose 4.7 million barrels to 414.4 million in the week ended November 6, according to the Energy Information Administration, against expectations for a 700,000-barrel draw. Global forecasts now call for a supply surplus in the fourth quarter, the first since the U.S.-Iran war began. Geopolitics argue the other way. International inspectors said they are increasingly concerned over an undeclared enrichment plant at Isfahan, and Trump said he held off further strikes on Iran at the request of Gulf allies.
Gold is not acting like a safe haven. Gold futures rose 0.23% to $3,894.10 per ounce Friday, near their lowest levels of the year, while silver fell 0.35% to $49.89. Gold typically rallies during equity stress, but a 5.16% 10-year yield and a dollar near 19-month highs raise the opportunity cost of holding a non-yielding asset. The failure of gold to bid during a 1.85% Nasdaq decline shows how dominant the rates story has become.
The dollar is the transmission mechanism. A strong dollar tightens financial conditions globally, pressures emerging-market equities, and weighs on the overseas earnings of large U.S. multinationals, including the semiconductor companies that generate most of their revenue abroad. The yen at 160.10 per dollar has Japanese officials warning of intervention, which could trigger a sudden reversal in dollar strength and a disorderly unwind of carry trades.
For the equity market, the macro mix is hostile. Oil is high enough to keep inflation sticky, yields are high enough to compress valuations, and the dollar is strong enough to tighten conditions further. None of those three variables gave stocks relief on Friday, and the only data point that did, the 0.3% monthly PPI, lost its influence within 30 minutes of the open.
Breadth Versus Leadership: The Market Underneath the Index
The most important detail of Friday’s session does not show up in the index levels. Most S&P 500 stocks traded higher this morning even as the cap-weighted index fell more than 1%. All 11 S&P 500 sectors were on pace to close the week in positive territory as of mid-morning, despite three consecutive days of semiconductor selling.
That is the profile of a rotation, not a crash. Money is leaving the crowded AI leadership group and moving into the rest of the market. The Dow’s outperformance tells the same story. Through Thursday, the Dow was up 1.5% for the week compared with 4.32% for the Nasdaq, but Friday’s 0.27% Dow loss against a 1.85% Nasdaq loss shows the gap closing fast. Industrials, health care, consumer staples and financials are absorbing capital that has nowhere left to go in semiconductors.
The year-to-date numbers reinforce the shift. Through Thursday’s close the Russell 2000 led the major benchmarks with a 12.78% gain for 2026, ahead of the S&P 500 at 10.91%, the Nasdaq Composite at 9.14% and the Dow at 8.81%.
The breadth signal cuts both ways. Bulls can argue that a market where most stocks are rising is fundamentally sound, and that the index weakness reflects concentration in a handful of names that will eventually stabilize. If Nvidia steadies after Tuesday’s report, a market with participation this wide has room to recover quickly toward its October record.
Bears have the stronger near-term argument. The largest stocks drive the indexes, the ETFs and the passive flows. When the leadership group breaks, the rest of the market cannot generate enough upside to offset it, as Friday proves. The S&P 500 lost 82 points with most of its members up. If the selling spreads beyond semiconductors into the broader technology sector, the rotation money will not be enough to hold the index.
The Russell 2000’s behavior matters here. Small caps fell 1.66% Thursday, the worst of the four major indexes, as rising yields hit companies that depend on floating-rate debt. The index was down 0.51% Friday morning to 2,784. Small caps should be the beneficiary of a rotation out of mega-cap tech. Their inability to rally while the 10-year sits at 5.16% shows the rate ceiling is binding on every corner of the market, not only on growth.
Session Verdict: Bearish for the AI Complex, Mixed for the Broad Market
Friday’s session lands as bearish for the Nasdaq and the semiconductor sector and mixed for the broader market. The S&P 500 at 7,510.00 is down 1.09%, the Nasdaq Composite at 24,897.76 is down 1.85% and the Dow at 52,156.20 is down 0.27%.
The driver is not Nvidia alone. Jensen Huang’s resignation created the shock, but the 10-year Treasury yield at 5.16% turned a single-company governance crisis into a sector-wide de-rating. AMD fell 9.72% and Broadcom 6.77% a day after leading the S&P 500 higher. Applied Materials dropped 6.23% after a record $10.41 billion quarter. Cisco fell 5.41% after its fastest growth in 15 years. When companies beat estimates by wide margins and still lose 5% to 10% of their value, the problem is the price investors will pay for growth, and that price is set by the bond market.
The levels to watch are clear. On the S&P 500, the 7,500 round number is the first line, with Friday’s intraday trough testing it directly. Below that, the monthly support zone sits at 7,361, a level that would put the index 6.2% below its October record of 7,844.67. On the Nasdaq-100, the 200-day moving average is the line between a sector correction and a technical breakdown. On rates, the 10-year’s October high of 5.28% is the trigger for another leg of growth-stock liquidation.
The upside case requires two things. Nvidia must deliver a clean third-quarter report on Tuesday with guidance that reassures investors the business can run without its founder, and the 10-year yield must retreat back below 5%. If both happen, the market’s wide participation gives the S&P 500 a path back toward 7,845, a 4.5% gain from current levels, with a rebound in semiconductors adding the index weight needed to close the gap.
The downside case is just as specific. A disappointing Nvidia report, an export enforcement escalation tied to the China chip network, or a 10-year yield above 5.28% would extend the semiconductor liquidation and pull the S&P 500 through 7,500 toward 7,361.
For the week, the major indexes still hold gains, with the S&P 500 up just over 2% and the Nasdaq up just under 2.4%. The verdict for Friday is bearish on the tape that matters most: the AI complex lost its footing, rates refused to give equities relief, and the market heads into the weekend with Nvidia’s Tuesday report carrying the full weight of the bull case.