S&P 500 SPX Rises to 7,624, Nasdaq IXIC Gains 234 Points, Dow DJI Stalls as INTC Rips 4% Into Fed Decision
Chipmakers lead a narrow bounce as WTI slips to $103.20 | That's TradingNEWS
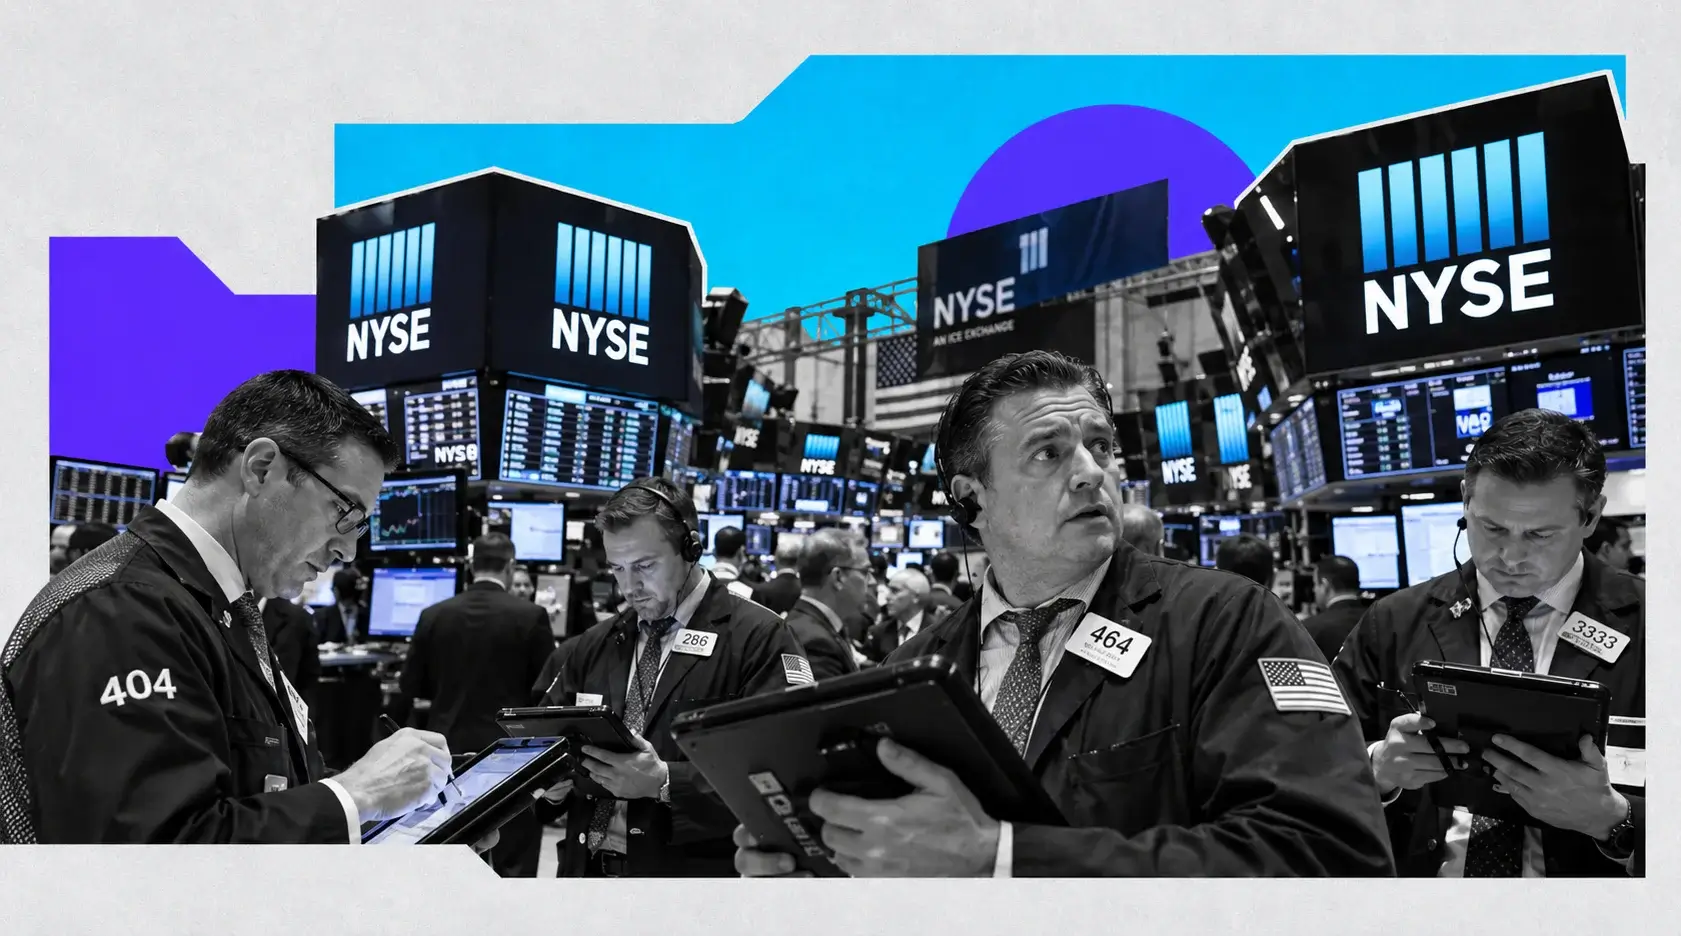
Wall Street spent the first two and a half hours of Wednesday, September 16, 2026, buying back part of Tuesday's damage, and the gains are real even if the conviction behind them is thin. Through late morning the S&P 500 (SPX) was up 0.5%, tracking at 7,624 against Tuesday's close of 7,585.73, a gain of 38 points. The Nasdaq Composite (IXIC) added 0.9%, lifting the index to 26,215 from 25,981.57, a move of 234 points driven almost entirely by semiconductors. The Dow Jones Industrial Average (DJI) sat just above the flatline at 52,093, unable to convert a softer oil price and a lower 10-year yield into blue-chip buying. The Russell 2000 was the most erratic of the four: it opened down 0.76% at 2,845, flipped to a 0.5% gain at 2,882 within minutes, and has chopped inside that 37-point band since.
Early readings put the move between 0.2% and 0.5% on the S&P 500 and between 0.4% and 0.9% on the Nasdaq depending on the minute. That spread tells you the market is trading on a hair trigger. The Invesco QQQ Trust was up 0.7% and sitting right on its 50-day moving average, a level that has capped every bounce attempt this month. The Vanguard S&P 500 ETF (VOO) printed $698.50, up 0.33%, just below the $698.56 premarket level from Tuesday. On a price basis, the benchmark ETF has gone nowhere in 48 hours.
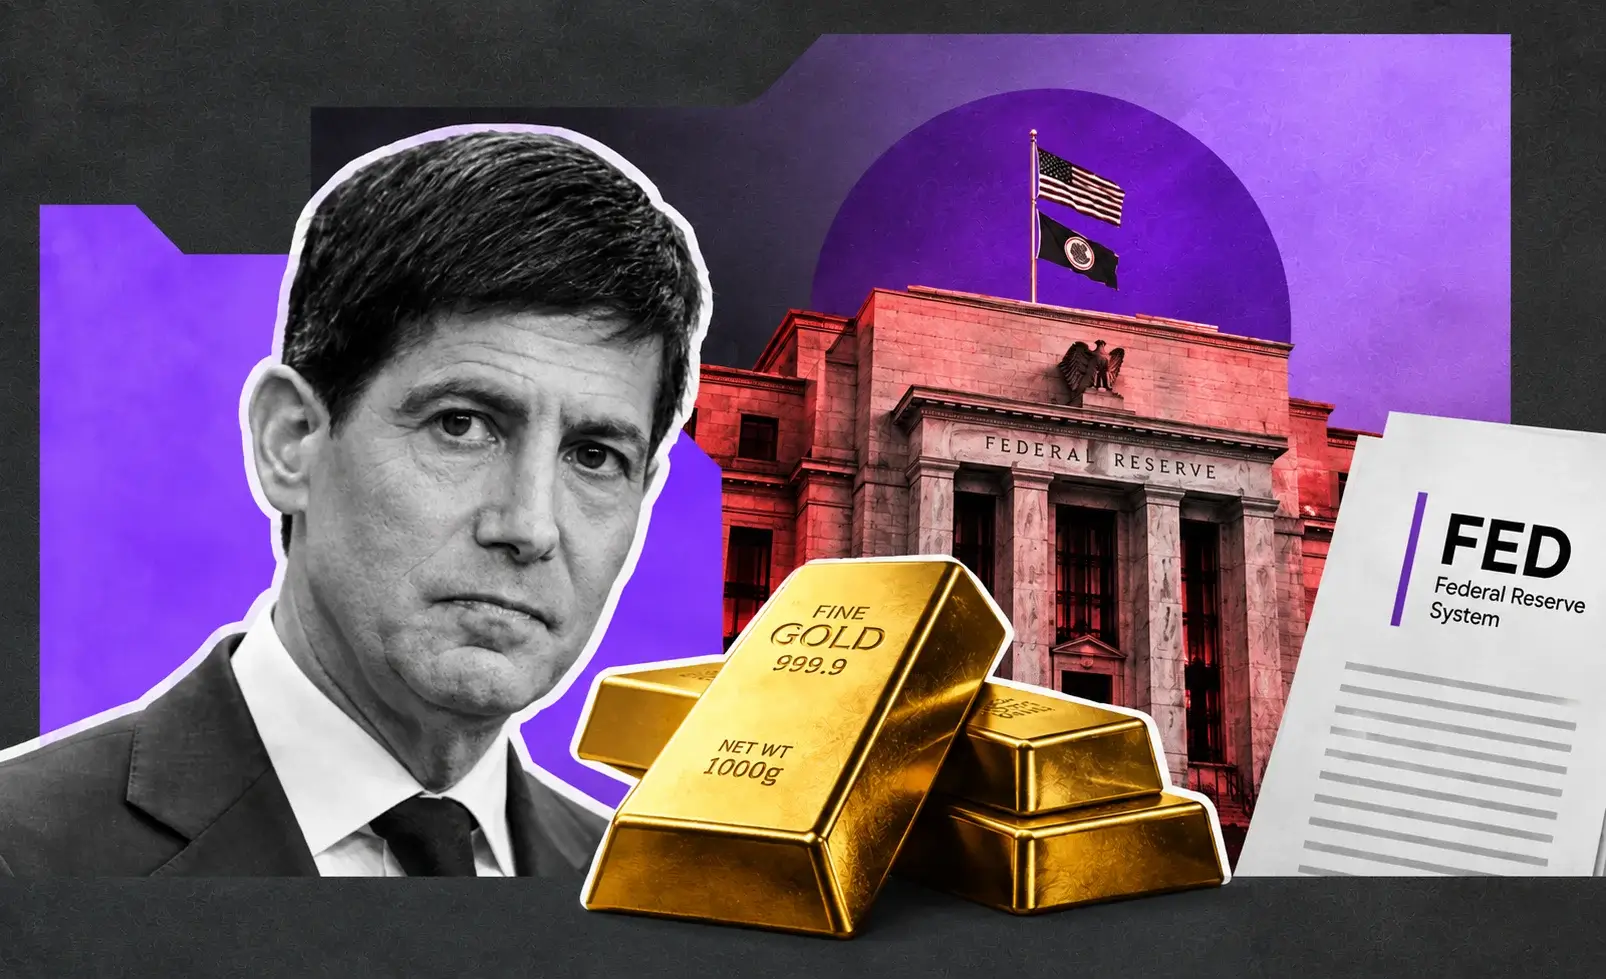
The reason is obvious. At 2:00 p.m. ET the Federal Open Market Committee releases its statement, its Summary of Economic Projections and the dot plot, and at 2:30 p.m. Chair Kevin Warsh takes questions. Fed funds futures carry a 92.9% probability of a 25-basis-point hike that would lift the target range from 3.50%–3.75% to 3.75%–4.00%, the first increase since July 2023. The hike is in the price. The path after it is not.
The rally is built on three props: WTI crude down more than 2% to $103.20, the 10-year Treasury yield back below 5% at 4.967%, and a chip rebound sparked by Intel (INTC) and SK Hynix (SKHY). Each of those props is directly exposed to what Warsh says this afternoon. A single hawkish sentence about oil-driven inflation could push the 10-year back through 5.045%, the intraday high set Tuesday, and erase the morning in minutes. The thesis for today's session is simple: this is a rented rally, and the dot plot decides whether the market owns it by 4:00 p.m.
How We Got Here: Tuesday's Selling and a Breadth Problem That Won't Go Away
Wednesday's bounce only makes sense against the backdrop of the last week. The S&P 500 fell for four straight sessions into September 10, when Brent crude hit $105 a barrel. It recovered on September 11 as inflation and oil inventory data came in less damaging than feared, then rolled over again on Monday, September 14, when prominent AI executives publicly called for a slower pace of model development on safety grounds and semiconductors took the heaviest hit. Tuesday extended the losses on the first day of the FOMC meeting.
The Tuesday closing numbers were ugly across the board. The S&P 500 dropped 0.45% to 7,585.73. The Dow lost 0.63% to 52,093.11. The Nasdaq Composite gave up 0.78% to 25,981.57. The Russell 2000 fell 0.86% to 2,867.27, its second straight decline of more than 1% intraday. Only two of eleven S&P 500 sectors finished green: Energy rose 1.9% and Materials added 0.32%. Consumer Discretionary got smoked for 1.98%, and Utilities, normally the hiding place when rates rise, fell 1.15%, which tells you the selling was driven by the discount rate rather than growth fears alone.
The internals were worse than the index prints. 63.7% of the 3,572 U.S. issues tracked declined on Tuesday. Only 32% of stocks finished positive. New 12-month lows expanded past 350 names against 100 new highs, a ratio of 3.5 to 1. That is not the signature of a market rotating calmly between leadership groups. It is the signature of a market being liquidated from the bottom up while a handful of mega-caps hold the headline averages together.
Tuesday's single-stock damage tracked the same themes. Enova International (ENVA) collapsed 24.24% after withdrawing its bank regulatory applications for Grasshopper Bancorp. Dave & Buster's (PLAY) sank 15.57% on a second-quarter loss and revenue miss. Axon Enterprise (AXON) lost 10.79% after announcing a $1.0 billion offering of 0% convertible notes due 2031. Coinbase (COIN) and Circle (CRCL) were crushed after the Senate vote on crypto legislation. On the upside, Skyworks Solutions (SWKS) jumped 10% on its pending $22 billion merger with Qorvo and Dell Technologies (DELL) ripped 5.65% on its $95 billion order backlog.
Wednesday morning's retail positioning data showed sentiment toward SPY and QQQ improving only from "extremely bearish" to "bearish." That is the starting point for today's bounce: oversold breadth, defensive positioning, and a crowd that expects the Fed to disappoint. Relief rallies from those conditions can be sharp, but they need a catalyst to survive past lunch.
Premarket to Open: Futures Lift, Oil Slips, the Russell Whipsaws
The overnight session set the tone early. Asian markets opened tentatively after four straight losing sessions for the regional MSCI index outside Japan, which was up 0.2% led by a 0.8% gain in Korean equities as SK Hynix's local shares jumped 4.08%. By 4:00 a.m. ET, Nasdaq futures were up 0.4%, S&P 500 futures had gained 0.1%, and Dow and Russell 2000 futures were flat.
By 6:20 a.m. ET the bid broadened. Dow futures were up 84 points, or 0.2%. S&P 500 futures had gained 17 points, or 0.2%. Nasdaq 100 futures had risen 127 points, or 0.4%. The contract levels read 7,666.25 on S&P futures, 52,535 on Dow futures, 29,340.25 on Nasdaq 100 futures and 2,895 on Russell 2000 futures. The VIX sat at 17.05, down 0.87%, a modest reading for a day with a binary central bank event and a market four sessions removed from a losing streak.
The premarket movers board split cleanly into two camps. Winners were AI hardware: Intel rose 3.84%, SK Hynix gained 3.36%, ASML Holding (ASML) climbed 2.86% as concerns about an AI spending slowdown eased, and Dell rose 2.45%. Trip.com Group (TCOM) added 4.33% after a second-quarter beat, and FTAI Aviation (FTAI) gained 2.87% on a new $500 million buyback. Losers were anything touching freight costs and oil: J.B. Hunt Transport Services (JBHT) tumbled 12.10%, Diamondback Energy (FANG) dropped 4.74%, Old Dominion Freight Line (ODFL) fell 4.34% and Chevron (CVX) slipped more than 1%. Sobr Safe (SOBR) plunged 35.91% on news of its Nasdaq delisting.
The opening bell at 9:30 a.m. delivered a split tape. The S&P 500 gained 0.25%, the Dow rose 0.15%, the Nasdaq climbed 0.44% and the Russell 2000 lost 0.76%. Within the first half hour the picture shifted: the Dow slipped to a 0.2% loss, the S&P 500 firmed to +0.3%, the Nasdaq extended to +0.6%, and the Russell 2000 snapped back to a 0.5% gain after two consecutive sessions of heavy losses.
That Russell whipsaw is the most honest signal on the board. Small caps carry floating-rate debt and live and die by the front end of the Treasury curve. A 1.26-percentage-point intraday reversal in the first 30 minutes shows traders flipping positioning on every tick of the 2-year yield. By late morning the Nasdaq had pushed to +0.9% as chip buying accelerated, while the Dow stalled at flat. The Dow's underperformance reflects its heavier weighting in energy, industrials and transports, the exact groups getting hit by the morning's oil reversal and the J.B. Hunt warning.
The Fed Decision: 3.75%–4.00% Is Priced, the Dot Plot Is the Trade
The Federal Reserve's policy rate has sat at 3.50%–3.75% since December 2025. The committee held at the July 29 meeting on a 9-to-3 vote, with three dissents, a split that foreshadowed today. One month ago, fed funds futures put the probability of a September hike at 33%. Wednesday morning that number stood at 92.9%. A 60-point swing in hike odds over 30 days is an aggressive repricing, and it happened because the inflation data and the oil market forced it.
The hike itself is not the question. Futures price a 39.1% probability of a second quarter-point increase at the October meeting and a 26.4% probability of another move in December. If the dot plot shows a median of two or more additional hikes through 2027, those October odds have to jump, the 2-year yield goes back above 4.671%, and equities reprice lower. If the dots show one move and done, the market has already overpaid for hawkishness and front-end yields can drop 10 to 15 basis points quickly.
Warsh has made a point of refusing to pre-signal decisions, arguing since July that markets should move on economic data rather than trying to game the Fed. At the July meeting he welcomed the rise in Treasury yields as a reflection of real economic developments. That approach has consequences: with no guidance from the chair, uncertainty going into this meeting is higher than at almost any FOMC decision in the last three years. At Jackson Hole on August 28, his statement that the Fed still has work to do on inflation sent the 2-year yield up more than 12 basis points in a single session.
The history of this Fed's press conferences is not comforting for bulls. On July 29, the Dow fell more than 1,000 points, or 1.9%, as Warsh spoke, the S&P 500 lost 1% and the 30-year yield surged 12 basis points to 5.21%. Markets had been expecting reassurance on the oil shock; they got a chair who refused to give it.
The political layer adds a second risk. The White House has escalated its demands for lower rates, and a hike today would put the Fed in direct conflict with the administration less than two months before the November midterms. A hold, which futures price at 7.1%, would be the bigger shock: it would raise immediate questions about the Fed yielding to political pressure, and the long end of the Treasury curve would likely sell off hard on credibility concerns even as the front end rallied.
Global central banks are moving in the same direction. The Bank of England decides Thursday after UK inflation accelerated again in August, and the Bank of Japan meets Friday, widely expected to hike to a 31-year high. The world's three most important central banks tightening in the same 72-hour window is a liquidity event, and equity valuations built on 2025's easing cycle are exposed to it.
The Treasury Curve: 10-Year Back Below 5% After Tuesday's 2007 High
The bond market is the engine of this week's equity weakness, and Wednesday's modest relief in yields is the main fuel for the bounce. On Tuesday the benchmark 10-year Treasury yield surged as high as 5.045% intraday, blowing through its 2023 peak to reach its highest level since 2007. It closed at 5.006%, up 4.5 basis points.
Tuesday's entire curve printed at stress levels. The 1-year yield closed at 4.37%, up 1.6 basis points. The 2-year hit 4.671%, up 3.7 basis points and a 52-week high. The 3-year closed at 4.774%, up 4.6 basis points, also a 52-week high. The 5-year settled at 4.837%, the 7-year at 4.918% (a 52-week high), the 20-year at 5.41% (a 52-week high) and the 30-year at 5.369%, after touching 5.39% intraday.
Wednesday morning the curve pulled back across every tenor. The 10-year yield dropped to 4.967%, 7.8 basis points below Tuesday's intraday peak. The 30-year bond eased to 5.348%. The 2-year yield fell more than 3 basis points to 4.627% after trading at its highest level since mid-2024. A soft regional manufacturing reading, which showed contraction in New York factory activity, and dip-buying after weeks of heavy duration selling helped the move.
The 2-year yield is the number to watch at 2:00 p.m. At 4.627% it sits 100 basis points above the midpoint of the current fed funds range and 88 basis points above the 3.75% ceiling. The bond market has already priced a hike plus meaningful follow-through. A hike accompanied by guidance for one move only leaves room for the 2-year to fall toward 4.50%. A dot plot showing a terminal rate of 4.50% in 2027 would validate current pricing and likely push the 10-year back through 5%.
The spread between the 10-year and 2-year yields stood at 34 basis points Wednesday, virtually unchanged from 33.5 basis points on Tuesday's close. The curve is not steepening on growth optimism or flattening on recession fears. It is shifting up in parallel, which points to a pure repricing of inflation risk and term premium.
Several forces are pushing long yields higher simultaneously: record corporate debt issuance to finance AI infrastructure, mounting federal borrowing, a war with Iran that the Congressional Budget Office estimates cost more than $38 billion through August 1 with $2 billion to $3 billion in additional monthly spending, and inflation expectations anchored above target by triple-digit oil.
The equity consequences are mechanical. Mortgage rates have neared or topped 7%. Weekly mortgage applications fell 2.7% in the prior week. Every 10 basis points on the 10-year raises the discount rate on long-duration growth earnings. That is why the Nasdaq is the biggest beneficiary of Wednesday's 3-to-4-basis-point dip in yields, and why it will be the biggest casualty if they reverse.
Inflation Inputs: 3.4% CPI, 3.7% PCE and a Consumer That Won't Slow Down
The Fed is hiking because the data left it no choice. The U.S. consumer price index rose 3.4% year over year in August, according to the Bureau of Labor Statistics release last Friday. The personal consumption expenditures price index, the Fed's preferred inflation gauge, increased 3.7% annually in July per the Bureau of Economic Analysis. Both readings sit well above the 2% target and are moving in the wrong direction.
The picture was different just a few months ago. In June, a brief drop in gasoline prices produced a surprise 0.4% monthly decline in CPI, and markets spent the early summer debating rate cuts. Hostilities in the Gulf resumed on August 30, crude went back above $100, and the disinflation narrative collapsed in six weeks.
Wednesday's economic calendar added fuel. August retail sales rose 1.2% from July, beating the 0.9% consensus and reversing July's decline. Consumers are still spending despite 3.4% inflation, which removes one of the Fed's reasons to wait. Retail sales excluding autos and gas were expected to rise 0.4% after a 0.2% drop in July. A stronger-than-expected spending print weakens any argument that the oil shock is already crushing demand on its own.
Trade price data shows the energy pass-through. Import prices were running 5.9% higher year over year as of the prior report, and export prices were up 8.2%. Those are pipeline inflation numbers, and they tend to show up in core goods prices with a lag of two to four months. The NAHB housing market index was expected to slip to 34 from 35 in September as rising mortgage rates squeeze builder confidence. Business inventories for July were expected to rise 0.2%.
Census data released this week showed median U.S. household income rising to the highest level on record, even as households report acute affordability stress. Rising nominal income plus rising prices plus strong retail sales is a wage-price dynamic that no central bank can ignore.
For equities, the inflation data creates an asymmetric setup at 2:00 p.m. The Fed's updated projections will include new core PCE forecasts for 2026 and 2027. If the committee lifts its 2026 core PCE estimate substantially and pairs it with a higher dot median, the market reads that as the start of a multi-meeting cycle. If the committee projects inflation falling back toward 3% in 2027 on the assumption that the oil shock fades, Warsh can frame today's move as a one-off recalibration. The retail sales beat makes the second framing harder to sell.
Oil Above $100: Saudi Rerouting Takes the Edge Off, the War Keeps the Floor
Crude oil is the single largest input into this week's rate repricing, and Wednesday's pullback gave equities room to breathe. West Texas Intermediate fell 1.80% to $103.90 a barrel early in the session and extended the slide to $103.20, a drop of more than 2%. Brent crude slipped 0.90% to $107.80. On Tuesday, WTI had jumped 2.64% to $104.10 and Brent had climbed 2.14% to $107.90 as attacks on Saudi infrastructure intensified supply fears. The WTI-Brent spread sits at $3.90.
The catalyst for the decline was logistics. Saudi Arabia is offering additional crude loadings to Asian refiners through ship-to-ship transfers off Oman's Sohar port after drone attacks damaged its main oil pipeline to the Red Sea. That rerouting reduced fears that the disruption would widen. Flows of crude, condensate and refined products through the Strait of Hormuz have held up despite escalating hostilities and may have climbed above 7.5 million barrels per day since fighting resumed on August 30. The link between military developments in the strait and physical barrels has weakened.
The geopolitical risk has not faded. The Congressional Budget Office put the war's cost to the U.S. above $38 billion through August 1. A separate Defense Department inspector general report counted four F-15 fighters destroyed and up to 30 MQ-9 Reaper drones lost, with damage to hundreds of structures at U.S. bases across Kuwait, Bahrain, Qatar, the UAE, Saudi Arabia, Iraq, Oman and Jordan. Saudi Arabia intercepted a Houthi drone launched toward Mecca on Wednesday, a claim the Yemeni group denied. Iranian Foreign Minister Abbas Araghchi met Chinese Foreign Minister Wang Yi in Beijing, where China pledged to safeguard Iran's interests. Treasury Secretary Scott Bessent pressed financial institutions on Iran sanctions enforcement.
Energy equities are giving back Tuesday's outperformance. Diamondback Energy dropped 8% on the session after a 4.74% premarket loss, hit by the combination of lower crude, rising yields and geopolitical volatility. APA Corp. (APA) fell 5.2% one day after hitting a new 52-week high. Chevron slipped more than 1% premarket.
The problem for the inflation outlook is that $103 WTI is still an extreme price. Brent has held above $100 for most of September and hit $105 on September 10. Diesel prices are at records, as the J.B. Hunt warning made clear. A $4 dip in crude does not change the math for the Fed's 2026 inflation projections. It changes the math for traders who were short the equity market into a one-day event. That is why the relief bid in stocks is fragile: it rests on a commodity that can reverse 3% on a single headline from the Gulf, and the next headline is never more than a few hours away.
Chips Lead the Bounce: Intel and SK Hynix Talk U.S. Memory Manufacturing
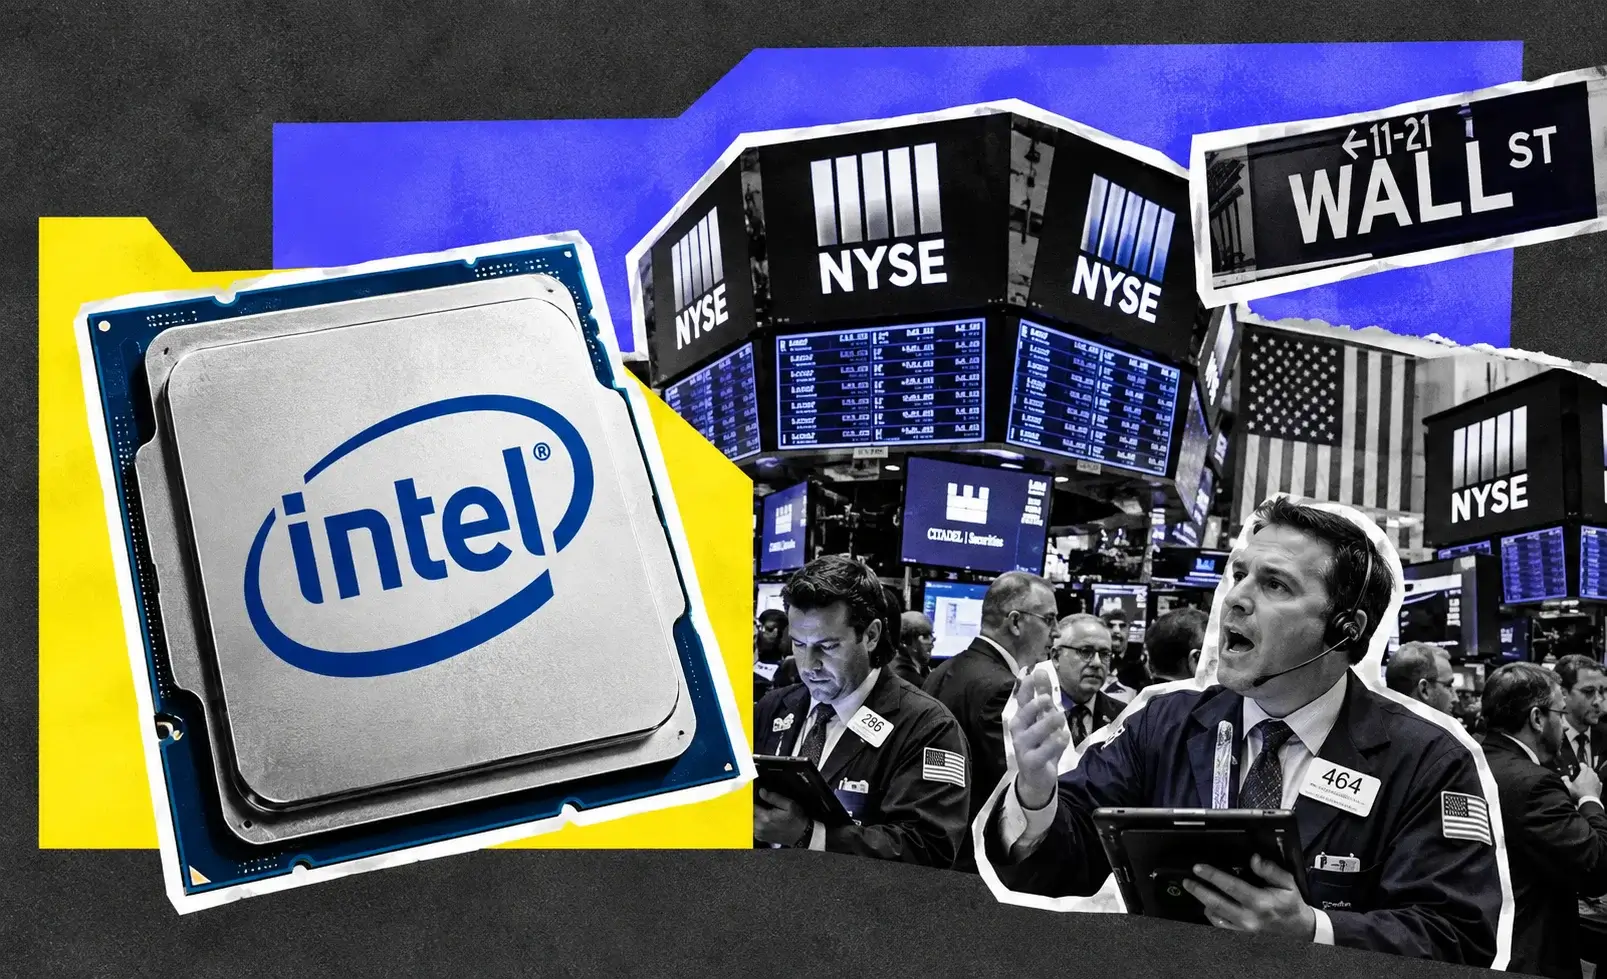
Semiconductors are carrying the Nasdaq's 0.9% gain, and the trigger was a report that SK Hynix is in talks with Intel about producing memory chips on U.S. soil for the first time. Intel shares climbed 3.33% to $100.37 in premarket trading and extended to a 4% gain after the open, putting the stock at $101 and briefly above the $100 psychological level. SK Hynix's U.S.-listed shares rose between 2% and 3.36% through the morning.
The structure of the talks matters for Intel's valuation. Under one scenario, SK Hynix would lease part of Intel's long-delayed chipmaking facility in Ohio. Under another, the two would form a joint venture with major cloud providers seeking to lock in memory supply. Either version gives Intel's foundry business something it has lacked for years: an anchor tenant with guaranteed volume. The Ohio site has been a capital drain with no committed customer; a lease deal turns it into a revenue line.
The obstacles are real. The talks are exploratory and no decisions have been made. SK Hynix said it is reviewing options including additional production bases but that nothing has been determined. The biggest hurdle is Seoul: high-bandwidth memory and advanced DRAM are classified as sensitive national technologies, and the South Korean government could block their production abroad. The administration's push for domestic chip manufacturing supports the deal from the U.S. side.
On the chart, Intel spent Wednesday morning trying to reclaim its 50-day moving average and remains 31% below its 52-week high. A close above $100 would be the first technical win for the stock in weeks. SK Hynix broke out past a cup-with-handle pivot at $178.43 last week and was trading right at that level before the bell, making $178.43 the line bulls need to hold on any post-Fed selling.
The rest of the group followed. ASML climbed 2.86% premarket as fears of an AI capex slowdown eased. Nvidia (NVDA) and Advanced Micro Devices (AMD) both traded higher, with Nvidia pushing toward its 50-day exponential moving average at $214.79. Monday's selloff came after prominent AI executives called for slower model development on safety grounds; Nvidia CEO Jensen Huang responded overnight that the industry does not need AI regulation.
The fundamental backdrop gives dip buyers cover. Broadcom (AVGO) reported fiscal third-quarter revenue of $29.59 billion, up 85.5% year over year, with AI semiconductor revenue of $16.7 billion, up 221%, now 56% of total sales. The demand numbers have not cracked. The chip rally is a positioning trade on top of intact fundamentals, which is exactly why it is the most rate-sensitive part of the market this afternoon.
AI Infrastructure Beyond Chips: Dell's S&P 100 Bid, Optical Names Rip, SpaceX Lifts
The AI hardware bid extended well past semiconductors. Dell Technologies rose 2.45% premarket and held gains after the open, riding two catalysts. The first is index inclusion: Dell joins the S&P 100 on September 21, a rebalance that forces index funds and benchmark-tracking portfolios to buy shares. The same rebalance adds Palo Alto Networks (PANW), Arista Networks (ANET) and SanDisk (SNDK), while removing Nike (NKE), Simon Property Group (SPG) and Colgate-Palmolive (CL). Passive buying into a Monday effective date gives Dell a mechanical bid through the end of the week regardless of what the Fed does.
The second catalyst is the business. In fiscal second-quarter 2027, ended in July, Dell reported revenue of $47 billion, up 58% year over year, with earnings per share more than tripling to $7.04. The company carries a $95 billion order backlog. Dell's stock has tripled in 2026 and gained 700% over three years, so every point of upside now depends on free cash flow catching up with reported earnings. Operating cash flow dropped to a $2.2 billion trough last quarter as the company funded its AI server ramp; the fiscal third-quarter report due around December 1 will show whether that was timing or a structural problem.
Optical and photonics names delivered the biggest percentage gains in the AI complex. Coherent (COHR) jumped 6% and Lumentum Holdings (LITE) rose 6% as buyers returned after a sector-wide pullback. Both stocks supply the high-speed transceivers and lasers that connect GPU clusters inside data centers, and both carried heavy losses from Monday's AI slowdown scare. A 6% rebound in two sessions tells you how crowded the short side had become.
Space Exploration Technologies (SPCX) gained 5.29% after the company confirmed Starship Flight 14 is scheduled for September 22, the first attempt to put the vehicle into orbit and the first deployment of Starlink V3 satellites. The mission plan calls for a flight time of nearly 10 hours at an altitude of 275 kilometers, completing six orbits before a Pacific splashdown west of Chile. SpaceX shares traded at $144.42 premarket, still 36% below their $225.64 record set on June 16, four days after the $135 debut in a record $86.3 billion IPO. CEO Elon Musk hinted this week at a possible combination with Tesla (TSLA), citing the Terafab semiconductor joint venture and Starlink terminals in the Cybercab robotaxi.
Private-market valuations reinforce the AI capital cycle. OpenAI is in early talks for a funding round above a $1.2 trillion valuation ahead of an eventual IPO. That kind of capital raising keeps the hardware order books full, which is why Monday's slowdown fear faded so fast.
J.B. Hunt's Warning: The Oil Shock Hits the Income Statement
The biggest loser among large caps Wednesday is the clearest evidence that $100 oil is no longer just a macro story. J.B. Hunt Transport Services tumbled 12.64% after CFO Brad Delco told investors at an industrials conference that the company expects earnings to decline 5% to 10% from the second quarter to the third quarter. The shares fell 12.10% premarket, got no bid at the open and have stayed near their lows all morning.
The mechanics of the warning are specific. J.B. Hunt expects roughly $25 million in additional third-quarter costs for driver recruiting, advertising, onboarding, training and sign-on bonuses versus the second quarter, which management framed as preparation for growth. On top of that, record diesel prices and what the company called some of the most abnormal fuel swings in its history are creating a fuel headwind of at least $10 million. Combined, that is $35 million in new quarterly pressure, equal to 13.5% of the $259.5 million in operating income the company reported for the second quarter.
The math on earnings per share is direct. J.B. Hunt earned $1.91 per diluted share in the second quarter on GAAP net earnings of $181.0 million, up from $1.31 a year earlier. A 5% to 10% sequential decline implies third-quarter EPS between $1.72 and $1.81. Rapidly rising drayage costs and delays in recovering fuel surcharges from customers compound the pressure. The company rarely issues intra-quarter updates, which amplified the market's reaction.
The cost pressure was already visible in the last report. Second-quarter revenue grew 19% year over year to $3.50 billion and operating income rose 32%, but purchased transportation costs in the Integrated Capacity Solutions segment jumped 54% year over year. The Truckload segment also flagged third-party capacity costs as a headwind. Intermodal generates roughly half of quarterly revenue, and management still expects strong demand in that segment heading into bid season. The company had $791 million remaining on its buyback authorization at June 30 with 93.9 million shares outstanding.
The damage spread across transports. Old Dominion Freight Line fell 4.34% premarket on concerns over slowing trucking momentum, rising operating costs and a premium valuation. J.B. Hunt is a component of the Dow Jones Transportation Average, and its warning is a major reason the Dow is lagging the S&P 500 and Nasdaq.
For the Fed, this is the key data point of the day. A logistics bellwether reporting record diesel, rising wage costs for drivers and difficulty passing fuel surcharges to customers is textbook cost-push inflation feeding into the next round of price increases. It is exactly the second-round effect the committee is hiking to prevent.
Crypto After the Clarity Act Collapse: Bitcoin Under $76,000, Stocks Still Bleeding
Crypto is the one risk asset not joining Wednesday's bounce. Bitcoin fell 1.13% to $75,716.63 in early trading after dipping briefly toward $75,000, extending a 3.8% slide on Tuesday. Coinbase and Circle are trading lower again after the sharpest single-session drops for both stocks in 2026.
The trigger was the Senate. On Tuesday, the motion to advance the Digital Asset Market Clarity Act failed on a 49-50 vote, far short of the 60 votes needed for cloture. All Democrats voted no, joined by four Republicans: Susan Collins, Josh Hawley, Jerry Moran and Thom Tillis. Tillis entered a motion to reconsider, but the House will not act before the November elections. Republican leaders had released a revised version on Sunday with new ethics restrictions targeting officials profiting from crypto ventures, and those changes did not move enough votes. Senate Majority Leader John Thune had called the bill the next step after last year's stablecoin law.
The bill would have split oversight between the SEC and the CFTC, set registration requirements and given the CFTC authority over spot crypto markets. Prediction-market odds of the bill being signed into law in 2026 collapsed from a 29.5%–34% range on Monday to 6%–7% after the vote.
The equity damage was severe. Coinbase closed Tuesday down 10.10% at $172.11. Circle settled 11.41% lower at $86.30. The two stocks lost $7.9 billion in combined market value in one session. Robinhood Markets (HOOD) fell 3% to $110.92, and Strategy, Galaxy Digital and the bitcoin miners all dropped sharply. The iShares Bitcoin Trust (IBIT) lost 3% to $43.26. Spot bitcoin ETFs saw $300 million in net outflows over the five sessions before a $160 million inflow on Monday, and bitcoin futures open interest fell 3.5% over seven days.
The Fed decision creates a strange counterweight for these stocks. Circle earns interest on stablecoin reserves, and by the company's own estimates each quarter-point increase in rates is worth $94 million a year in revenue. Coinbase generated $292 million in stablecoin revenue last quarter, 25% of net revenue, while transaction revenue fell 21.6% to $599 million. A hike today removes a regulatory catalyst and adds an interest income tailwind at the same time.
For bitcoin itself, the rate path matters more than the rate move. A one-time hike lets the market move past both the legislative setback and the yield spike. A signal of a sustained hiking cycle keeps real yields rising and keeps pressure on every non-yielding asset.
Read More
-
Yen Stalls at 160 Despite a 3% JGB and Tokyo Core CPI at 2.0% — Intervention Sits at 164, Friday's Payrolls Decide
02.09.2026 · TradingNEWS ArchiveEnergy
-
INTC ($104.13) Reclaims $100 as SK Hynix Talks Target Idle Ohio Fabs — 15.2% Path to $120
16.09.2026 · TradingNEWS ArchiveStocks
-
Bitcoin ($75,800) After $670M Liquidation Wave Before Fed Decision — 5.5% Upside to $80K
16.09.2026 · TradingNEWS ArchiveCrypto
-
Gold ($4,342) Holds 50-Day Average at $4,275 as Fed Decision Nears — 5.1% Upside to August Close at $4,563
16.09.2026 · TradingNEWS ArchiveCommodities
-
T-Rex 2X Inverse MSTR ($4.39) Rips 10.44% as Strategy Pauses Bitcoin Buys for a 2nd Week — $4.63 Close Opens $5.27
15.09.2026 · TradingNEWS ArchiveMarkets
-
EUR/USD (1.1540) Tests Monthly Low as Fed and ECB Hike Same Week — 93-Pip Upside to 200-Day at 1.1633
16.09.2026 · TradingNEWS ArchiveForex
Safe Havens and Volatility: Gold $4,388, Silver $65, VIX Stuck at 17
Gold and silver are rallying alongside equities, and that combination should make bulls uneasy. Gold futures surged 1.29% to $4,388.80 an ounce in early trading, up $68.70 from Tuesday morning's $4,320.10 print. Silver futures jumped 2.23% to $65.28, up $1.63 from Tuesday's $63.65. The gold-to-silver ratio sits at 67.2.
Precious metals rising on the morning of an expected rate hike runs against the textbook. Higher policy rates raise the opportunity cost of holding non-yielding assets, and gold typically sells off into hawkish Fed decisions. The fact that it is climbing tells you what a slice of the market thinks about the underlying problem: triple-digit oil, a war running $2 billion to $3 billion a month in U.S. costs, record federal borrowing and a central bank facing open political pressure from the White House. Gold is trading as a hedge against a Fed that might lose control of the narrative, not as a rate instrument.
Tuesday's pullback in metals came as the dollar strengthened on higher yields, Fed hike expectations and defensive demand. Wednesday's softer yields reversed that dynamic, and metals snapped back. Any hawkish surprise at 2:00 p.m. that sends the 2-year yield back toward 4.70% would likely pull gold back toward $4,320.
Volatility pricing is the other puzzle. The VIX sat at 17.05 early Wednesday, down 0.87%. For context, a VIX reading of 17 is consistent with a calm, trending market, not one sitting two days after a 10-year yield hit its highest level since 2007 and hours before a Fed decision with genuine path uncertainty. Unusual positioning in VIX options ahead of the decision points to traders buying protection further out the curve rather than in front-month contracts. The cheap front end means a hawkish surprise could trigger a sharp volatility spike as dealers scramble to hedge.
The July 29 precedent shows how fast that can happen. The Dow swung to a 1,000-point loss during Warsh's press conference that day after briefly rallying on the statement. A VIX at 17 does not price that kind of reversal.
Cross-asset, the morning reads as a market hedging in the wrong places. Equities are up, bonds are up, gold is up and silver is up, all at the same time, while crypto sells off on its own story. When everything except the most speculative asset rallies together into a binary event, the move is short covering and de-risking in reverse, not a new allocation. Positions put on this morning can be taken off in the first five minutes after the statement hits.
Homebuilders, Lennar After the Bell and What Decides the Close
The last scheduled catalyst of the day lands after the close. Lennar (LEN) reports fiscal third-quarter results at 4:45 p.m. ET, and the numbers will be read through the lens of whatever the Fed says two and a half hours earlier. Consensus calls for earnings of $1.30 per share, down 35% from $2.00 a year ago, on revenue of $8.37 billion, down 5% from $8.81 billion.
Lennar's own guidance frames the quarter. Management expects home deliveries between 20,500 and 21,500 units at an average selling price between $375,000 and $380,000, compared with 21,584 homes at $383,000 in the year-ago quarter. The 30-year fixed mortgage rate ranged between 6.48% and 6.66% from June through August, and it has since moved toward 7% as the 10-year yield broke 5%. That rate move happened after the quarter closed, which makes fourth-quarter order commentary more important than the reported numbers. In the second quarter, Lennar reported revenue of $7.94 billion, down 5.2%, with adjusted EPS of $1.31 beating estimates, and home sale gross margin improved to 15.6% from 15.2%. The stock traded at $79.65 heading into the report, with options pricing a 4.8% to 5.2% move.
Homebuilders are the purest rate play in the S&P 500. A hawkish dot plot pushes mortgage rates higher and hits the group twice: once at 2:00 p.m. on rates and again after 4:45 p.m. if Lennar's order commentary disappoints.
The close will be decided by three numbers from the Fed release. First, the median 2026 and 2027 dot: one additional hike or fewer supports the morning rally, two or more reverses it. Second, the core PCE projection for 2027: a forecast back toward 3% gives Warsh cover to call today a recalibration. Third, the vote count: any dissent in favor of a larger 50-basis-point move would be read as a hawkish tail and would hit the Russell 2000 and the Nasdaq hardest.
Levels to watch into the final 90 minutes: 7,585.73 on the S&P 500, Tuesday's close and the line between a bounce and a failed bounce; 25,981.57 on the Nasdaq; 52,093.11 on the Dow; 5.045% on the 10-year yield, where a retest would signal the bond market rejected Warsh's message; and 4.671% on the 2-year, which would confirm the market is pricing a cycle rather than a single move.
Session Verdict: Mixed, Leaning Bearish Until the Dot Plot Proves Otherwise
Wednesday's tape through midday is a textbook relief rally, and the details argue against trusting it. The Nasdaq's 0.9% gain rests on a narrow set of AI hardware names: Intel up 4%, SK Hynix up as much as 3.36%, Coherent and Lumentum up 6% each, Dell riding an S&P 100 inclusion bid. The S&P 500's 0.5% advance to 7,624 is being pulled by that same cluster. The Dow is flat at 52,093 because energy, transports and industrials are absorbing real damage from a $4 drop in crude and a trucking bellwether warning of a 5% to 10% sequential earnings decline. The Russell 2000 swung 1.26 percentage points in the first half hour and has not picked a direction.
Participation is the problem. Tuesday ended with 63.7% of issues declining, 350 new 12-month lows against 100 new highs, and only 32% of stocks in the green. A morning bounce led by a single sector does not repair that breadth. Crypto equities are still bleeding after Coinbase and Circle lost $7.9 billion in combined market value, and the one asset class with no rate story behind it cannot find a bid.
The macro inputs have not changed direction; they have paused. The 10-year yield is at 4.967%, only 7.8 basis points below a 19-year high. WTI is at $103.20 and Brent at $107.80. August CPI ran 3.4%, July PCE ran 3.7%, and retail sales just beat at 1.2%. J.B. Hunt put a number on the pass-through: $35 million in new quarterly cost pressure from diesel and driver wages. Gold at $4,388.80 and silver at $65.28 rallying into a hike tells you part of the market is hedging a policy mistake, while a VIX at 17.05 tells you the options market is not paying for one.
The 25-basis-point hike to 3.75%–4.00% carries 92.9% odds and will not move the tape by itself. The dot plot and Warsh's framing will. The July 29 press conference produced a 1,000-point Dow reversal, and this chair has spent three months refusing to give markets any guidance. With the 2-year yield already 100 basis points above the fed funds midpoint, the bond market has priced a hawkish outcome, which gives stocks some room if the dots show one more move and stop. That is the bull case, and it is narrow.
The verdict for September 16 is mixed with a bearish lean: indices are green, breadth is not confirmed, leadership is concentrated in the most rate-sensitive sector, and the inflation and oil data behind this week's selloff remain in place. Until the S&P 500 holds above Tuesday's 7,585.73 close through the 2:30 p.m. press conference and the 10-year stays below 5%, this morning's gains are a position ahead of the event, not a trend.