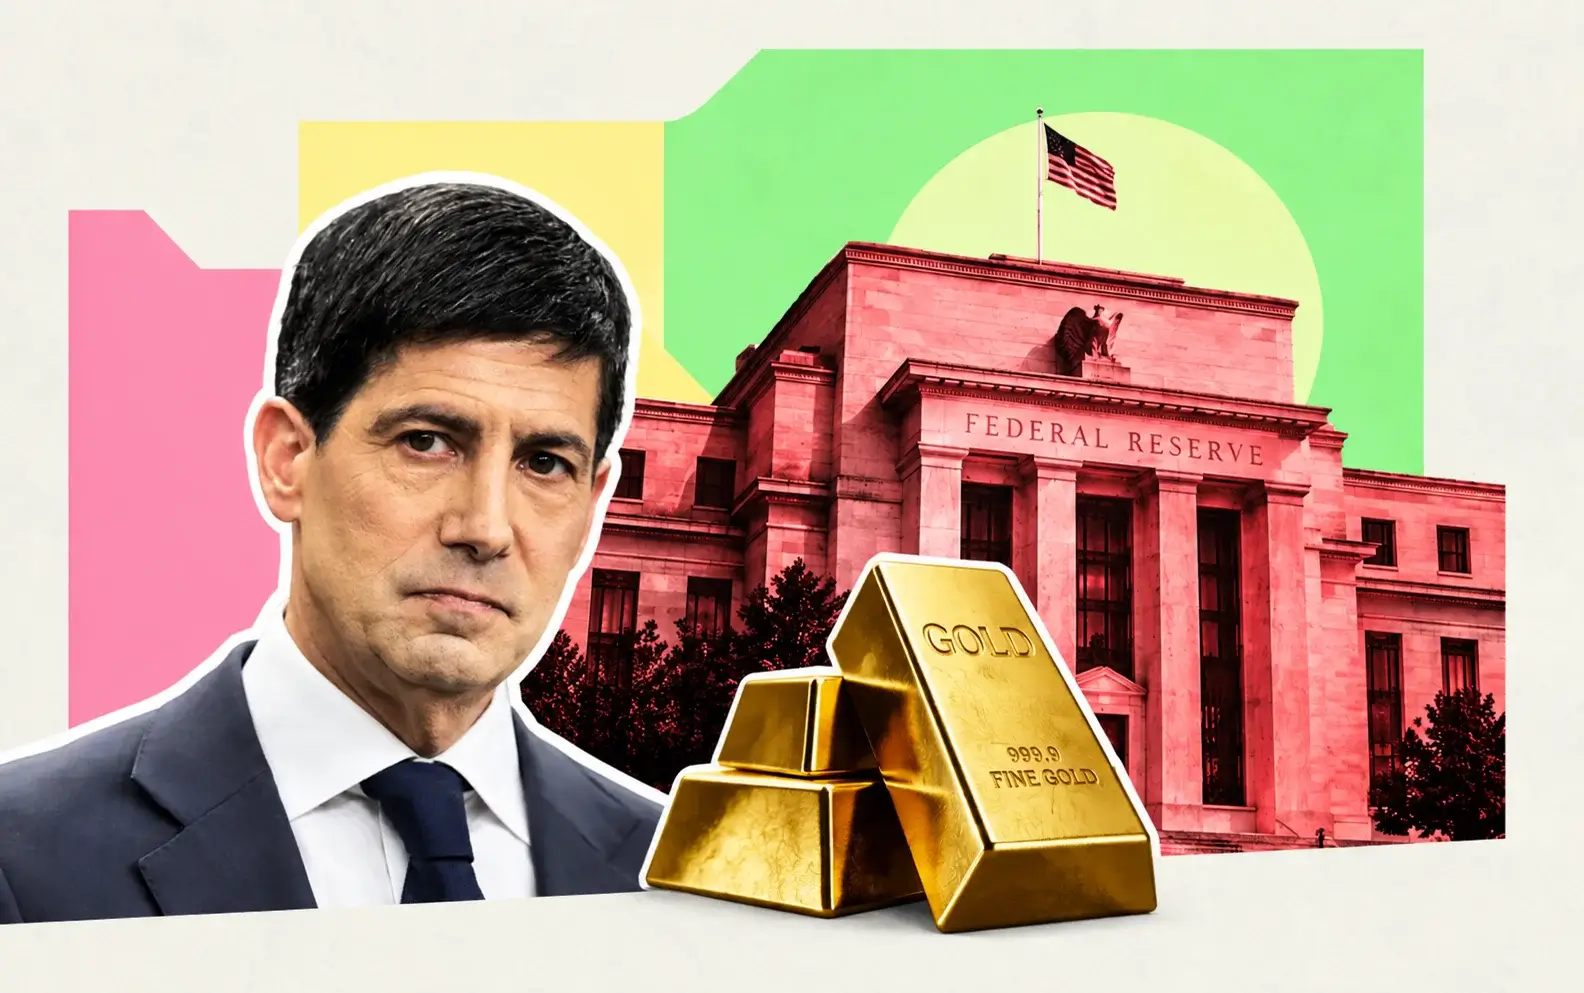
Gold ($4,342) Holds 50-Day Average at $4,275 as Fed Decision Nears — 5.1% Upside to August Close at $4,563
Record ETF holdings of 4,189 tonnes and 20.2 tonnes of August buying by China's central bank cushioned a two-day slide | That's TradingNEWS
Key Points
- Spot gold rebounded 1.16% to $4,342.50 after Tuesday's six-week low of $4,263.19 ahead of the Fed.
- China's central bank bought 20.2 tonnes of gold in August, its largest monthly purchase since October 2023.
- Gold must clear $4,354 resistance to open a path to $4,433 and the August close at $4,563.
Gold is doing something on Wednesday, September 16, 2026, that the textbook says it should not do: rallying into a rate hike. Spot gold traded at $4,342.50 an ounce in early U.S. hours, up 1.16% on the session, after bottoming at a six-week low of $4,263.19 on Tuesday. The rebound adds $79.31, or 1.86%, from that low. December gold futures pushed as high as $4,388.80, up 1.29%, while spot silver jumped 1.62% to $64.58.
The timing is what makes the move significant. At 2:00 p.m. ET, the Federal Open Market Committee releases a decision that fed funds futures price at a 92.9% probability of a 25-basis-point hike, lifting the target range from 3.50%–3.75% to 3.75%–4.00%, the first increase since July 2023. The 10-year Treasury yield hit 5.045% on Tuesday, its highest level since 2007. Higher policy rates and 5% long-term yields raise the opportunity cost of holding a metal that pays nothing. Gold should be under pressure. Instead, it is bid.
The explanation sits in why rates are rising. The yield surge is not coming from a strong, disinflating economy. It is coming from an oil supply shock that pushed WTI crude up 15% in September after attacks knocked Saudi Arabia's East-West Pipeline offline, from 3.4% consumer inflation, and from growing concern about U.S. fiscal sustainability after the Treasury's August 19 buyback announcement. Rates rising for those reasons strengthen the stagflation and debasement case that underpins gold's long-term bid, even as they dent the short-term price.
Gold's broader position frames the forecast. At $4,342.50, the metal is 22.3% below its all-time high of $5,589.38 set on January 28, 2026, and 4.8% below its August close of $4,563. It is still up 18.53% from a year ago. August produced a 13% monthly gain, one of the strongest monthly returns in a quarter century, before hawkish Fed commentary and firm labor data reversed momentum in early September.
The thesis for this forecast is that gold has already absorbed the hike and is now pricing the path. A dot plot that frames today's move as a one-time response to an oil shock gives gold a clear run at $4,433 and then the $4,563 August close, a 5.1% gain. A dot plot signaling a multi-meeting tightening cycle reopens $4,261 and the $4,160–$4,180 support band. Structural demand from ETFs and central banks has set a floor far higher than the price action of the last two weeks suggests.
The Two-Day Drop: Monday -1.80%, Tuesday Six-Week Low at $4,263.19
Wednesday's bounce follows two sessions of heavy selling that tested gold's support structure after the August rally.
The damage started Monday, September 14. Spot gold fell 1.80% to $4,269.90, and spot silver dropped 2.50% to $62.75. The trigger was Friday's August Consumer Price Index release from the Bureau of Labor Statistics: headline CPI rose 0.4% in August, annual inflation held at 3.4%, and core CPI rose 0.3% against expectations for 0.2%. That hotter core reading, combined with oil back above $100, pushed markets to raise their expectations for Fed tightening sharply. The 10-year yield broke to its highest level since 2023.
Tuesday extended the decline. Spot gold traded at $4,263.19, down $53.15, or 1.23%, its lowest level since early August. Spot silver fell to $62.82. The gold-to-silver ratio sat at 67.86, barely changed from Monday, because both metals fell in tandem. Front-month Comex gold settled at $4,291.60, down 0.43%, and front-month silver settled at $63.236, down 0.4%.
The drivers on Tuesday were a three-part squeeze. First, energy: WTI crude had climbed 15% in September to near $99 before extending above $106 intraday, after Saudi Arabia shut its East-West Pipeline, the key route for bypassing the Strait of Hormuz, for what is expected to be several weeks. Second, the dollar: the U.S. Dollar Index climbed to 99.57, its highest level since September 3. Third, yields: the 10-year Treasury yield surged to 5.045% intraday, surpassing its 2023 peak.
Traders cut exposure ahead of the Fed rather than adding to shorts. Paper positioning thinned into the decision, which explains why the price decline stayed orderly and why the rebound came quickly once oil and yields eased.
The Tuesday low mattered technically. Gold tested its 50-day moving average at $4,275 and briefly traded below it, probing a $4,261 support zone. The failure to settle decisively below the 50-day line, followed by Wednesday's sharp recovery back above $4,320, turned Tuesday into a successful retest rather than a breakdown.
The two-session slide erased $172.89 from the September 10 trading range of $4,366 to $4,405, and $307.35 from the $4,570 area where gold traded in late August. Measured from the August close, the pullback amounted to 6.6% at the Tuesday low. For a metal that rallied 13% in a single month, a 6.6% retracement is a normal consolidation, not a reversal.
Futures and Spot: December at $4,388.80, the Basis and What It Signals
The relationship between spot and futures prices shows how professional traders are positioned into the decision, and it offers a cleaner read than headline percentage moves.
December Comex gold futures traded as high as $4,388.80 on Wednesday, up 1.29% from the prior session. Earlier in the session, the December contract traded at $4,365, up 0.8%, and at $4,371, up $38.20. Spot gold traded between $4,324.36 and $4,342.50 across the same morning hours. The spread between the December contract and spot runs at $46.30 at the high end.
That spread is almost entirely a carry calculation. With the fed funds rate at 3.50%–3.75% and expected to rise to 3.75%–4.00% this afternoon, the cost of financing a spot gold position for three months until December delivery works out to $43 on a $4,342.50 price. The observed basis sits right on that number. There is no stress premium, no backwardation and no sign of a physical shortage in the futures curve. The market is orderly and priced for a hike.
The carry math also shows one of the direct mechanisms by which rate hikes pressure gold. Every 25-basis-point increase in short-term rates adds $2.71 to the three-month cost of carrying one ounce at current prices. For leveraged futures positions and bullion banks financing inventory, that cost compounds quickly across a hiking cycle. If the dot plot signals three more hikes, the annual carry cost of holding gold rises by $32.57 per ounce relative to today.
Overnight action set the tone. In Asian hours, spot gold rose 0.8% to $4,328.39, while December futures initially traded 0.9% lower at $4,369.50, reflecting the Tuesday settlement gap. By 0842 GMT, spot had reached $4,324.36, up 0.7%, and December futures had flipped to a 0.8% gain at $4,365.
Comex front-month settlement on Tuesday at $4,291.60 compares with Wednesday's futures high of $4,388.80. The session gain in the futures market, measured against that settle, runs to $97.20. Part of that gap reflects contract rollover dynamics between front-month and December, but the direction is unambiguous: futures buyers returned before the U.S. open.
The volume picture supports the view that the market has liquidity to absorb a large Fed-driven move. Average daily gold trading volumes rose 21% month over month in August across all major segments, including futures, OTC and ETFs. Deep liquidity reduces the risk of a disorderly gap after 2:00 p.m. but does not reduce the size of the potential move. Futures net longs expanded during August and were trimmed into this week, leaving room for fresh buying on a dovish outcome.
The Fed Decision: The Hike Is Priced, the Real Policy Rate Turns Positive
Gold's reaction to this afternoon's release depends less on the rate decision than on what the committee signals for the months ahead.
The federal funds rate has held at 3.50%–3.75% since December 2025. At the July 29 meeting, the committee held on a 9-to-3 vote, with three members dissenting in favor of a hike. At Jackson Hole on August 28, Chair Kevin Warsh reversed that stance, saying the Fed still has work to do on inflation. His remarks, together with strong labor data in early September, ended gold's August rally. One month ago, fed funds futures priced a 33% probability of a September hike. Wednesday morning, that probability stood at 92.9%.
The inflation data forced the shift. August CPI ran at 3.4% year over year. July PCE, the Fed's preferred gauge, ran at 3.7%, per the Bureau of Economic Analysis. August retail sales rose 1.2%, beating expectations, and the control group rose 1.4%.
For gold, the most important number is the real policy rate. With a hike to 3.75%–4.00%, the midpoint moves to 3.875%. Against 3.4% CPI, the real fed funds rate turns positive at +0.475%. Against 3.7% PCE, it sits at +0.175%. Gold historically performs best when real policy rates are negative and struggles when they rise meaningfully above zero. Today's hike takes real rates from slightly negative to slightly positive. It is the path after today that determines whether they climb high enough to damage gold.
Futures price a 39.1% probability of a second hike in October and a 26.4% probability of a move in December. In the June projections, the committee split nine officials above the current range, eight at no change and one projecting a cut, for a 3.8% median. Warsh did not submit a projection. If the September median jumps to 4.1% or higher, implying additional hikes, real rates head toward +0.75% and gold faces a durable headwind. If the median holds near 3.9% with 2027 easing, today reads as a single adjustment to an oil shock.
Warsh's 2:30 p.m. press conference carries the other half of the risk. His July press conference drove a 1,000-point intraday Dow reversal and a 12-basis-point jump in the 30-year yield. He avoids forward guidance on principle.
Political risk adds to gold's appeal. The White House has pushed for dramatically lower rates, and a hike puts the Fed in open conflict with the administration less than two months before the midterms. A Fed under political pressure is a classic gold catalyst.
Real Yields and the 10-Year at 5%: The Opportunity Cost Problem
The bond market is the single biggest headwind for gold, and the level of long-term yields explains most of the two-day selloff.
On Tuesday, the 10-year Treasury yield surged to 5.045% intraday and closed at 5.006%, the highest level since 2007. The 30-year yield touched 5.39%. The 2-year yield hit a 52-week high of 4.671%. On Wednesday, yields eased across the curve: the 10-year dropped to 4.967%, the 30-year to 5.348% and the 2-year to 4.627%. That 3-to-4-basis-point decline in yields is a direct contributor to gold's 1.16% rebound.
The real yield calculation shows the scale of the challenge. With the 10-year at 4.967% and August CPI at 3.4%, the realized real 10-year yield stands at 1.57%. Against July PCE of 3.7%, the real yield sits at 1.27%. An investor can now lock in more than 1.25% above inflation for a decade in risk-free government debt. Every basis point of that real return is income a gold holder gives up.
Mortgage markets confirm how tight financial conditions have become. A widely watched 30-year mortgage rate measure surged above 7% on Tuesday, reversing much of the relief borrowers saw earlier in 2026.
Yet gold is holding above $4,300 with the 10-year near 5%. That resilience would have been unthinkable in previous hiking cycles. In 2022, a much smaller move in real yields drove gold down 20% from its highs. The difference now is the source of the yield increase. Long-term yields are climbing because of record corporate debt issuance to fund AI infrastructure, mounting federal borrowing, war spending and inflation expectations anchored above target by triple-digit oil. The Congressional Budget Office estimates the Iran war cost more than $38 billion through August 1, with $2 billion to $3 billion added each month.
When investors see higher long-term borrowing costs as a warning sign about sovereign debt rather than a reward for economic strength, gold benefits even as yields rise. Gold's resilience through the bond selloff reflects that fiscal concern and a rise in U.S. political risk.
The key threshold for this afternoon is 5.045% on the 10-year. A hawkish dot plot that sends yields through that level would likely push gold back to its $4,275 50-day average. A measured message that holds the 10-year below 5% keeps the rebound intact and gives gold room to test $4,403.
The Dollar at 99.57 and the Oil Shock Feedback Loop
The dollar and crude oil are the two transmission channels between the Middle East war and the gold price, and both eased on Wednesday morning.
The U.S. Dollar Index climbed to 99.57 on Tuesday, its highest level since September 3, as higher Treasury yields, Fed hike expectations and defensive demand all supported the currency. A stronger dollar raises the price of bullion for holders of other currencies and reduces international demand. On Wednesday morning, the dollar traded mixed to firmer, but gold rallied through that resistance, which shows the metal's own bid is doing the work rather than dollar weakness alone.
Oil drives the inflation side of the equation. West Texas Intermediate crude traded at $103.70 on Wednesday, down from Tuesday's intraday high above $106, and Brent crude traded at $107.60. The decline came from two sources: a surprise increase in U.S. crude inventories and reports that Saudi Arabia is offering additional crude cargoes to Asian refiners through ship-to-ship transfers off Oman's Sohar port, bypassing its damaged pipeline. Flows through the Strait of Hormuz have held above 7.5 million barrels per day since fighting resumed on August 30.
The geopolitical picture keeps oil's floor high. Saudi infrastructure remains disrupted, Houthi forces have increased their presence near the Bab el-Mandeb Strait, and Saudi Arabia intercepted a Houthi drone launched toward Mecca on Wednesday. Iran's foreign minister met China's foreign minister in Beijing, where China pledged to safeguard Iranian interests. Brent hit $105 on September 10 and has held above $100 for most of the month.
The feedback loop is uncomfortable for gold in the short term and supportive in the long term. Higher oil lifts inflation, which forces the Fed to hike, which lifts yields and the dollar, which pressures gold. At the same time, higher oil threatens growth, raises war costs and deepens fiscal deficits, all of which support gold's role as a store of value. On Monday and Tuesday, the first half of that loop dominated. On Wednesday, with oil down more than 2%, the pressure eased and gold's structural bid reasserted itself.
The equity market shows how gold is trading relative to other risk assets. The S&P 500 rose 0.5% and the Nasdaq added 0.9% on Wednesday morning, while bitcoin fell 1.13% to $75,716. Gold rising alongside equities while bitcoin falls confirms that capital seeking a hedge against war, deficits and policy risk is choosing bullion over digital assets.
Inflation Data: 3.4% CPI, 5.4% PPI and Why Gold Didn't Collapse
The inflation prints of the past week delivered the hawkish surprise that sent gold to its six-week low, and the details explain why the selloff stopped at $4,263.
August producer prices came in hot. Headline PPI rose 0.4% for the month and 5.4% year over year, a tenth above forecast, per the Bureau of Labor Statistics. Core PPI cooled to 0.2%. The mixed print pushed September hike odds to 60% on the morning of September 10, up from an August low of 31%.
August consumer prices sealed the case. Headline CPI rose 0.4% for the month, holding the annual rate at 3.4%. Core CPI rose 0.3% against a 0.2% forecast. Gasoline prices jumped 3.9% in August alone. The core miss shows that energy costs are spreading into goods and services beyond fuel. After the CPI release, hike odds climbed toward 90%.
Wednesday's retail sales report added to the pressure. August retail sales rose 1.2%, well above expectations, and the control group, which feeds directly into GDP calculations, rose 1.4%. July's reading had been a decline. The consumer side of the economy is firmer than forecast, which removes one of the Fed's arguments for waiting. Import prices were running 5.9% higher year over year in the prior report, and export prices were up 8.2%, confirming pipeline inflation pressure.
That combination, hot core inflation, 5.4% producer price growth and strong consumer spending, is the worst possible mix for gold on a short-term rate basis. It justifies not just a hike today but a real probability of more.
Gold's resilience against that data is the key signal. A 0.3% core CPI print against 0.2% expectations, in a market already bracing for tighter policy, produced a two-day decline of 1.80% and 1.23%. Gold did not break its 50-day moving average on a closing basis. Silver fell harder, but also held above $62.75.
The reason is that gold is increasingly trading inflation as a store-of-value case rather than a rate case. At 3.4% CPI and 3.7% PCE, a dollar held in cash loses purchasing power quickly. The Fed's policy rate, even after a hike, barely exceeds CPI. Gold surpassed its 1980 inflation-adjusted record high in January 2026, confirming that investors are treating it as protection against persistent inflation. Stagflation, with growth slowing under oil costs while prices stay elevated, has historically been one of gold's strongest environments.
Fiscal Dominance and the Treasury Buyback: The Debasement Floor Under Gold
The factor that most separates this gold market from previous hiking cycles is fiscal, and it explains why gold rallied 13% in August despite rising yields.
On August 19, the U.S. Treasury announced a surprise buyback program targeting longer-dated government bonds. The Treasury officially described it as a liquidity operation. Many investors read it as something closer to financial repression: an attempt to cap long-term yields that had been climbing on deficit concerns. That interpretation revived fears of dollar debasement and a narrowing path toward yield curve control.
The buyback came weeks after U.S. intervention to support the Japanese yen on July 31, which fueled concerns about broader government intervention in currency markets. Together, the two actions shifted the narrative from monetary policy to fiscal dominance, the condition in which government debt levels constrain the central bank's ability to fight inflation.
Gold responded immediately. The metal rallied through August to close the month at $4,563, a 13% monthly gain and the strongest monthly performance since January 2026. Global gold ETF data attributed the rally to rising ETF flows, increased futures net longs and heavy call option buying, with investment demand as the marginal driver.
The fiscal picture has not improved since. Long-term Treasury yields have climbed further, the 30-year reached 5.39% this week, and war costs keep adding to deficits. Treasury Secretary Scott Bessent defended the administration's fiscal posture before Congress this week. Without a credible plan to address debt and deficits, gold's appeal as an asset outside the sovereign debt system continues to build.
This creates a floor that rate hikes alone cannot remove. If the Fed hikes aggressively, long-term yields rise, the government's interest burden grows, and fiscal concerns deepen. If the Fed signals restraint, real yields fall and gold's opportunity cost declines. Both outcomes carry a bullish element for gold over a multi-month horizon. The only scenario that damages gold durably is aggressive hiking that crushes inflation without raising sovereign debt fears, and a 5.39% 30-year yield shows the bond market does not believe that path exists.
Rising global yields add weight to the case. With the Bank of England deciding Thursday after UK inflation accelerated again in August, and the Bank of Japan expected to hike to a 31-year high on Friday, high government debt burdens are becoming a global concern rather than a U.S.-only issue.
Read More
-
Yen Stalls at 160 Despite a 3% JGB and Tokyo Core CPI at 2.0% — Intervention Sits at 164, Friday's Payrolls Decide
02.09.2026 · TradingNEWS ArchiveEnergy
-
Semtech ($158) Holds $153 as Data Center Revenue Hits $100M and EPS Guide Jumps to $1.05 — 12% Path to Record High
16.09.2026 · TradingNEWS ArchiveStocks
-
XRP ($1.28) Tests $1.25 Support as Commodity Status Survives Senate Defeat — 16.4% Upside to $1.49
16.09.2026 · TradingNEWS ArchiveCrypto
-
WTI ($103.20), Brent ($107.60) Hold Above $100 as 10M Barrels a Day Stay Shut In — 9.7% Upside to $118
16.09.2026 · TradingNEWS ArchiveCommodities
-
S&P 500 SPX Rises to 7,624, Nasdaq IXIC Gains 234 Points, Dow DJI Stalls as INTC Rips 4% Into Fed Decision
16.09.2026 · TradingNEWS ArchiveMarkets
-
GBP/USD (1.3480) Loses 1.3500 as Fed Hike Flips Rate Gap Against Bank Rate at 3.75% — 80 Pips to August Low at 1.3400
16.09.2026 · TradingNEWS ArchiveForex
ETF Flows: $18 Billion in August and a Record 4,189 Tonnes
Investment demand through exchange-traded funds provides the clearest evidence that gold's August rally was built on institutional allocation, not speculative momentum alone.
Global physically backed gold ETFs attracted $18 billion in August, the second-largest monthly inflow on record. North American funds led with $7.7 billion, their third-largest monthly inflow ever. European-listed funds added significant flows alongside. Total holdings rose 121 tonnes to a record 4,189 tonnes, and global gold ETF assets under management climbed 16% month over month to $615 billion.
At today's spot price of $4,342.50, those 4,189 tonnes, equal to 134.7 million troy ounces, are worth $585 billion. The $30 billion difference from August's $615 billion reflects the 4.8% decline in gold since the month-end close.
The record holdings level marks a sharp reversal from earlier in 2026. U.S.-listed gold ETFs recorded heavy outflows in the second quarter, including a sharp reduction in holdings in June, as quarter-end selling concentrated in American funds. Earlier data showed collective holdings at 4,068 tonnes, below the February 27 record of 4,176 tonnes. August's surge took holdings past that February high. Early-September data showed demand in tonnes turning positive for the full year.
The broader demand picture confirms a high-value market. Total gold demand, including over-the-counter trading, held flat year over year at 1,269 tonnes in the second quarter. First-half demand reached 2,522 tonnes, up 2% year over year, with a record value of $380 billion. Bar and coin investment rose year over year. Jewelry demand remained weak in volume terms as record prices hurt affordability.
For the forecast, ETF behavior over the next week is the critical signal. The SPDR Gold Shares (GLD) and iShares Gold Trust (IAU) account for the largest share of U.S. holdings. If today's Fed decision triggers ETF redemptions similar to the second quarter's pattern, gold likely retests $4,261. If holdings remain stable or rise despite a hike, it confirms that institutional investors view gold as a fiscal and geopolitical hedge rather than a rate trade, and the path back toward $4,563 opens.
The contrast with bitcoin is sharp. On Tuesday, spot bitcoin ETFs lost $450.33 million in one session, their worst outflow since June 25. Gold ETF holdings remain near record levels. In a market choosing between hard assets, capital is choosing gold.
Central Banks: The People's Bank of China Adds 20.2 Tonnes in August
Official sector buying is the most durable source of gold demand and the least sensitive to Fed decisions, and the latest data shows it accelerating.
The People's Bank of China added 20.2 tonnes of gold to its reserves in August, its largest monthly purchase since October 2023. The addition lifted China's officially reported gold holdings to 2,387 tonnes. August extended the central bank's buying streak to 22 consecutive months. Gold's share of China's total foreign exchange reserves rose to 9%, up from 8% in July.
At $4,342.50, China's August purchase of 20.2 tonnes, equal to 649,400 ounces, is worth $2.82 billion. Its total holdings of 2,387 tonnes carry a value of $333 billion.
The timing and scale of China's buying matter for the forecast. The People's Bank bought its largest monthly amount in nearly three years during a month when gold rallied 13%. Central banks accumulating aggressively at rising prices signals strategic diversification, not opportunistic dip-buying. The motive is reserve resilience amid growing global economic uncertainty and geopolitical tension, specifically a desire to reduce exposure to dollar-denominated assets while the U.S. is at war and sanctions enforcement is intensifying.
Price action in yuan terms reveals an important nuance. The Shanghai benchmark gold price rose 8.4% in August, compared with 13% in U.S. dollars. The smaller yuan gain reflected appreciation in the Chinese currency and weaker domestic investment demand. Chinese retail demand for jewelry remained soft under record prices, but official buying more than offset that weakness.
The geopolitical backdrop reinforces central bank demand. China's foreign minister pledged this week to safeguard Iran's interests as the war continues. Treasury Secretary Bessent pressed banks on Iran sanctions compliance. The Justice Department is pursuing a $61 million crypto forfeiture tied to Iran-linked transactions. Every expansion of U.S. financial sanctions increases the incentive for central banks outside the U.S. alliance to hold reserves in an asset no government can freeze.
For price, central bank demand works as a floor rather than a trigger. Official buyers do not chase breakouts, and they tend to accelerate purchases on price weakness. A Fed-driven dip toward $4,261 or the $4,160–$4,180 support band would likely draw heavier official accumulation. That behavior supports the view that gold's downside after a hawkish Fed is limited to 2% to 4%, while upside on a dovish outcome extends toward the August close.
Silver, Platinum and Palladium: The Ratio at 67.24 and Industrial Demand
The rest of the precious metals complex is confirming gold's rebound, with silver outperforming on Wednesday.
Spot silver traded at $64.58, up 1.62%, while silver futures jumped 2.23% to $65.28. Silver's Tuesday low of $62.75 now sits $1.83 below the current price, a 2.9% recovery. Front-month silver settled at $63.236 on Tuesday. The gold-to-silver ratio has dropped to 67.24 from 67.86 on Tuesday, a decline that shows silver gaining on gold.
Silver's technical setup mirrors gold's. The metal needed a move above $64.00 to reopen upside, and it has now cleared that level. The next resistance band sits at $65.00 to $66.00. A successful break of that zone opens a test of recent highs near $68.00, a 5.3% gain from current levels. Silver fell harder than gold on Monday, dropping 2.50%, which reflects its higher volatility and thinner market.
Silver's fundamentals differ from gold's in one important way. Roughly 58% of silver demand comes from industrial uses, including solar panels, electronics and data-center wiring. That industrial exposure makes silver sensitive to growth expectations as well as monetary factors. The silver market recorded its fifth consecutive annual supply deficit through 2025, with a sixth forecast for 2026. A persistent deficit does not guarantee a rising price in any given month, but it creates a market in which investment demand competes against a supply shortfall that mining output has not closed in five years.
AI infrastructure spending supports the industrial case. Data center construction requires significant silver content in electrical components, and demand from that sector continues to grow even as consumer electronics demand slows.
Platinum and palladium showed mixed trading. Spot platinum rose 0.7% to $1,788.25 in Asian hours before easing 0.2% to $1,771.65 by European trading. Spot palladium gained 1.6% to $1,309.80 and then held a 1.2% gain at $1,304.94. On Tuesday, platinum had risen 0.8% to $1,773.13 and palladium 0.5% to $1,299.76.
For the gold forecast, a falling gold-to-silver ratio during a rebound is a constructive signal. When silver leads gold higher, it typically shows investors adding risk within precious metals rather than seeking pure safety. A ratio moving back above 68.00 after the Fed decision would signal defensive positioning and a weaker gold outlook. A ratio falling toward 65 would confirm broad precious metals strength.
Gold miners carry leveraged exposure to all of this. Newmont (NEM), Barrick (GOLD) and the VanEck Gold Miners ETF (GDX) typically move two to three times the percentage change in gold, making them the highest-beta expression of today's Fed outcome.
The Technical Map: $4,354 Resistance, $4,275 50-Day, $4,160–$4,180 Support
Gold's chart has moved from a pullback toward a test of whether the August breakout holds, and the levels are tightly defined.
Immediate resistance sits at $4,354.00, $11.50 above the current price. Spot gold needs to push back above that level to confirm the rebound. A sustained move above $4,354 targets $4,366, the breakout level from the September 10 range, then $4,403.00 and $4,433.00. The $4,403 to $4,433 band marks the upper end of trading from the September 3 session, when spot gold reached $4,437.08 and December futures hit $4,483.30.
Beyond $4,433, the next major target is $4,563, the August close. Clearing that level would bring gold back into the late-August range and put the February holdings record and higher targets back into play. The distance from current levels to $4,563 is $220.50, or 5.1%.
On the downside, the first support zone is $4,316 to $4,326, which acted as resistance on Wednesday morning before gold broke through it. That band is now support. A failure there sends gold back toward the 50-day moving average at $4,275, $67.50 below current levels, and then to Tuesday's six-week low near $4,261 to $4,263.19.
A daily close below the 50-day moving average at $4,275 would be the first significant technical damage since the August rally began. That break would open the next support range at $4,160 to $4,180, a 4.0% to 4.2% decline from current prices. Below that, broader downside targets near $4,007.83 and the July close near $4,038 come into view, though those would require a sustained hawkish repricing of the Fed path.
Monthly range estimates show how wide the outcomes are. September trading ranges for gold span $4,136 to $5,304 in some projections, a band that reflects both the downside risk from a hawkish Fed and the upside potential if fiscal concerns intensify. Upside scenarios extend to $4,821.84 over 30 days, while downside scenarios point to $4,007.83.
The early-September pattern offers a template. On September 2, gold slipped to its lowest level since August 7 on a strong dollar and rising yields, then rallied more than 1% the next day as the dollar retreated and yields eased. Tuesday's six-week low followed by Wednesday's 1.16% rebound repeats that pattern. The question is whether gold can follow through the way it did on September 3, when it reached $4,437.
Scenarios and Price Targets: $4,563 Retest Versus $4,160 Breakdown
Every driver in this analysis resolves at 2:00 p.m. ET. Three scenarios cover the realistic range of outcomes.
The bull case is a hike with a restrained path. The committee raises rates to 3.75%–4.00%, the median 2026 dot holds near 3.9% with no more than one additional move signaled, the 2027 dots show easing, and Warsh frames the decision as a response to an energy shock. In that outcome, the 2-year yield falls below 4.60%, the 10-year holds below 5%, the dollar index slips back from 99.57, and October hike odds fall from 39.1%. Gold clears $4,354 within the session, targets $4,403 and $4,433 inside the week, and extends toward the $4,563 August close as ETF buying resumes. Target: $4,433 in one week, a 2.1% gain, and $4,563 within three weeks, a 5.1% gain. Probability: 35%.
The base case is a hike with an ambiguous message. The dots move modestly higher, Warsh avoids committing, and bond yields hold near current levels. Gold chops between $4,275 and $4,403, retests the $4,316–$4,326 support band and holds its 50-day average on central bank and ETF demand. Target range: $4,275 to $4,433 through the end of September. Probability: 45%.
The bear case is a hawkish dot plot. The median 2026 dot rises to 4.1% or higher, 2027 dots show no easing, and Warsh signals that 3.7% PCE inflation requires further tightening. The 10-year yield breaks above 5.045%, the dollar index pushes through 100, and the Bank of Japan's Friday hike adds to global tightening. Gold breaks $4,275 on a closing basis, retests $4,261 and slides into the $4,160–$4,180 support range. Target: $4,170, a 4.0% decline. Probability: 20%.
The risk-reward favors buyers on a multi-week view. Downside to $4,170 is 4.0%. Upside to $4,563 is 5.1%, with scenario probabilities weighted toward the base and bull cases. Central bank buying and record ETF holdings reduce the likelihood that the bear case extends beyond $4,160.
The single variable to watch in the first 30 minutes after the release is the 10-year Treasury yield against 5.045%. A move below 4.95% supports the bull case. A break above 5.045% triggers the bear case.
Verdict: Bullish Above $4,275 — $4,433 First, $4,563 on a Restrained Dot Plot
Gold at $4,342.50 has already absorbed the worst of the Fed repricing. The metal fell 1.80% on Monday and 1.23% on Tuesday to a six-week low of $4,263.19 as August core CPI came in at 0.3% against a 0.2% forecast, PPI ran at 5.4% year over year, the 10-year Treasury yield hit 5.045%, and the dollar index climbed to 99.57. It did not break its 50-day moving average at $4,275 on a closing basis. On Wednesday, with oil back to $103.70 and the 10-year easing to 4.967%, gold rebounded 1.16%, December futures reached $4,388.80, and silver outperformed with a 1.62% gain.
The structural demand picture is stronger than the price. Global gold ETFs took in $18 billion in August and hold a record 4,189 tonnes. The People's Bank of China bought 20.2 tonnes in August, its largest purchase since October 2023, extending a 22-month buying streak. The Treasury's August 19 buyback revived debasement concerns that a single rate hike cannot erase, and a 30-year yield at 5.39% shows the bond market doubts the fiscal path.
The headwinds are real. A hike to 3.75%–4.00% turns the real policy rate positive at +0.475% against CPI. The real 10-year yield stands at 1.57%. The carry cost of holding gold rises with every additional hike, and futures price a 39.1% probability of another move in October.
The verdict is bullish above the 50-day moving average at $4,275. The first upside target is $4,433, a 2.1% gain, with $4,563, the August close, as the extended target for a 5.1% gain if the dot plot signals no more than one additional hike and the 10-year stays below 5%. A daily close below $4,275 invalidates the bullish view and sets a downside target of $4,160 to $4,180. The dot plot at 2:00 p.m. and Warsh's language at 2:30 p.m. decide which of those levels gold reaches first.