





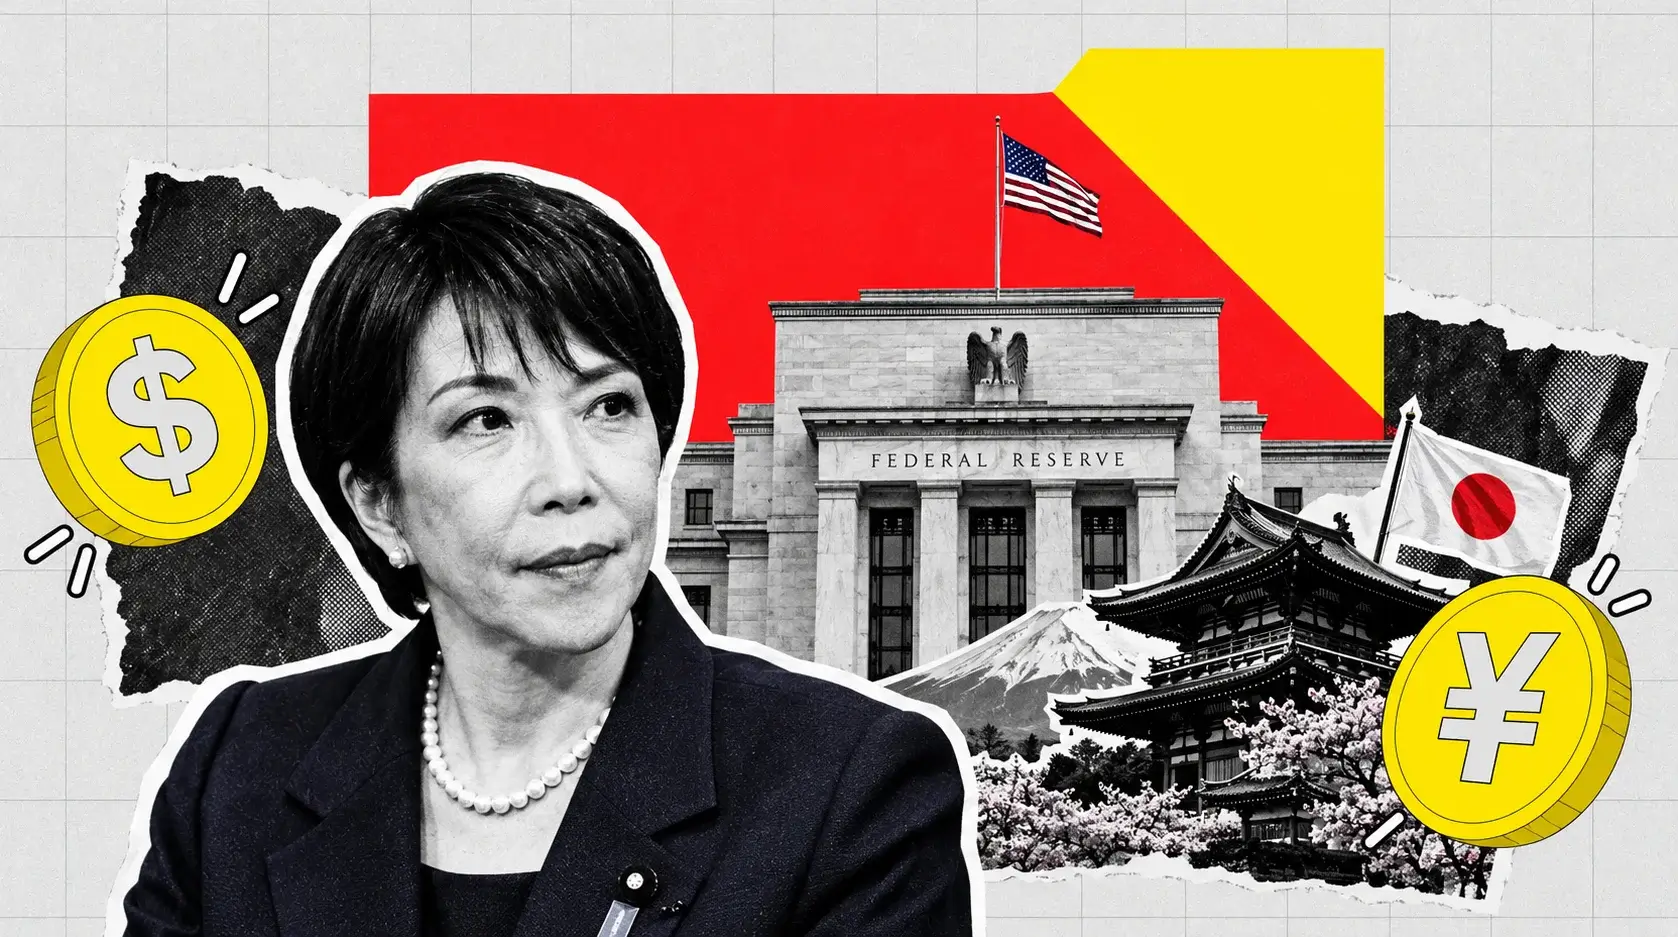
Yen Rips to a 7-Month High as the Carry Trade Unwinds — 155 Is the Line Before the Mid-140s
Board member Hajime Takata said a 25-basis-point step is not set in stone and back-to-back hikes are possible | That's TradingNEWS
Key Points
- USD/JPY fell to 152.89, down more than 4% in September, with the yen at a seven-month high.
- BOJ hike odds to 1.25% on September 18 sit at 97%, up from 52% a month ago.
- The Fed-BOJ differential is 262.5 basis points and stays there if both central banks hike.
USD/JPY fell to around 153.50 during the early European session on Tuesday and extended lower to 152.89 as the day progressed, putting the Japanese yen at a seven-month high against the dollar. The pair has now declined more than 4% in September alone.
That is a violent move by the standards of a major currency pair, and it has happened in six trading sessions.
The driver is not subtle. Money-market pricing now assigns 97% odds to a Bank of Japan rate increase of 25 basis points to 1.25% at its September 17–18 meeting, up from 52% a month ago. A 45-point swing in probability inside four weeks is what a repricing looks like, and the currency has responded accordingly.
The technical damage is already done. On the daily chart, USD/JPY holds well below both the Bollinger Band midline and the 100-day simple moving average, with a clearly bearish near-term bias. The pair has fallen through the floor of the 155-to-165 range that contained it for months, and 155 had been identified as more than a conventional support level.
The context makes the move more remarkable rather than less. The yen hit 40-year lows in July, weak enough to trigger a joint US-Japan intervention. Seven weeks later it is at a seven-month high. That is a complete round trip in a currency whose defining characteristic for the past four years has been one-directional weakness.
The broader dollar has not moved nearly as far. The Dollar Index closed Monday down just 0.25% at 98.91 and has been oscillating near 99.0 to 99.2. EUR/USD sits at 1.1611 and GBP/USD at 1.3544, both essentially unchanged on the week.
So this is a yen story, not a dollar story. Something specific to Japan is repricing, and the rest of the G10 complex is watching rather than participating.
The two central bank meetings that decide the next leg land within 48 hours of each other next week.
Four Percent in Six Sessions and the Floor That Failed
The speed of the decline is the detail that matters most for risk management.
USD/JPY extended its September fall beyond 4%, and the speed of the move suggests stop-loss orders and the unwinding of leveraged yen shorts have reinforced the direction. That is a mechanical accelerant rather than a fundamental one — each level broken triggers the next tranche of forced buying in yen.
The 155 level was the structural line. It sat at the bottom of the central trading range and functioned as more than ordinary horizontal support, marking the boundary between a market that trusted the carry trade and one that did not.
Losing it changed the character of the pair. Before the break, dips were bought on the logic that Japan's rate advantage was structurally negative and that carry flows would reassert. After the break, the same dips became opportunities to add to short dollar exposure.
The performance math on positioning illustrates how fast this has moved. A short recommendation entered at 159.70 targeting 149.0 with a stop at 164.0 was published less than a week before the pair printed 152.89. That entry-to-current move represents roughly 4.3% before carry and trading costs.
Carry is the important qualifier. Holding a short USD/JPY position means paying the interest differential every day — currently around 262.5 basis points annualised, or roughly 0.7% per quarter. That is the cost of being early, and it is what has punished yen bulls repeatedly since 2022.
For the first time in years, the price move is compensating for that cost within days rather than months.
Volatility has expanded accordingly. A pair that spent much of 2026 in tight ranges has produced multiple sessions of one-percent-plus moves in a single week, which changes position sizing for anyone trading it.
The immediate technical question is whether 152.89 holds as a short-term low or whether the momentum carries through toward the next structural reference. Nothing in the current momentum picture suggests exhaustion.
From a Forty-Year Low in July to a Seven-Month High
The round trip deserves examination because it explains why positioning is so lopsided.
The yen hit 40-year lows in July. That weakness was severe enough to prompt a joint US-Japan intervention — coordinated official action, which is rare and signals that both governments considered the level disorderly rather than merely uncomfortable.
USD/JPY reached 161 in July 2024, a level not seen since 1986. The 2026 lows in the yen exceeded that.
Intervention on its own rarely reverses a trend. What it does is buy time for fundamentals to change, and in this case they have. Between July and September, three things shifted: BOJ hike expectations moved from a coin flip to near-certainty, early signs of capital repatriation appeared, and US pressure on Japan over the currency added a political dimension.
That combination is what has taken the yen from a four-decade low to a seven-month high in under two months.
The structural backdrop supports the move on Japan's side. Wage growth above 3% and core CPI holding above 2% give the Bank of Japan room to hike, which is the precondition the market has waited on for two years. Inflation running above the 2% target has been cited by the Bank itself as the reason further hikes are likely.
The policy path has been slow but persistent. The Bank raised the policy rate to 1.00% on 16 June 2026, effective 17 June, after holding at 0.75% since December 2025. Yield curve control ended in March 2024, with rates moving from −0.1% to 0.25% by July of that year, then 0.50% in January 2025.
Roughly one hike per year from 2024, accelerating to two moves in the twelve months to December 2025, and a third in June 2026. Each move has carried outsized impact because the starting point is so low.
The Bank's calendar and statements are published at boj.or.jp.
September 18: Ninety-Seven Percent Odds, Up From Fifty-Two
The single most important number in this forecast is the probability shift.
Money-market pricing puts the odds at 97% that the Bank of Japan raises its key rate by 25 basis points to 1.25% at the meeting concluding September 18. A month ago that figure stood at 52%.
Beyond September, the same pricing shows a 27% chance of an increase in October and 61% odds in December. Those follow-on probabilities matter more than the September number, because a fully-priced hike produces no move when it lands — the reaction comes from what the Bank signals about the path afterward.
The meeting runs 17–18 September. The policy statement typically arrives around midday Tokyo time, with the Governor's press conference at 3:30 p.m. JST. The Bank does not publish its statement at a fixed time, which makes its decision days among the most volatile events on the global calendar.
The sequencing next week is tight and consequential. The Federal Reserve decides on 16 September with updated projections. The Bank of Japan follows on 18 September. Two days apart, both with live hike probabilities, both directly relevant to the same currency pair.
At 97%, the September move is done as far as the market is concerned. The trade is entirely in Governor Kazuo Ueda's communication and in whether the statement leaves October and December genuinely open.
The Bank's historical communication style complicates that. It is known for vagueness, and if the Governor stays vague the market reaction is typically small. If he sounds surprisingly direct about future increases, it confirms the aggressive expectations already building and produces a large, sudden move.
That asymmetry favours the yen at the margin, because 97% pricing on September means the surprise capacity sits almost entirely on the hawkish side of the guidance rather than on the decision itself.
Fed detail is published at federalreserve.gov.
The Vote Math: Eight-to-One in July, Seven-to-One in June
Board composition tells you how close the next move is, and the recent record is informative.
The June 2026 hike passed by a 7–1 vote, with Asada Toichiro preferring to hold. At the July meeting, the Board held at 1.00% by an 8–1 vote that rejected a proposal to go further, to 1.25%.
Read those two tallies together. In June, one member wanted to stay put and lost. In July, one member wanted to go to 1.25% and lost. The centre of gravity sat firmly at 1.00% for two consecutive meetings.
Earlier in the year the dissents ran the other way, with Takata Hajime and later two colleagues wanting to raise sooner. The growing number of dissents in favour of higher rates through early 2026 indicates the Board's centre has been shifting toward tightening for some time.
That shift is what makes the 97% September probability credible rather than speculative. A Board that already had a member voting for 1.25% in July needs only a modest change in the inflation or wage picture to deliver it in September.
The vote split at the September meeting will therefore carry information beyond the decision. A 25-basis-point hike passing 8–1 with a dissent arguing for a hold would signal that 1.25% is a terminal level for the near term. The same hike passing 7–2 with two members preferring 1.50% would signal an accelerating path and would take the yen materially higher.
Statements name every dissenter and give the vote tally, so the split is available immediately rather than in the minutes weeks later.
The Board meets eight times a year, normally in January, March, April, June, July, September, October and December, with the Outlook Report — the Bank's quarterly projections — released at four of them. Those Outlook meetings typically produce the largest market reactions because they carry updated inflation and growth forecasts alongside the decision.
The political layer has shifted as well. Prime Minister Sanae Takaichi has been characterised as dovish on monetary policy, but reporting has indicated government support for an earlier rate increase — a reversal that removes one of the constraints the Bank has historically operated under.
Takata's Comment and What "Back-to-Back" Would Mean
One board member's remarks last week are doing more work in this move than the probability numbers suggest.
Board member Hajime Takata said the central bank could take a more aggressive approach than expected. He stated that a 25-basis-point hike "is not necessarily set in stone," and that back-to-back rate hikes would generally be a possibility.
Two phrases in that. The first leaves open a larger single move — 50 basis points rather than 25, which is not currently priced anywhere. The second opens the door to consecutive meetings, which would mean September and October rather than September and then a pause.
Neither scenario is in the 97% number, which prices a single 25-basis-point step. The October probability sits at 27% and December at 61%, so a back-to-back path is roughly a quarter priced.
If the September statement or the press conference validates the back-to-back framing, the repricing in October probability alone would be worth several yen. Moving October from 27% toward 70% would carry USD/JPY through the next support cluster without requiring any change in the Fed's path.
That is the specific mechanism through which this could extend, and it is why the pair has continued falling even as the September hike moved to near-certainty. The market is no longer trading the September decision. It is trading the path implied by it.
Markets price Bank of Japan moves differently from Fed moves for structural reasons. Decades of dovishness mean traders need convincing that each hike is not the last, which historically has capped the yen's reaction to individual increases. Takata's comment attacks exactly that scepticism.
The counterweight is that individual board members speak for themselves. A single hawkish voice on a nine-member board is not policy, and the July vote showed the Board rejecting a move to 1.25% by 8–1 only weeks earlier.
The gap between what one member says and what the Board does is the risk in the current positioning.
The Differential Trap: Both Hike and Nothing Changes
Here is the arithmetic the momentum may be under-weighting.
The Federal Reserve's target range is 3.50% to 3.75%, a midpoint of 3.625%. The Bank of Japan's policy rate sits at 1.00%. The differential is 262.5 basis points.
If the Bank of Japan raises to 1.25% on 18 September and the Federal Reserve holds on 16 September, the gap narrows to 237.5 basis points — a 25-basis-point improvement for the yen.
If both hike, the differential returns to exactly 262.5 basis points. Nothing changes.
Fed funds futures price a September increase at roughly 58% to 60% following August payrolls of 162,000 against a consensus near 56,000, with unemployment steady at 4.1%. Employment detail is at bls.gov.
Multiply those probabilities and the modal outcome next week — both central banks hiking — leaves the rate differential precisely where it started. That is not a fundamentals-driven case for a lower USD/JPY.
The broader compression trend is real but slower than the price action implies. The differential has narrowed from roughly 325 basis points in early 2026 toward 250 to 275 basis points by the fourth quarter. Every 100 basis points of compression has historically correlated with a five-to-eight-yen move.
Apply that relationship. Compression of 62.5 basis points from early 2026 to now should have produced roughly three to five yen of USD/JPY decline. The pair has fallen from the July highs by considerably more than that.
The excess is positioning, not arithmetic. That is precisely why the stated path lower is framed around the size of the outstanding short-yen position rather than around a rate-differential target — a further unwind could push USD/JPY toward the mid-140s given the sizeable outstanding short position.
Positioning-driven moves are faster and less durable than differential-driven moves. They also reverse harder when they exhaust.
Read More
-
Yen Stalls at 160 Despite a 3% JGB and Tokyo Core CPI at 2.0% — Intervention Sits at 164, Friday's Payrolls Decide
02.09.2026 · TradingNEWS ArchiveEnergy
-
QQQ ETF ($706.22) Slides 7.4% Below Its High as the Market Reprices the AI Capex Bill — $686.57 Target if $700 Breaks
22.10.2026 · TradingNEWS ArchiveStocks
-
XRPI ($7.00) and XRPR ($10.74) Slide Toward 52-Week Lows as Spot XRP ETF Flows Stall at $708,510
22.10.2026 · TradingNEWS ArchiveCrypto
-
NG ($2.775) Decoupled From Europe’s €88 Gas Crisis as LNG Feedgas Hits 18.9 Bcf/d — $3.30 Upside on Cold Weather
22.10.2026 · TradingNEWS ArchiveCommodities
-
Dollar-Yen (157.35) Loses 157.65 as the Yen Rallies on Haven Demand — 155 Target if 156 Breaks
22.10.2026 · TradingNEWS ArchiveForex
The Carry Unwind and the Mid-140s Scenario
The carry trade is the dominant speculative force in this pair, and it is unwinding faster than expected.
The mechanics are straightforward. Investors borrow yen at low cost and invest in other currencies and assets offering higher yields. That trade has been extraordinarily profitable for four years because the funding cost was near zero and the yen kept depreciating, delivering return on both legs.
Rising Japanese rates attack both legs simultaneously. Higher funding costs reduce the carry, and a strengthening yen turns the currency leg from a tailwind into a loss.
Higher Japanese rates weaken the justification for maintaining large short-yen positions. If the Bank raises rates in September and maintains hawkish communication, the rationale for selling the yen weakens further.
The scale of outstanding positioning is what makes the downside path asymmetric. Years of one-directional yen weakness built an enormous short base, and unwinding it requires buying yen regardless of what the fundamentals say on any given day.
That is the mid-140s scenario. It does not require the rate differential to compress to a level that justifies 145. It requires enough leveraged shorts to be forced out.
The move is also no longer purely a positioning story. Early hints of capital repatriation and expectations of a faster tightening pace, combined with US pressure on Japan, are all contributing.
Traders are currently choosing to retrace their steps ahead of the pivotal central bank meetings, which is why volume and volatility have both risen while the direction has stayed one-way.
The self-reinforcing dynamic is the risk in both directions. Stop-losses accelerate the decline on the way down. If the Bank of Japan delivers a hike with dovish guidance — signalling that 1.25% is terminal — the same leverage reverses, and a squeeze back toward 157 would be equally fast.
Repatriation: Pension Funds and the JGB Rotation
The flow story underneath the positioning story is potentially more durable, and it centres on where Japanese institutional money is invested.
Speculation over a potential shift in the Government Pension Investment Fund's asset allocation has provided support for the yen. Separately, potential rotation from foreign bonds into Japanese government bonds among domestic investors, including pension funds, could support the currency.
The logic is arithmetic rather than sentiment. Japanese institutions hold enormous foreign bond portfolios accumulated over decades when domestic yields offered nothing. As JGB yields rise with the policy rate, the relative case for holding unhedged foreign debt weakens, and the case for bringing capital home strengthens.
The scale is what makes this significant. Japanese institutional foreign bond holdings run into the trillions of dollars. Even a modest reallocation percentage translates into currency flows that dwarf daily speculative volume.
Unlike the carry unwind, repatriation is not a positioning phenomenon that exhausts. It is a structural reallocation that would proceed over quarters and years as domestic yields become progressively more attractive.
That is the strongest argument for a durable yen recovery rather than a positioning squeeze, and it is why the current move has drawn more attention than prior yen rallies.
The qualification is that this has been anticipated for two years without materialising at scale. Japanese institutions have been slow to rotate, partly because the hedging costs on foreign bonds already reflected the differential and partly because domestic yields remained low in absolute terms even after the increases.
At a 1.25% policy rate, JGB yields would still sit far below Treasury yields at 4.80% on the ten-year and 5.27% on the thirty-year. The unhedged carry on US Treasuries remains substantial.
The rotation becomes compelling at Japanese policy rates closer to 2%, not 1.25%. That is a 2027 story rather than a 2026 one, unless the back-to-back path Takata described materialises.
The 2024 Precedent and Why This One Is Better Telegraphed
The reference point everyone is working from is August 2024, and the comparison cuts both ways.
The stakes of a disorderly unwinding were laid bare in 2024, when a Bank of Japan rate hike sent the yen higher, forced traders to abandon their carry trades and sent shockwaves across global markets for days.
That episode is why the current move is being watched so closely well beyond the FX market. A yen squeeze does not stay contained in USD/JPY — it forces liquidation of whatever the borrowed yen was funding, which in 2024 meant global equities and high-beta risk assets across multiple continents.
The critical difference this time is telegraphing. The 2024 hike was a surprise against dovish positioning. The September 2026 hike is priced at 97% with a month of lead time, which means the leveraged shorts most vulnerable to it have had time to reduce.
That should mute the disorderly component. Markets that see a move coming for four weeks do not produce the same cascade as markets that are ambushed.
The evidence supports partial de-risking already. USD/JPY has fallen more than 4% in September without any corresponding stress in global equities. The S&P 500 (SPX) slipped only 0.35% to 7,691.55 on Tuesday and the VIX held at 15.46 — nothing resembling the cross-asset contagion of 2024.
The counterargument is that the 2024 unwind also began quietly before accelerating. Positioning data lags, and the size of the outstanding short base is estimated rather than observed.
The scenario that would replicate 2024 requires a hawkish surprise on top of the priced hike — a 50-basis-point move, or guidance explicitly committing to October. Either would force the remaining shorts out simultaneously into a market that had already absorbed the expected outcome.
The probability of that is low. The consequence if it happens is high. That combination is precisely what options markets should be pricing, and it is why implied volatility in yen crosses has risen while spot volatility in EUR/USD has collapsed.
Oil at $99 Is the Yen's Hidden Problem
There is a fundamental force working directly against the yen that the current momentum is ignoring.
Japan imports nearly all of its energy. Brent crude climbed 2.3% to $99.22 on Tuesday, its highest since 24 July, after Houthi drone and missile strikes on Saudi Aramco facilities wounded 73 people and halted operations at several sites. WTI reached $94.60. European natural gas hit a three-and-a-half-year high above €73 per megawatt-hour, with Qatar under extended force majeure.
Every dollar of increase in energy prices is a direct terms-of-trade transfer out of Japan. A deteriorating trade surplus or rising import costs — particularly energy — weakens the yen mechanically through the current account.
The paradox is explicit in the current setup. The yen carries a long-standing reputation as a safe-haven currency, and during periods of global uncertainty investors typically buy it. But in 2026 the Middle East conflict has pushed oil higher, which weighs on Japan's import-heavy economy and has at times worked against the yen's usual safe-haven bid.
So the same geopolitical escalation that should generate yen buying on risk-off grounds is generating yen selling on terms-of-trade grounds. Those two forces have partially cancelled all year.
Japan is also competing directly for LNG cargoes. Japanese and Korean buyers are scrapping for shipments against European demand as both regions restock before winter, which means Japan is paying at the margin for scarce energy in a market where the marginal price has doubled.
That import bill lands in the trade balance over the coming quarters and is the strongest fundamental counterweight to the rate-differential story.
It also complicates the Bank of Japan's position. Energy-driven inflation is the least desirable kind to tighten into, because it is a tax on households rather than a sign of demand strength. A committee raising rates into an oil shock risks compounding a real income squeeze.
If crude sustains above $100 into winter, the terms-of-trade drag becomes large enough to cap the yen's recovery regardless of what the Bank does with rates.
Forecast Dispersion Runs From 149 to 165
The professional forecasting community disagrees about this pair more than about any other major, and the spread is worth mapping because it defines the plausible range.
The bearish USD/JPY camp targets 149 for year-end, roughly 2.5% below the current 152.89 low. That case rests on faster Bank of Japan tightening, the carry unwind, and scope for Japanese institutions to repatriate capital as domestic yields become attractive.
The bullish USD/JPY camp targets 164, arguing that structural dollar demand from Japanese corporates and persistent carry flows offset the rate-differential narrowing. One twelve-month forecast was revised to 165 from 155 on 6 July 2026 — a call made when the yen was at four-decade lows and one that has been badly wrong-footed since.
Aggregate bank forecasts range 150 to 164.
That is a 15-yen spread, or roughly 10%, on the same instrument for the same date. Currency forecasting is difficult everywhere, but a dispersion that wide on a G3 pair indicates genuine structural uncertainty rather than ordinary disagreement.
The dispersion also explains the price action. When professional views span 10%, the market has no anchor to mean-revert toward, and momentum runs further than fundamentals justify in both directions.
The forecasting record on this pair specifically should temper conviction. The 165 revision on 6 July preceded a 7% move the other way. Positions entered at 159.70 with a 164 stop have gained 4.3% in under a week.
Neither outcome was well-anticipated by consensus a month ago.
The practical implication is that anyone using published targets as a reference point should treat the 149-to-165 band as the plausible range rather than any point inside it as a forecast. That range spans the entire distance from a full carry unwind to a full resumption of dollar strength.
The determining variable is not currently a forecastable one. It is whether Governor Ueda's press conference on 18 September validates or deflates the back-to-back framing.
Levels: 155 and 157.48 Above, 150.83 and the Mid-140s Below
Consolidate the map.
Resistance begins at 153.50, where the pair traded in the early European session before extending lower. Above that, 155 is the structural level whose loss defined this move and whose reclaim would repair the short-term damage. The 100-day simple moving average and the Bollinger midline both sit above current price, and price has to trade back through both to change the daily bias.
Beyond 155, the 157.48 area corresponds to a prior high cluster and represents the most important upside barrier. Above it, the 159.70 level is where the current dominant short position was established, and 164 sits at the stop level and at the top of the aggregate forecast range.
Support: 152.89 is Tuesday's low. Below it, 150.83 corresponds to a long-term upward trendline, and a return to that zone would put the trendline at risk. The 150 round number sits alongside it and marks the bottom of the aggregate forecast range.
Beneath 150, the 149 year-end target is the first published objective, roughly 2.5% below the current low. The mid-140s is the positioning-driven extension cited if the unwind continues, and 145 represents the practical floor of that scenario.
Percentage distances from 152.89: resistance at 155 is 1.4% up, 157.48 is 3.0% up, 159.70 is 4.5% up. Support at 150.83 is 1.3% down, 149 is 2.5% down, 145 is 5.2% down.
Those are tight increments for a pair moving 1% a day, which means the entire mapped structure can be traversed inside a week if the meetings deliver a surprise.
Momentum is unambiguous on the daily timeframe. Price holds well below the Bollinger midline and the 100-day average with a clearly bearish near-term bias, and there is no oversold divergence signalling exhaustion.
The single most important level to watch is 155. Reclaiming it converts this from a structural break into a failed breakdown and would suggest the carry unwind has run its course. Until that happens, rallies are corrective within a downtrend.
Verdict: A Positioning Unwind Wearing a Fundamentals Costume
USD/JPY at 152.89 with the yen at a seven-month high has moved more than 4% in six sessions on a repricing that is real but smaller than the price action implies. The trigger is genuine: money markets now put 97% odds on a Bank of Japan increase to 1.25% on 18 September, up from 52% a month ago, with board member Hajime Takata explicitly stating that a 25-basis-point step is not necessarily set in stone and that back-to-back hikes are possible — against a July vote that rejected 1.25% by 8–1 and a June hike that passed 7–1. But the arithmetic does not support the magnitude. The Fed's 3.625% midpoint against the Bank of Japan's 1.00% is a 262.5 basis point differential, and if both central banks hike next week — the Fed on 16 September at roughly 58% to 60% odds, the Bank of Japan on 18 September at 97% — that differential sits exactly where it started. The 100-basis-point-to-five-to-eight-yen historical relationship implies three to five yen of decline from the compression delivered so far. The pair has fallen considerably more. The excess is the carry unwind, which is why the stated downside path is framed around the size of the outstanding short-yen position rather than around any rate target, and why the mid-140s is described as achievable without a corresponding fundamental case. Working against it: Brent at $99.22 and European gas above €73/MWh are a direct terms-of-trade hit to an economy that imports nearly all its energy, and Japanese buyers are competing head-on with Europe for the same scarce LNG cargoes. The path: hold below 155 and the sequence runs 150.83 and the long-term trendline, then 149, then the mid-140s on a hawkish 18 September press conference — 1.3% to 5.2% of further downside. Reclaim 155 and the 100-day average and this becomes a failed breakdown with 157.48 and then 159.70 back in play. Bias is bearish USD/JPY below 155 and neutral above it, and the honest framing is that a 97%-priced hike carries almost no surprise capacity on the decision itself — everything now rests on whether Ueda validates the back-to-back path or deflates it, with a 149-to-165 forecast dispersion telling you how little anyone actually knows.





