Gold Clings to $4,333 Below Every Moving Average as Warsh's First Dot Plot Decides the Next $400
XAU/USD is up five straight sessions to $4,333 but trapped under its 21-day SMA at $4,402, with the US-Iran truce and oil rout capping the bid | That's TradingNEWS
Key Points
- Gold near $4,333, down 23% from the $5,598.75 record, below the 21-day SMA at $4,402 and 200-day at $4,461.
- The 2 PM FOMC dot plot is the referee: a hawkish median opens $4,000–$4,023, a dovish lean targets $4,461–$4,500.
- Central banks bought 244 tonnes in Q1 and 17 in April; China's 18-month streak lifts reserves to 2,322 tonnes — the floor.
Gold is treading water exactly where it doesn't want to be. XAU/USD is changing hands near $4,333, holding a five-session winning streak that's lifted it off the lows but leaving it boxed inside this week's familiar range. The August futures contract opened at $4,352.60, flat against Tuesday's close, with spot grinding around $4,349 in early New York trade. The move higher is real but shallow — buyers lack the conviction to press, and the reason is parked on the calendar at 2 PM ET.
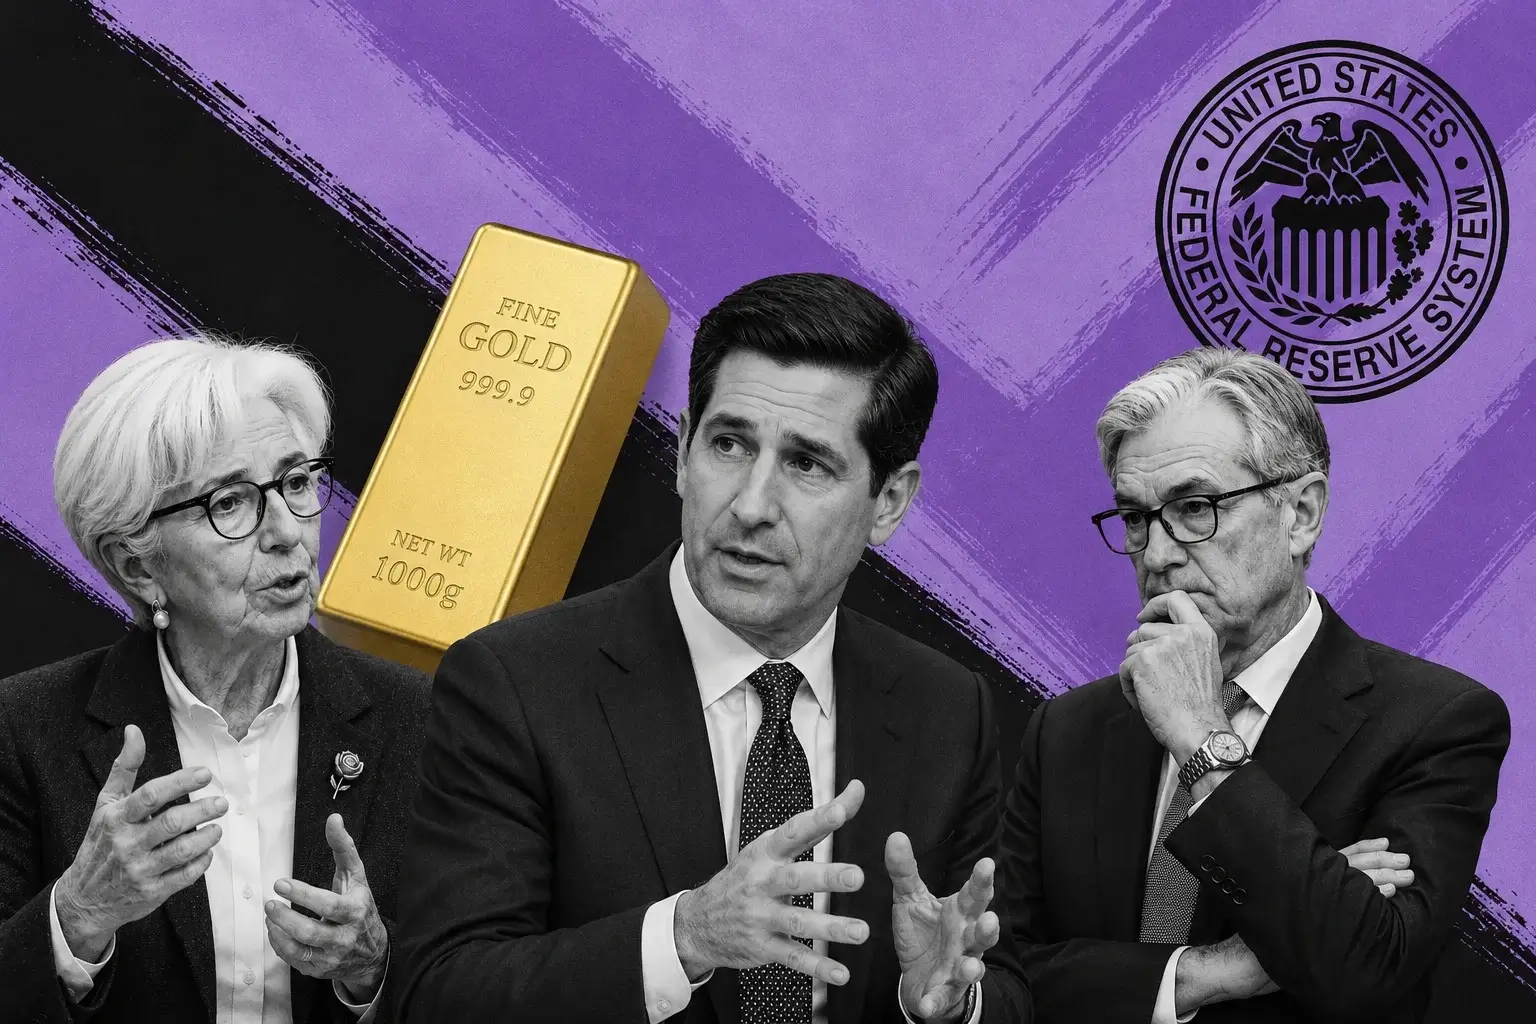
That's when the Federal Reserve delivers its rate decision under brand-new Chair Kevin Warsh, with the press conference at 2:30. The funds rate is a 97%-plus lock to stay at 3.50%–3.75%, so the number is dead weight. What moves bullion is the dot plot — the committee's projection of the rate path — and the tone of a Chair running his first meeting, one who reportedly won't even submit his own dot. For a non-yielding asset like gold, the entire case rests on the opportunity cost of holding it, and that cost is whatever the Fed signals the rate path will be. The dots are the referee.
The five-day bounce came from a genuinely oversold position. Gold cratered to its lowest level since November near $4,200, with a June 11 swing low at $4,023, before staging a recovery that clawed back above $4,300. The catalyst for the bounce was the US-Iran peace framework easing inflation fears and pulling oil lower, plus a softer dollar. But the rally has the hallmarks of a corrective move inside a downtrend rather than the start of a new leg higher, and the price action this morning — flat, range-bound, waiting — confirms a market that knows the next direction gets decided by someone else.
The one-line thesis for the session: gold is riding a fragile, oversold bounce to $4,333 while trapped below every major moving average, and the dot plot — not the rate — decides whether the recovery extends toward $4,461 or rolls back toward $4,000, even as a wall of central-bank demand quietly anchors the floor beneath the technical damage. Everything green on the bounce is provisional until 2 PM.
The setup is a coiled, oversold metal sitting on geopolitical relief and waiting for a macro verdict. The release comes in hours.
The 23% Wreck From $5,598 That Reset Everything
To understand why gold at $4,333 feels heavy rather than hopeful, rewind to the record. Bullion hit an all-time high of $5,598.75 per ounce in March, the parabolic peak of a multi-year run powered by de-dollarization, central-bank buying, and geopolitical fear. From that high, gold has fallen more than 23%, a decline steep enough to completely wipe out the year's gains and leave the metal down on a year-to-date basis after starting 2026 with a parabolic surge.
That's a brutal round trip. Gold opened March near $5,190, breached $4,900 in January during the height of the mania, and then unwound the entire move as the macro backdrop flipped. The drop from $5,598.75 to the June low near $4,023 represents roughly a 28% peak-to-trough collapse — a bear market in the world's premier safe-haven asset, compressed into a few months. The five-day bounce to $4,333 has recovered a sliver of that, but the metal sits a full $1,265 below its record, and the technical structure reflects the damage.
The driver of the collapse was the same force pressuring every asset: the repricing of the Fed. Gold's parabolic run was built on the expectation of rate cuts that would crush the opportunity cost of holding a non-yielding metal. When four straight months of hot inflation — May CPI printed 4.2% year over year — flipped the market from pricing cuts to pricing a 50/50 chance of hikes, the entire bull thesis inverted. Higher-for-longer rates raise the cost of holding gold, and the metal got sold hard as the rate path firmed.
The Iran conflict added a second twist. The war that erupted in late February initially boosted gold as a safe haven, but it also spiked oil and drove the inflation that forced the Fed hawkish — and now the resolution of that conflict is pulling oil lower and easing the inflation fear, which cuts both ways for bullion. Less geopolitical risk means less safe-haven demand, but less inflation also means a less-hawkish Fed, which is gold-supportive. That tension is the entire current setup.
The reset matters because it changed gold's character. The metal that was an unstoppable alpha generator in January, ripping to $5,598, is now a beaten-down asset trying to find a floor after a 23% decline. The bounce to $4,333 is the first sign of stabilization, but whether it holds depends on the Fed clarifying whether the rate path that crushed gold is finally peaking or has further to run.
The Dot Plot Is the Referee, Not the Rate
Strip the decision to its core and the rate is settled — a hold at 3.50–3.75% is priced near-certain. Gold doesn't trade the number; it trades the projection of where the number goes next, and that's the dot plot inside the Summary of Economic Projections.
The mechanism is opportunity cost. Gold pays no yield, so every basis point of rate the market expects is a basis point of return given up to hold the metal instead of a Treasury. When the projected rate path rises, holding gold gets more expensive in relative terms and the metal sells off; when the path falls, the opportunity cost drops and gold rallies. The June dot plot tells the market directly whether the rate path that crushed bullion from $5,598 is peaking or extending. If the median 2026 dot shifts from the prior cut toward flat or tightening, it confirms the hawkish repricing and pressures gold toward $4,000. If Warsh threads a dovish needle — acknowledging cooling core inflation and leaving a door open to cuts — the opportunity cost falls and gold targets $4,461.
The Warsh wildcard amplifies it. A new Chair with no track record running his first meeting means his 2:30 press conference carries more weight than the decision itself. His words on the inflation backdrop, the rate path, and forward guidance will move the dollar and real rates in real time, and gold trades inversely to both. Reports that he won't submit his own dot add a layer of uncertainty about how the projections read — a less-predictable Fed raises the risk premium across every asset, and for gold that cuts both ways depending on whether the uncertainty reads as inflationary or restrictive.
The data argues hawkish, which tilts the near-term risk toward the downside. May CPI at 4.2% is the third straight month of accelerating headline inflation, the labor market won't crack with payrolls at +172K, and the market prices a 50.5% hike probability. A committee staring at that data has every reason to project a flat-to-tightening path, which is gold-negative. The counterweight is that energy drove over 60% of the May CPI increase, core ran just 0.2% on the month, and the Fed can't fix an oil-driven inflation spike with rate hikes — the dovish argument the bulls cling to.
For gold, the dot plot is the cleanest binary on the board. A hawkish median sends the metal toward $4,000; a dovish one launches a run at $4,461–$4,500. Two hours from the open, that question is unanswered, and the flat tape reflects it.
The Iran Truce and Oil Rout That Capped the Bounce
The geopolitical story cuts gold both ways, and right now it's net-negative for the bid. The US-Iran peace framework, with a memorandum set to be signed Friday, has eased the inflation and rate-hike fears that drove the metal lower — but it's also drained the safe-haven premium that supported it, and the oil rout it triggered is the disinflationary force keeping the rally capped.
The oil move has been violent. Crude plummeted to a two-month low after the truce announcement, with WTI sliding into the mid-$70s and Brent back to $75 — a reversal that eased worldwide inflationary pressures and drove the dollar lower. That softer dollar is the only reason gold could bounce at all; the greenback is closely correlated with oil through the inflation channel, and a weaker dollar mechanically lifts dollar-priced bullion. The five-day winning streak owes more to dollar softness than to genuine safe-haven demand.
But the same oil rout undercuts the inflation case that gold needs to rally as a hedge. Gold's parabolic run was partly an inflation play, and an oil collapse that cools headline CPI removes one of the metal's core bull arguments. The disinflation is gold-supportive through the Fed channel — cooler inflation means less reason to hike — but gold-negative through the inflation-hedge channel, because there's less inflation to hedge. The net effect has been a capped bounce: enough dollar weakness to lift the metal off its lows, not enough fear to drive it through resistance.
The bounce faded as the details stayed murky. The early enthusiasm sparked by the peace deal cooled as the market awaited specifics, and gold surrendered part of its initial advance, receding toward $4,350 from higher levels. A framework signed Friday is not the same as a durable peace, and the skepticism about how fast the Strait of Hormuz actually reopens kept both oil and gold from extending their moves. The truce is a real catalyst on paper, but the market won't fully price it until the agreement holds.
For gold, the Iran story is the macro counterweight to the technical damage. If the truce holds and oil keeps draining, the disinflation eases the Fed's hawkish pressure, which is gold-supportive through the rate channel even as it removes the safe-haven bid. The metal is caught between the two forces, and the Friday signing — two days after the Fed — is the next hard catalyst that tips the balance.
The Technical Wreckage: Below Every Moving Average
The chart is unambiguous, and it's bearish. XAU/USD at $4,333 trades below every major simple moving average, a stacked configuration that defines a clear downtrend. The 21-day SMA sits at roughly $4,402, the 200-day at $4,461, the 50-day at $4,565, and the 100-day at $4,746 — all of them above price, all of them acting as resistance. When a market trades below its entire moving-average structure, the path of least resistance is lower until it reclaims those lines.
The most damaging signal is a bearish crossover. The 20-day SMA has crossed below the 100-day and 200-day SMAs for the first time since September 2023 — a "death cross" structure that confirms the trend has flipped from up to down on the intermediate timeframe. That's not a minor technical wrinkle; it's the kind of signal that marks a regime change from the relentless uptrend that carried gold to $5,598 into a corrective phase that could persist. The bearish alignment reinforces that the five-day bounce is corrective, not the start of a new leg higher.
Momentum confirms the caution. The 14-day RSI sits around 44, below the 50 midline, which says sellers retain the upper hand even as the recent slide shows signs of stabilizing. An RSI in the low 40s isn't oversold enough to signal a snapback, but it's weak enough to confirm there's no bullish momentum building — the metal is drifting in a neutral-to-bearish posture, exactly what you'd expect from a corrective bounce running into overhead resistance.
The first real test is the 21-day SMA at $4,402. A daily close back above that line would be the first sign the immediate bearish pressure is easing, opening the path toward the 200-day at $4,461 and the psychological $4,500 mark. Until gold reclaims $4,402, the bounce is just a relief rally inside a downtrend, and the structure favors a resumption lower.
The technical message is consistent with the macro: gold is broken on the chart, riding an oversold bounce into a wall of moving-average resistance, and it needs a dovish Fed to provide the fuel to reclaim those lines. A hawkish dot plot that confirms the bearish structure sends the metal back toward the $4,200 lows and the $4,023 swing low. The chart is the bear case made visual.
The Dollar and Real-Rate Squeeze
Gold's two cleanest macro inputs are the dollar and real interest rates, and both are sitting on a knife's edge into the Fed. The metal trades inversely to both — a stronger dollar makes dollar-priced gold more expensive for foreign buyers and pressures the price, while higher real rates (nominal yields minus inflation) raise the opportunity cost of holding a non-yielding asset.
The dollar has been the bounce's best friend. The greenback retreated on US-Iran peace optimism and the oil rout, with the inflation relief easing the case for a stronger currency, and that softness is what let gold rally five straight sessions. But the dollar's direction after 2 PM depends entirely on the dot plot. A hawkish median sends the dollar ripping higher against the majors, which would slam gold; a dovish lean keeps the greenback soft and supports the metal. The dollar is the transmission mechanism between the Fed's projections and gold's price, and it's frozen ahead of the print just like everything else.
Real rates are the deeper squeeze. With the 10-year Treasury yield near 4.47% and inflation running at 4.2%, real rates are barely positive — a backdrop that historically supports gold because the cost of holding it relative to bonds is low. But a hawkish dot plot that pushes nominal yields higher without a matching rise in inflation expectations would lift real rates, raising gold's opportunity cost and pressuring the price. The metal needs real rates to stay contained, and that requires either the Fed staying dovish or inflation staying sticky enough to offset rising nominal yields.
The cross-currents create a complex setup. The disinflation from the oil rout is gold-negative through the inflation channel but gold-positive through the Fed channel, and the net effect on real rates depends on which moves faster — nominal yields or inflation expectations. If the Fed turns hawkish and yields climb while the oil rout cools inflation expectations, real rates spike and gold gets crushed. If the Fed stays dovish and yields stay contained, real rates stay low and gold holds.
For the session, the dollar is the fastest tell. Watch the greenback's reaction to the dot plot — a sharp rally signals a hawkish read that pressures gold toward $4,000, while continued softness supports a run at $4,461. The metal's price after 2 PM is essentially a mirror of what the dollar and real rates do in response to Warsh.
The Support and Resistance Map
The levels are tight and the Fed reaction will resolve them fast. On the downside, the psychological $4,300 is the first line — a break below it challenges $4,250, then the $4,200 demand zone that caught the recent lows, and beneath that the June 11 swing low at $4,023 is the last line of defense before the metal threatens to break to fresh lows. There's also an unfilled weekly opening gap at $4,219 that the market may want to fill on a pullback if the dollar recovers.
On the upside, the 21-day SMA at $4,402 is the immediate ceiling and the first level that matters — a daily close above it would ease the immediate bearish pressure and signal the bounce has more room. Above that, the 200-day SMA at $4,461 is the next cap, the $4,500 psychological mark is the line that separates a corrective bounce from a genuine trend reversal, and the 50-day SMA at $4,565 defines the broader resistance zone. Steady gains beyond $4,500 would confirm buyers regained control.
The asymmetry favors the downside in the immediate term because of the bearish technical structure and the hawkish-leaning data. If the Fed leans hawkish and the war-related optimism persists, gold has a better chance of returning to the $4,000 level than recovering beyond $4,500 — the psychological line in the sand. That's the bear case: a hawkish dot plot plus a holding Iran truce drains both the rate-cut hope and the safe-haven bid, sending the metal toward $4,000.
The bull case requires a dovish surprise. If Warsh acknowledges the cooling core inflation and the oil-driven disinflation, leaving the door open to cuts later in the year, gold reclaims $4,402, tests $4,461, and a break above $4,500 confirms the bounce has turned into a reversal. That path runs against the data but gets help from the structural demand underneath.
The map is a clean binary. Below $4,300 and the metal heads toward $4,023; above $4,402 and it targets $4,500. The dot plot decides which way it breaks, and the levels are close enough that the move comes fast once the print hits.
The Structural Floor: Central Banks Won't Stop Buying
Beneath the technical wreckage and the macro fear sits the one force that's kept gold from collapsing entirely: relentless central-bank demand. Official-sector buying ran a net 244 tonnes in the first quarter of 2026 — above both the prior quarter and the five-year average — and the buying has continued through the spring, providing a structural floor that the price action doesn't fully reflect.
The pattern is steady and deliberate. After a one-month pause in March driven by Turkey's gold-swap maturities, central banks returned to net buying in April, adding 17 tonnes in total. The buying is part of a multi-year de-dollarization wave in which sovereign reserve managers diversify away from US Treasuries and into hard assets — a structural shift that doesn't reverse on a single Fed meeting or a quarter of price weakness. These are price-insensitive buyers accumulating on a strategic timeline, and they treat the 23% drop from $5,598 as an opportunity to add reserves cheaper, not a reason to sell.
The scale matters for the supply-demand math. Central banks are projected to purchase roughly 800 tonnes in 2026, equivalent to about 26% of annual mine output — a quarter of all the gold dug out of the ground absorbed by sovereign buyers who have no intention of selling. That's supply removed permanently from the liquid market, and it's the mechanical reason gold has a floor well above where the technical structure alone would suggest. The metal fell 23% from its record but found support near $4,000 precisely because the official-sector bid steps in on weakness.
The behavior is the mirror image of the speculative selling that drove the decline. While faster money dumped gold on the hawkish Fed repricing, central banks were on the other side, accumulating reserves at lower prices. That divergence — speculative outflows met by sovereign inflows — is the structural support beneath the $4,333 price, and it's the reason the bear case has a floor. A hawkish dot plot could send gold toward $4,000, but the central-bank bid is the wall that's likely to catch it.
For the longer-term thesis, the official-sector demand is the load-bearing pillar. The speculative froth that drove gold to $5,598 has been wrung out, but the structural buyers remain, and that's what separates this correction from a collapse. The dot plot decides the near-term direction; the central banks decide the floor.
China's 18-Month Streak and the De-Dollarization Engine
The single most important buyer is China, and its behavior tells the structural story. The People's Bank of China added 8 tonnes in April, its largest purchase since December 2024, extending its buying streak to 18 consecutive months. Chinese gold reserves now stand at 2,322 tonnes, representing 9% of total reserves — a number Beijing has been steadily lifting as it diversifies away from dollar assets.
The 18-month streak is the cleanest expression of the de-dollarization thesis. China isn't buying gold to trade it; it's restructuring its reserve composition as a strategic hedge against dollar exposure and geopolitical risk, and that's a multi-year program that continues regardless of price. An 8-tonne purchase that's the largest since December 2024 signals the buying is accelerating, not slowing, even with gold down 23% from its record. That's price-insensitive sovereign demand at its purest.
Poland is the other standout. The National Bank of Poland led April's buying with 14 tonnes, lifting its year-to-date total to 45 tonnes and its reserves to 595 tonnes — roughly 30% of total holdings, still short of its stated 700-tonne target. That gap between current reserves and the target is forward demand baked in: Poland has telegraphed it intends to keep buying until it hits 700 tonnes, which means another 105 tonnes of demand is effectively committed. When a central bank publishes a target it hasn't reached, it's announcing future purchases.
The de-dollarization engine is the structural bull case that survives any single Fed meeting. BRICS+ nations and emerging-market central banks are systematically rotating reserves out of Treasuries and into gold, driven by a desire to reduce dollar dependence amid geopolitical friction and concerns about US fiscal sustainability. That rotation created the price floor that proved resilient through the 23% correction, and it's the reason institutions like JPMorgan and UBS maintain bullish long-term targets despite the near-term weakness.
For the price, China's streak and Poland's target are the quiet counterweight to the hawkish Fed. The dot plot might send gold toward $4,000 on the rate channel, but every tonne the PBoC and NBP absorb on that weakness tightens the supply and builds the base for the next leg higher. The sovereign buyers are playing a different game than the macro crowd, and they're winning it on a multi-year timeline.
The Miners: Leverage to the Floor
Gold's correction has done little to dent the mining sector's fundamentals, because the metal fell from a stratospheric peak to a price that still leaves producers swimming in margin. With gold at $4,333 and all-in sustaining costs running between $1,400 and $1,700 per ounce, the spread between the gold price and the cost to produce it remains enormous — margins around $2,800 per ounce that translate into record free cash flow across the sector.
The leverage is the appeal. Mining stocks are a leveraged play on the gold price because their costs are largely fixed while their revenue moves with bullion — a $4,333 gold price against a $1,500 cost base produces far more profit growth than the metal's move alone. Newmont, the world's largest producer with roughly 15% market share of top-tier gold output, generates consistent free cash flow from large-scale production, though it's navigating a planned "trough year" in 2026 to reset its portfolio. Barrick is preparing a radical corporate restructuring that could spin off its North American assets into a new entity.
The sector's ETFs are the cleaner way to play the structural thesis. The VanEck Gold Miners ETF, which counts Newmont and Barrick as top holdings, saw record inflows earlier in 2026 as the crowd rushed to gain leveraged exposure to the gold rally, with trading volumes tripling their 30-day average during the parabolic phase. The junior miners ETF offers even more leverage and volatility, and the relative performance between the two signals whether the market favors the established giants or the aggressive explorers.
The correction tested the miners but didn't break the thesis. The 23% drop in gold from $5,598 pressured the equities, but with the metal still at $4,333 — a price that was unthinkable a few years ago — the producers retain super-margins and record cash generation. The miners enter the second half of 2026 with the strongest balance sheets in their history, having used the 2025 rally to pay down debt and fund expansion, which leaves them positioned to weather a further gold decline toward $4,000 without margin stress.
For the session, the miners trade as a leveraged proxy for the gold price reaction to the Fed. A dovish dot plot that lifts gold toward $4,461 sends the miners ripping; a hawkish one that pressures the metal toward $4,000 hits them harder than bullion itself. The leverage cuts both ways, but the structural floor under gold — central-bank demand — is the same floor under the miners' cash flows.
The Forecast Split: $6,300 Bulls vs $3,816 Bears
The analyst community is sharply divided on where gold goes from here, and the split captures the entire tension of the setup. On the bullish side, major institutions including JPMorgan and UBS see gold trending toward the $5,000 to $6,300 per ounce range by the end of 2026 — targets that would not only recover the $5,598.75 record but exceed it. The bull case rests on three pillars: continued de-dollarization by emerging economies, anticipated rate cuts reducing the opportunity cost of holding the metal, and persistent geopolitical conflict.
The bearish camp sees the opposite. Some forecasts expect gold to decline toward the $4,370 to $3,816 range by year-end, citing ongoing geopolitical uncertainty paired with the possibility of further Fed rate hikes. The bear case is the inverse of the bull case: if the Fed hikes rather than cuts, the opportunity cost of holding gold rises and the metal extends its decline below the recent lows. The 50.5% hike probability the market is pricing gives that scenario real weight.
The near-term forecasts cluster around the current range. Gold is expected to trade within roughly $4,186 to $4,933 in June, with one month-end target near $4,516 — a level that would require reclaiming the moving-average resistance the metal is currently trapped below. That range captures the binary: the low end maps to a hawkish-Fed outcome, the high end to a dovish one, with the dot plot deciding which way the metal breaks within the band.
The divergence between the bull and bear targets — a spread from $3,816 to $6,300 — is the widest in years, and it reflects genuine uncertainty about the Fed's path and the durability of the de-dollarization trade. The bulls bet that the structural central-bank demand and an eventual return to rate cuts drive gold back to records; the bears bet that the hawkish Fed and the Iran truce keep the metal pressured toward $4,000. Both scenarios are live, and the resolution depends on the rate path the dot plot reveals.
For the session, the forecasts frame the stakes. A dovish Fed validates the $5,000+ bull targets by confirming the rate path is peaking; a hawkish one validates the $3,816 bear targets by confirming hikes are coming. The metal at $4,333 sits almost exactly between the two camps, and the dot plot is the tiebreaker.
Read More
-
Tesla Climbs to $398 on the Tech Rally as Bullish Delivery Forecasts Collide With an FSD Safety Probe
18.06.2026 · TradingNEWS ArchiveStocks
-
XRP Holds $1.18 as the CLARITY Act Countdown Cushions the Hawkish-Fed Crypto Slide
18.06.2026 · TradingNEWS ArchiveCrypto
-
Dollar-Yen Climbs Toward 161 as the BoJ's Rate Hike Fails to Lift the Yen
18.06.2026 · TradingNEWS ArchiveCommodities
-
Intel Rockets 10% on Apple Chip Pact as S&P 500 Reclaims 7,500 and Oil Sinks on Iran Peace Deal
18.06.2026 · TradingNEWS ArchiveMarkets
-
Pound Drops to $1.33 as a Hawkish Fed Overpowers the Bank of England's Hawkish Hold
18.06.2026 · TradingNEWS ArchiveForex
Silver and the Broader Complex
Gold doesn't trade in isolation, and the broader precious-metals complex offers a read on the move's character. Silver has been holding up on its industrial component even as safe-haven flows softened — the metal's dual role as both a precious and an industrial asset gives it support from renewable-energy, transportation, electronics, and AI demand that gold lacks. That industrial floor has offset some of the lower safe-haven flows pressuring the complex, and global supply deficits add a structural tailwind.
The relationship matters because silver tends to amplify gold's moves. In a gold rally, silver typically outperforms as the higher-beta metal; in a decline, it falls harder. The fact that silver is holding on industrial demand while gold corrects suggests the selloff has been driven more by the macro rate repricing than by a collapse in the broader metals thesis — if the entire complex were breaking down, silver would be leading lower rather than holding. That's a subtle bullish tell beneath the gold weakness.
The global central-bank picture extends beyond the Fed. The Bank of Japan raised its policy rate by 25 basis points to 1% at its June meeting, while the Reserve Bank of Australia held at 4.35% — a week of central-bank decisions that shapes the dollar's relative value and, by extension, gold's price. A BoJ hike that strengthens the yen pressures the dollar, which is gold-supportive, while the broader divergence in global rates feeds into the currency moves that drive bullion.
The complex tells a consistent story: the metals correction has been a macro-driven rate event rather than a structural collapse in demand. Silver's industrial resilience, the central-bank gold buying, and the supply deficits all argue that the fundamental case for the complex remains intact even as the price corrects on the Fed repricing. The selloff wrung out the speculative excess without breaking the underlying demand drivers.
For gold specifically, the complex reinforces the thesis that the floor is structural. The metal fell 23% on the rate channel, but the broader precious-metals demand — silver's industrial pull, gold's sovereign bid — remains firm, which is why the correction found support near $4,000 rather than cascading lower. The dot plot decides the near-term direction; the complex confirms the floor.
The Two Roads Out of 2 PM
The session resolves into a clean binary. The hawkish road: the median 2026 dot shifts toward flat or tightening, confirming the 50.5% hike probability, and Warsh's press conference pushes back on rate-cut hopes. That outcome sends the dollar higher, lifts real rates, and pressures gold through $4,300 toward the $4,250 and $4,200 demand zones, with a break there exposing the $4,023 swing low. The bearish technical structure — price below every SMA, the 20-day death cross — accelerates the move, and the metal heads toward $4,000.
The dovish road: Warsh acknowledges the cooling core CPI of 0.2% monthly and the oil-driven disinflation, leaves the door open to easing, and the dots hold rather than tighten. That outcome keeps the dollar soft, contains real rates, and gives gold the fuel to reclaim the 21-day SMA at $4,402, test the 200-day at $4,461, and challenge the $4,500 psychological line. A break above $4,500 would confirm the five-day bounce has turned into a genuine reversal toward the bull targets.
The probability lean tilts hawkish on the data — sticky 4.2% inflation, a firm labor market, and the hike pricing all argue for dots that tighten, which is gold-negative. But the counterweights are substantial: the oil-driven disinflation that constrains the Fed, the structural central-bank demand absorbing 800 tonnes a year, China's 18-month buying streak, and a metal already 23% off its highs with the speculative excess wrung out. The bear case is the base case for the next move, but the floor is real.
The wildcard is the gap between the backward-looking data and the real-time disinflation. The Fed projects from a May CPI driven by an energy spike that's now reversing, and if it turns hawkish on stale data, the Friday Iran signing could pull oil lower and ease the inflation that justified the hawkish dots — a sequence that could see gold dip toward $4,200 on the dot plot and then recover as the disinflation undercuts the hawkish case within 48 hours.
The Levels That Decide the Next $400
The map into the close is precise. On the downside, $4,300 is the first line, $4,250 and the $4,200 demand zone are the next supports, and the $4,023 June swing low is the last defense before fresh lows. The unfilled weekly gap at $4,219 is a magnet if the dollar recovers. A hawkish dot plot that breaks $4,300 opens the path toward $4,000 — the level FXStreet flags as more likely than $4,500 if the Fed leans hawkish and the Iran truce holds.
On the upside, the 21-day SMA at $4,402 is the first ceiling and the line that must be reclaimed to ease the bearish pressure. Above it, the 200-day at $4,461, the $4,500 psychological mark, and the 50-day at $4,565 define the resistance zone. A daily close above $4,500 would confirm the bounce has become a reversal and target the $4,516 month-end forecast and beyond toward the bull camp's $5,000+ projections.
The confirmations to watch beyond price: the dollar's reaction to the dot plot is the fastest tell — a sharp rally signals a hawkish read that pressures gold, continued softness supports it. Real rates moving higher on rising nominal yields would pressure the metal; contained yields support it. And the miners — the leveraged proxies — will amplify whichever way gold breaks, with the gold-mining ETFs ripping on a dovish outcome and selling off harder than bullion on a hawkish one.
The structural backdrop stays constant regardless of the print: central banks buying 800 tonnes a year, China extending an 18-month streak, Poland chasing a 700-tonne target, and the de-dollarization trade providing a floor near $4,000 that the speculative selling can't break. The dot plot decides whether gold tests that floor or rallies off it, but the floor itself is built on sovereign demand that doesn't flinch at a single Fed meeting.
The bottom line for the session is unchanged from the open: gold at $4,333 is riding a fragile, oversold bounce while trapped below every major moving average, and the dot plot — not the rate — decides whether the metal reclaims $4,461 or rolls back toward $4,000. The rate is a lock. The dots are the referee. And beneath the technical damage, central banks keep absorbing a quarter of global mine output, building the floor while the macro crowd braces for 2 PM.