WTI ($104) Defends $100 Floor as Houthis Seize Bab el-Mandeb Islands
Hormuz traffic fell to seven vessels a day while Saudi Arabia's 7M-barrel-a-day bypass pipeline stays offline with no restart date | That's TradingNEWS
Key Points
- WTI crude jumped 3.00% to $104.43 after Saudi Arabia canceled September cargoes to European refiners.
- The East-West pipeline outage puts 4 million barrels a day at risk, 4% of global oil supply.
- Global oil inventories have drawn 507 million barrels since February, including 95 million in August.
West Texas Intermediate crude for October delivery traded at $104.43 a barrel at 11:50 a.m. ET on Tuesday, up $3.04 or 3.00%. Brent crude for November climbed 2% to $107.82 in the morning session and touched $107.90. The move came after Saudi Arabia informed European refiners that their September crude cargoes were being canceled because the East-West pipeline remains shut. WTI jumped $2 a barrel within minutes of that report.
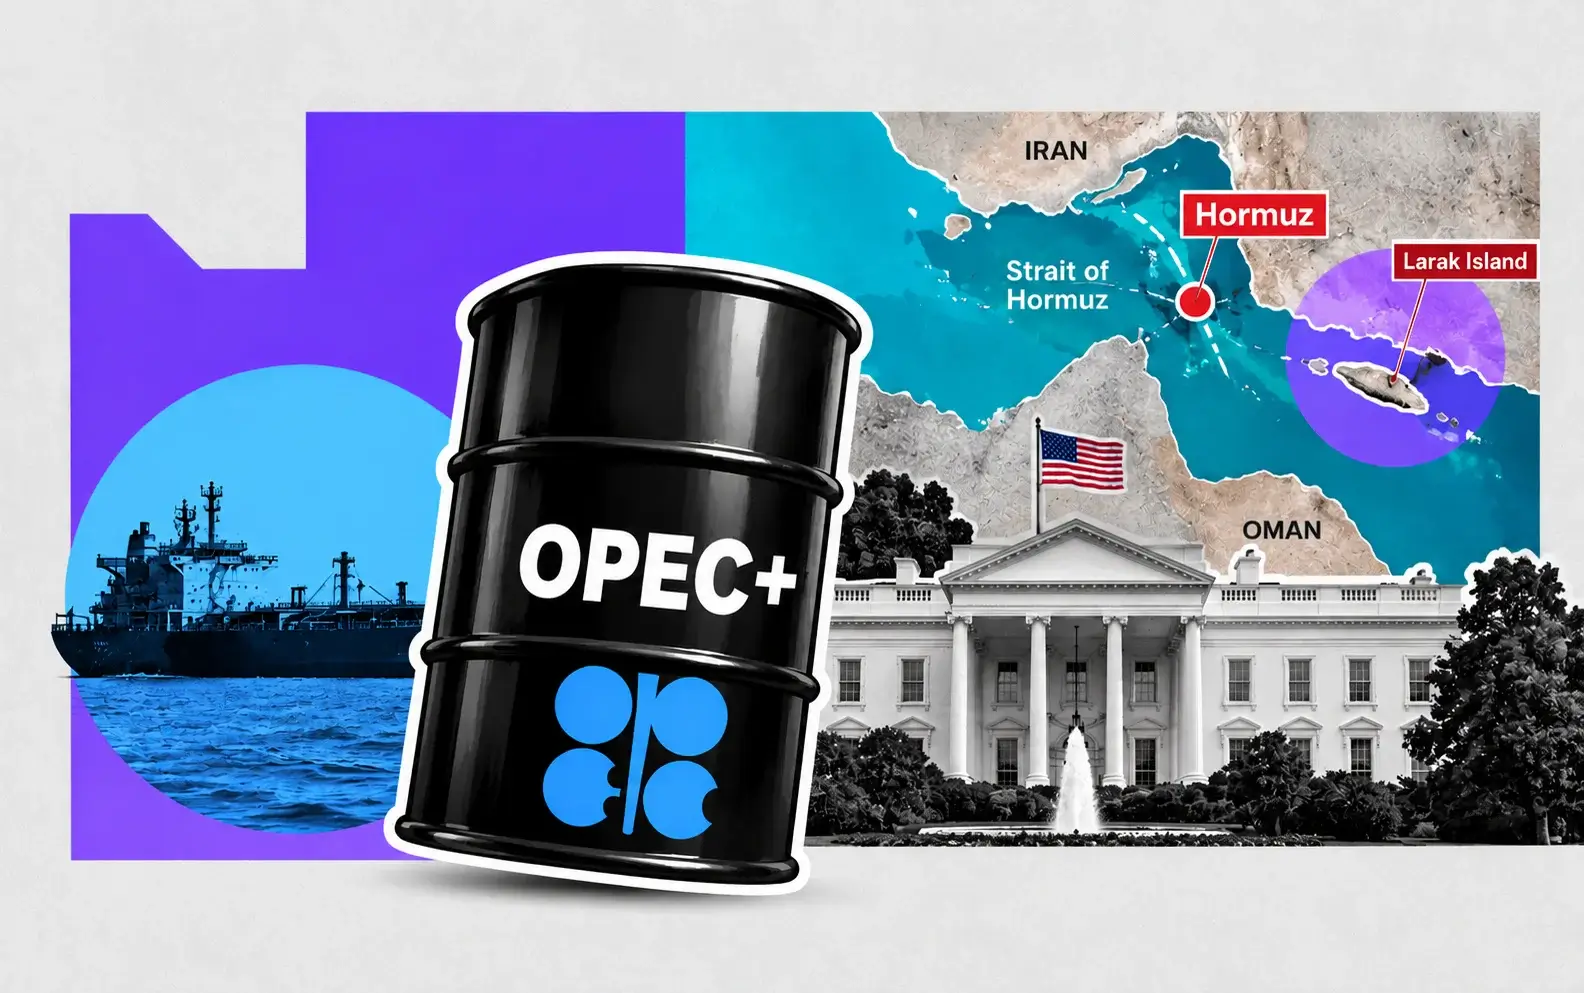
The context is what separates this rally from a one-day scare. The Strait of Hormuz has been effectively closed since the war with Iran began on February 28. Saudi Arabia responded by rerouting more than 70% of its crude exports through the East-West pipeline to the Red Sea port of Yanbu. That pipeline, which carries up to 7 million barrels a day, was knocked offline by a drone attack on September 11. Saudi Aramco has not given a restart date, and the damaged line is expected to stay largely out of service for weeks.
At the same time, Yemen's Houthis have captured Mokha, Mayun, Perim and Zuqar islands and the Hanish islands near the Bab el-Mandeb Strait, the southern exit of the Red Sea that carries 6.2 million barrels of oil and refined products a day. For the first time in this conflict, both of the world's two key Middle East energy chokepoints, Hormuz and Bab el-Mandeb, are contested simultaneously, along with the pipeline built specifically to avoid one of them.
The supply at risk is precise. The pipeline closure threatens 4 million barrels a day, which equals 4% of the 100.7 million barrels a day of global supply forecast for 2026. The buffer to absorb that loss is shrinking. Global observed oil inventories have fallen by 507 million barrels since the war began, including a 95 million-barrel draw in August alone, according to the International Energy Agency's September Oil Market Report.
The futures curve confirms physical tightness. The spread between front-month WTI and the next contract widened to a backwardation of $4.44 a barrel, up from under $1 a month ago. Buyers are paying a premium for barrels delivered now rather than later, the classic signature of a market short on prompt supply.
Brent has gained more than 21% in the past month and international crude is up 80% in 2026. The thesis of this forecast is that with inventories depleted and no bypass left, $100 has become the floor rather than the ceiling, and the path of least resistance points toward $110 on WTI until the pipeline restarts or Hormuz reopens.
From $100.53 to $104.43: How 48 Hours of Supply Shocks Unfolded
The rally has come in waves, each one tied to a specific supply event.
The first wave arrived on Thursday, September 10. Houthi forces seized the Red Sea port of Mokha and Mayun island, taking control of the approach to Bab el-Mandeb. Brent jumped from $101.53 on Wednesday to $108 by Thursday afternoon. Ship traffic through Hormuz fell to seven vessels that day, down from 18 on Tuesday and more than 100 a day before the war. That week, U.S. forces destroyed five Iranian oil tankers, and Iran's Revolutionary Guard said it retaliated against 10 ships near the strait.
The second wave hit on Friday, September 11, when a drone attack that Riyadh blamed on Iran-backed fighters in Iraq struck the East-West pipeline in the Riyadh and Madinah regions. Saudi Arabia's Energy Ministry said late Friday that it had suspended pipeline operations as a precaution after multiple attacks. Brent reached nearly $110 overnight before settling below $105 as markets waited for Monday's open.
The third wave came when trading resumed on Monday, September 14. Brent surged 4.83% to $109.44 by 5 p.m. UAE time, and WTI gained 4.74% to $104.79. WTI hit a session high of $104.95. Then the gains faded by midday in New York after President Donald Trump posted that Iran wanted to make a deal quickly and that Russia and Ukraine had agreed not to strike energy targets. Iranian state media denied Trump's claim. WTI settled at $101.39, up $1.34 or 1.3%, after trading as low as $100.53. Brent settled at $105.68, up 1%. Volume in front-month WTI reached 1,320,295 contracts.
Tuesday brought the fourth wave. Overnight in Asia, WTI fell as low as $100 before rebounding. By early Asian trade, U.S. crude was up 1.27% at $102.68 and Brent up 1.21% at $106.96. At 4 a.m. ET, WTI traded at $103.55, up 2.13%. By 6:48 a.m. ET, WTI had jumped 2.64% to $104.10 and Brent 2.14% to $107.90.
The Saudi cargo cancellation report drove the next leg in U.S. hours, sending WTI up $2 in minutes and pushing the 10-year Treasury yield back above 5%. By 11:50 a.m. ET, WTI stood at $104.43.
The pattern matters for the forecast. Every dip since Thursday has been bought within hours. Monday's Trump-driven selloff held above $100.53. Tuesday's overnight dip held at $100. A market that absorbs de-escalation headlines and then rallies to new session highs is a market where physical buyers are chasing barrels.
The East-West Pipeline: 7 Million Barrels of Capacity and No Restart Date
The single most important asset in the oil market this week is a pipeline built in the 1980s during the Iran-Iraq war for exactly this scenario.
Saudi Arabia's East-West pipeline carries crude from Abqaiq on the kingdom's eastern Gulf coast to Yanbu on the Red Sea, bypassing the Strait of Hormuz entirely. It has capacity to move 7 million barrels a day and had been pumping at full capacity since Iran closed Hormuz. The line represents an estimated 30% to 40% of crude flows out of the Gulf. Yanbu normally moves 4 million barrels a day of exports.
Satellite imagery following the September 11 drone attack shows fire damage and extensive blackened areas around a pumping station. Riyadh has not disclosed the extent of the damage or a timeline for repairs, and the line is expected to remain largely out of service for weeks.
The downstream effects are already visible. Saudi Arabia is canceling September crude cargoes to European refiners. At least four Asian refiners have received no word on loading schedules at Yanbu. The port is reportedly holding only five to seven days of stored oil. Once that storage runs down, Saudi exports through the Red Sea stop entirely unless the pipeline restarts.
The math on lost supply is stark. A 4 million-barrel-a-day disruption for 30 days removes 120 million barrels from the market. That is 1.26 times August's entire global inventory draw of 95 million barrels. For a market that has already drawn down 507 million barrels since February, another 120 million barrels in a single month would push inventories into territory the market has not seen in this crisis.
Saudi Arabia is scrambling on multiple fronts. Crown Prince Mohammed bin Salman met U.S. Central Command chief Admiral Brad Cooper in Jeddah on Monday after requesting American strikes on the Houthis. Washington offered intelligence-sharing rather than military action. Saudi authorities issued and then lifted danger alerts for six cities, including Yanbu itself.
The pipeline is the swing factor for the entire forecast. A restart announcement with a firm date would likely knock $5 to $8 off Brent within a session, because it would restore the only reliable bypass. Every day without an update adds to the physical shortage and the backwardation. Traders are now pricing in a significant loss of regional supply for an extended period, and analysts increasingly see prices holding above $100 until the line comes back.
Two Chokepoints at Once: Hormuz at Seven Ships a Day, Bab el-Mandeb Under Houthi Guns
The oil market has faced Hormuz disruptions and Red Sea attacks before. It has not faced both at the same time with the main bypass pipeline offline.
The Strait of Hormuz remains virtually shut. Before February 28, more than 100 vessels crossed the waterway each day. On Thursday, September 10, only seven did, a 93% collapse. The U.S. and Iran are trading attacks on tankers. President Trump says the U.S. is making progress reopening the strait and escorting more oil through it, but traffic data does not yet reflect a recovery. Gulf Arab states postponed planned talks with Iran on Hormuz that were scheduled in Oman. A senior Iranian security official said Tehran will not return to negotiations with Washington until its conditions are met.
Bab el-Mandeb is the new front. The strait is 12 miles wide and connects the Red Sea and Suez Canal to the Gulf of Aden and the Indian Ocean. It carries 6.2 million barrels a day of oil and refined products and 80% of the LNG shipped north to Europe. It is especially critical for Saudi Arabia, whose Asian-bound exports from Yanbu must pass through it.
The Houthi advance changes the risk calculation. The group captured Perim Island, 13 square kilometers of territory that splits Bab el-Mandeb into two channels, giving it the ability to monitor and potentially mine the waterway. It also took Zuqar Island, the Hanish islands, Mokha and Mayun island, putting Houthi forces within 32 kilometers of the U.S. base in Djibouti. Traffic through the strait fell to 27 vessels on September 10 from 32 the day before. The Houthis previously declared a maritime embargo against Saudi Arabia.
Hormuz carries 11% of maritime oil and 12% of global trade. Bab el-Mandeb carries 6.2 million barrels a day. With the East-West pipeline also closed, Saudi Arabia's export routes through both the Gulf and the Red Sea are either shut or under direct threat.
War-risk insurance costs have followed. Premiums for a single tanker transit through contested waters now run into the millions of dollars before cargo cover and freight are added. Shipowners are refusing voyages or demanding charter rates that lift delivered crude costs well above benchmark futures prices.
For the forecast, the dual-chokepoint risk puts a structural floor under Brent. Even a partial reopening of Hormuz would not fully offset a Red Sea closure, and even a pipeline restart would route crude straight into Houthi-contested waters. Until both straits see sustained traffic recoveries, the market cannot price a return to pre-crisis flows.
Inventories: 507 Million Barrels Drawn Since the War Began
Inventories are the shock absorber that has kept oil below its April peak, and that absorber is wearing out.
According to the International Energy Agency's September report, global observed oil inventories have fallen by 507 million barrels since the start of the war, an average draw of 2.8 million barrels a day. August alone saw stocks fall by 95 million barrels, or 3.1 million barrels a day, the fastest monthly pace since the conflict began. July's draw was 69 million barrels, or 2.2 million barrels a day, and by the end of July observed stocks had fallen below 7.9 billion barrels for the first time since April 2025.
The draw is accelerating, not easing. Cumulative drawdowns reached 410 million barrels between the end of February and the end of July, then jumped to 507 million by the end of August. The IEA's July report had projected a global oil deficit of 1.8 million barrels a day in the third quarter, more than double its earlier estimate.
The only month that broke the pattern was June. Observed inventories rose for the first time since the war began as a partial resumption of Hormuz flows sent tankers toward distant refining hubs. Oil on water swelled by 117 million barrels, outpacing onshore draws of 96 million barrels, including 44 million barrels from OECD government reserves. That respite lasted a single month.
Government reserves have been drawn hard. Steep U.S. Strategic Petroleum Reserve releases, along with growth from the Americas, helped boost Atlantic Basin crude exports to markets east of Suez by 3.5 million barrels a day since the war began. Every barrel released from strategic stocks is a barrel that is no longer available for the next emergency.
The IEA framed the risk directly: with buffers shrinking and the global refining system stretched to the limit, progress in resolving both the Middle East conflict and the Russia-Ukraine war, now in its fifth year, has become more urgent.
For price, the inventory math means each supply shock carries more weight than the one before. When stocks were ample in March, a Hormuz headline lifted Brent by a few dollars before inventories cushioned the blow. At current depleted levels, the East-West pipeline outage cannot be absorbed the same way. The $4.44 WTI backwardation is the market's real-time measure of that thinning buffer. If the pipeline stays shut through October, inventory draws would likely exceed 4 million barrels a day, and the $126.41 Brent peak from April 30 would come back into view.
The IEA Balance: Supply Falls 5.7 Million Barrels a Day, Demand Drops 2.5 Million
The IEA's September Oil Market Report provides the clearest picture of how the 2026 oil balance has broken down.
On supply, total global oil production is set to fall by 5.7 million barrels a day to 100.7 million barrels a day this year. The IEA has deferred the expected recovery in Gulf production until 2027. The Americas Quintet, a group of fast-growing non-OPEC+ producers in the Western Hemisphere, is set to add 1.4 million barrels a day in 2026 and 1 million barrels a day in 2027, but that growth cannot replace lost Gulf barrels.
On demand, the IEA forecasts global oil consumption will fall by 2.5 million barrels a day in 2026, 940,000 barrels a day more than its August estimate. Steep losses of petrochemical feedstocks and refined products, along with higher fuel prices, especially for diesel, are forcing consumption lower. The annual rate of decline is set to ease from 5.3 million barrels a day in the second quarter to 3.4 million barrels a day in the third quarter and 2 million barrels a day in the fourth.
The gap between the two numbers explains the price. Supply is falling 3.2 million barrels a day more than demand this year. That shortfall is being filled from inventories, and the September pipeline outage widens it further.
Refining is the second bottleneck. Global refinery throughput reached a summer peak of 81.4 million barrels a day in August, up 960,000 barrels a day from July, but 4.2 million barrels a day lower than a year ago, with losses spread across the Middle East, Russia and crude-importing economies in Asia. Global runs are forecast to decline by 2.6 million barrels a day to 81.5 million barrels a day in 2026. Refining margins hit record levels in the Atlantic Basin in August, led by sharply higher diesel cracks. U.S. diesel hit a new record above $6.23 a gallon.
The Russia-Ukraine war compounds the product squeeze. Intensifying Ukrainian attacks on Russian refineries and export infrastructure have tightened product markets in Russia and beyond, reducing both exports and domestic fuel deliveries.
The 2027 outlook offers the long-term bearish case. The IEA sees production rebounding by 8 million barrels a day in 2027 once Gulf supply returns. In its June report, the agency projected 2027 demand rising to 105.3 million barrels a day while supply surges to 110 million barrels a day, a significant overhang. That future surplus is why the curve is in steep backwardation: the market expects today's shortage to become tomorrow's glut once the straits reopen.
Backwardation at $4.44: What the Futures Curve Is Saying
The shape of the futures curve is the most honest signal in the oil market because it reflects what physical buyers are actually paying.
The spread between front-month October WTI and the November contract widened to $4.44 a barrel this week, a backwardation that was below $1 a month ago. Backwardation means near-term delivery costs more than later delivery. A $4.44 front spread tells you refiners and traders are willing to pay a steep premium to secure barrels now, because they cannot wait.
The Brent structure is showing the same stress. November Brent at $107.90 sits $3.47 above October WTI at $104.43. That Brent-WTI spread reflects the premium on internationally traded crude that can reach Europe and Asia, where Saudi cargo cancellations are landing hardest. U.S. crude, landlocked in part and supported by domestic production, trades at a discount, but U.S. exports have surged to fill the gap, which keeps the spread from widening further.
Steep backwardation has three implications for the forecast. First, it rewards holding physical crude and penalizes storage, which accelerates inventory draws as holders sell prompt barrels at premium prices. That feeds the tightness. Second, it signals that the market sees the shortage as temporary. Deferred contracts in 2027 trade far below today's prices, consistent with the IEA's projected 2027 supply rebound of 8 million barrels a day. Third, it creates roll yield for long futures positions, attracting financial buyers into oil ETFs. The United States Oil Fund closed at $156.66 on Monday, up 1.14%.
The curve also shows where the risk sits. Front-month contracts carry the war premium. If the pipeline restarts or Hormuz traffic recovers, the front of the curve would fall hardest and fastest, and the backwardation would collapse. A move from $4.44 back toward $1 would likely coincide with WTI dropping toward $95. If the outage extends through October, the backwardation would likely widen beyond $5, and front-month WTI would push toward $110.
The October WTI contract expires later this month, and the roll into November adds technical noise. Traders tracking continuous charts should watch the November contract, which trades $4.44 below October, to avoid mistaking roll effects for price declines.
For now, the curve is unambiguous. Physical buyers are short barrels, inventories are drawing and the prompt premium is widening. Backwardation at this level rarely coincides with sustained price declines.
Oil Meets the Fed: $104 Crude, 3.4% CPI and a 5.041% 10-Year Yield
Crude oil is now driving monetary policy on both sides of the Atlantic, and that feedback loop affects the oil price itself.
In the U.S., August CPI rose 0.4% month over month and 3.4% year over year. A key measure of underlying inflation rose at its fastest pace in four months. The oil shock is the main driver: gasoline and diesel feed directly into headline inflation, and transport costs feed into core prices with a lag. Fed funds futures price an 86.3% chance that the Federal Reserve lifts its target range to 3.75% to 4.00% on Wednesday, the first hike since 2023.
The bond market has repriced sharply. The 10-year Treasury yield hit 5.041% on Tuesday, its highest level since 2007. The inflation pressure from crude pushed the 10-year above 5% for the first time since 2023 on Monday. The dollar index climbed above 99.50, a nearly two-week high.
In Europe, the European Central Bank raised its deposit rate to 2.50% on September 10, citing the Middle East conflict's inflationary pressure. Eurozone inflation hit 3.3% in August, driven by a 14.3% jump in energy components.
The feedback loop cuts against oil prices in the medium term. Higher interest rates slow economic activity, which reduces fuel demand. A stronger dollar makes dollar-denominated oil more expensive for buyers holding euros, yen and rupees, which curbs imports. The IEA's forecast for a 2.5 million-barrel-a-day demand decline in 2026 already reflects that destruction.
In the short term, however, rate hikes do not produce barrels. The supply shortfall from the pipeline outage and the chokepoint closures cannot be solved by the Fed. A quarter-point hike on Wednesday may weigh on risk sentiment for a session, but physical buyers facing canceled Saudi cargoes are not deferring purchases because of the fed funds rate.
The equity market shows the split. Energy stocks are ripping while fuel consumers get smoked. On Tuesday morning, CVR Energy gained 5.88% to $51.49, Talos Energy rose 4.73% to $18.50, Murphy Oil climbed 4.49% to $39.92, Frontline added 4.47% to $52.78, PBF Energy gained 4.05% to $73.25 and Transocean jumped 6.51% to $5.80. American Airlines fell 3.47% to $12.65. Frontline's tanker business benefits directly from longer voyages around closed chokepoints, and PBF and CVR capture record refining margins.
For oil forecasting, Wednesday's dot plot matters mainly through the dollar. A hawkish outcome would firm the dollar and trim a dollar or two from Brent. A dovish outcome would weaken the dollar and add support.
Read More
-
Yen Stalls at 160 Despite a 3% JGB and Tokyo Core CPI at 2.0% — Intervention Sits at 164, Friday's Payrolls Decide
02.09.2026 · TradingNEWS ArchiveEnergy
-
SMR($8.61) Tests August Base After $750 Million ATM and $372.9M Half-Year Burn — TVA Deal Needed for $13.95
15.09.2026 · TradingNEWS ArchiveStocks
-
XRP-USD ($1.39) Defends 200-Day Average as Batch V1.1 Sits One Validator Vote From Activation — $1.52 Close Unlocks $1.60
15.09.2026 · TradingNEWS ArchiveCrypto
-
Gold ($4,329) Defends $4,275 50-Day Average Into Warsh's First Hike — $4,522 Upside
15.09.2026 · TradingNEWS ArchiveCommodities
-
Dow Sinks 0.86%, S&P 500 Falls to 7,584, Nasdaq Tests 26,000 as ENVA Craters 24.75%
15.09.2026 · TradingNEWS ArchiveMarkets
-
GBP/USD (1.3474) Slips Toward 100-Day SMA as Claimants Jump 27,800 and Swaps Price 125bp of BoE Hikes
15.09.2026 · TradingNEWS ArchiveForex
Diplomatic Wildcards: Trump's Deal Claims, the U.S.-Saudi Split and Venezuela
Every sharp selloff in oil this month has come from a diplomatic headline, which makes the negotiation track the main downside risk to the forecast.
Monday's session showed how quickly headlines can move price. After Brent surged 4.83% to $109.44 in Middle East trading, Trump posted that Iran wanted to make a deal quickly and badly and that Kyiv and Moscow had agreed not to strike energy targets. Brent gave back most of the gain and settled up just 1% at $105.68. Iranian state media then denied Trump's claim, and prices recovered on Tuesday.
That pattern has repeated all year. On March 31, Trump said the U.S. was closer to a deal with Iran, and the market initially rallied risk assets. In June, a partial resumption of Hormuz flows sent a wave of tankers to sea and briefly lifted global inventories. Each time, the diplomatic opening failed to produce a durable reopening, and prices resumed their climb.
The current diplomatic picture is not encouraging for de-escalation. Gulf states postponed Hormuz talks with Iran in Oman. A senior Iranian official rejected immediate negotiations. Iranian Foreign Minister Abbas Araqchi travels to China on Wednesday for talks. China, which is economically exposed to the conflict, has called for a ceasefire that would uphold Tehran's sovereignty and reopen Hormuz, making Beijing a potential mediator.
The U.S.-Saudi relationship is showing strain. Saudi Arabia sought American strikes on the Houthis, and Washington offered intelligence-sharing instead. A Defense Department inspector general report put the war's cost at $33.4 billion and confirmed munitions shortages, including the loss of four F-15 fighter jets and up to 30 MQ-9 Reaper drones. Those shortages constrain Washington's capacity to open a second front against the Houthis in the Red Sea.
The Western Hemisphere offers a partial offset. The U.S. has secured access to part of Venezuela's reserves under a deal covering 65 billion barrels, a move aimed at easing supply pressure while the Middle East remains disrupted. Americas production growth of 1.4 million barrels a day in 2026 adds to that cushion. Neither can replace 4 million barrels a day of lost Saudi exports in the near term.
For the forecast, diplomatic headlines are the most likely trigger for a temporary drop toward $100 on WTI. A verified Hormuz traffic recovery above 50 vessels a day or a confirmed ceasefire would be the trigger for a larger decline toward $95. Unverified claims, as Monday showed, fade within hours.
Technical Structure: $100 Floor, $104.95 Resistance, $110 Target
The price chart reflects the fundamental picture: a market repeatedly defending $100 and grinding toward its spring highs.
For WTI, the $100 level is the defining support. Monday's session low of $100.53 and Tuesday's overnight dip to $100 both held that line, and both reversed within hours. A daily close below $100 would be the first sign that the supply premium is fading. Below that, the $95 area marks the late-August range before the Houthi advance and the pipeline strike. The $83.27 settlement from August 12 represents the pre-escalation baseline, 20% below today's price.
On the upside, Monday's session high of $104.95 is the first resistance. Tuesday's $104.43 sits just 52 cents below it. A close above $104.95 would open $105 to $107, where WTI traded briefly when Brent approached $110 on Monday morning. The $110 level is the next major target, a 5.3% gain from today's price.
For Brent, support sits at $105.68, Monday's settlement, and then $105, where the benchmark settled on Friday. The psychological $100 level, crossed for the first time in nearly four months last week, is the major floor. Resistance sits at Monday's intraday high of $109.44, then $110. Above that, the 2026 intraday peak of $126.41 set on April 30 is the extreme upside reference, 17.2% above $107.90.
Momentum is strong. Brent has gained more than 21% in a month. Oil posted an 8% weekly rise heading into Monday. The trend since the August 12 low near $89 on Brent has produced a clear sequence of higher lows: $101.53 on September 9, $105 on September 11, $105.68 on September 14.
Volatility is extreme, and that cuts both ways. Monday's WTI range from $100.53 to $104.95 was $4.42, or 4.4% of price, in a single session. Brent swung from $109.44 to $105.68 within hours. Daily ranges of $4 to $5 mean stop levels need room, and any forecast target can be hit or invalidated in a single headline.
The technical setup favors continuation while $100 holds. A close above $104.95 on WTI confirms the next leg toward $110. A close below $100 on WTI, particularly on a verified diplomatic breakthrough or pipeline restart, would signal a top and open $95.
Scenario Map: Pipeline Restart, Prolonged Outage or Full Escalation
The next 30 days for crude oil depend on three variables: the East-West pipeline, Hormuz traffic and Houthi control of Bab el-Mandeb. They combine into three scenarios.
The first scenario is the base case: the pipeline stays offline for two to four weeks, Hormuz traffic remains below 20 vessels a day and Houthi forces hold their positions without launching a sustained campaign against tankers in Bab el-Mandeb. Inventories keep drawing at 3 to 4 million barrels a day, backwardation holds between $4 and $5 and diplomatic headlines produce short-lived dips. WTI trades between $100 and $110, and Brent trades between $104 and $115. The Wednesday Fed decision and dollar moves add a few dollars of noise in either direction.
The second scenario is the bearish break: Saudi Aramco announces a pipeline restart within days, Hormuz traffic recovers toward 50 vessels a day on U.S. escorts, or a verified U.S.-Iran ceasefire framework emerges through Chinese mediation. The front of the curve collapses, backwardation falls toward $1 and the war premium drains out. WTI drops through $100 toward $95, a decline of 9.0%, and Brent falls toward $100, a 7.3% decline. A full reopening of Hormuz would open the $83 to $89 range from mid-August. The 2027 supply rebound would then take over as the dominant narrative.
The third scenario is the bullish escalation: the pipeline outage extends beyond October, Yanbu's five to seven days of stored oil runs out, and the Houthis begin attacking or mining tankers in Bab el-Mandeb. Saudi exports through both the Gulf and the Red Sea effectively stop. Inventory draws exceed 5 million barrels a day and backwardation widens past $6. WTI breaks $110 and Brent pushes through $115 toward the April 30 peak of $126.41. Diesel prices extend their record run above $6.23 a gallon and central banks face pressure to hike further.
The probabilities favor the base case, with escalation risk higher than de-escalation risk. The pipeline damage is extensive enough to keep the line largely out of service for weeks. Hormuz talks have been postponed. The U.S. declined to strike the Houthis. None of the de-escalation triggers are close to being met.
Two scheduled events add near-term catalysts. The weekly U.S. crude inventory report lands Wednesday at 10:30 a.m. ET, hours before the Fed statement. A large draw would confirm U.S. barrels are being pulled into export markets to replace Saudi supply. A build would suggest demand destruction is outpacing the supply loss.
Oil Price Forecast Verdict: $100 Floor, $110 WTI Target, $95 Risk on a Restart
Crude oil is pricing a structural supply loss, not a headline spike. WTI at $104.43 and Brent at $107.90 reflect the closure of Saudi Arabia's East-West pipeline, the only reliable bypass around a Strait of Hormuz that saw just seven ship crossings on September 10, and a Houthi advance that now threatens the 6.2 million barrels a day moving through Bab el-Mandeb. Saudi Arabia is canceling September cargoes to Europe, Asian refiners have no loading schedules at Yanbu, and 4 million barrels a day, 4% of global supply, is at risk.
The buffer is running out. Global inventories have drawn 507 million barrels since February, including 95 million barrels in August. Global supply is set to fall 5.7 million barrels a day in 2026, outpacing a 2.5 million-barrel-a-day demand decline. Refinery runs sit 4.2 million barrels a day below last year, diesel is at a record above $6.23 a gallon and the WTI backwardation has widened to $4.44 from under $1 a month ago.
The short-term bias is bullish. WTI has defended $100 twice in 48 hours, at $100.53 on Monday and $100 overnight Tuesday. A daily close above Monday's $104.95 high targets $107 and then $110 on WTI, a 5.3% gain from $104.43. On Brent, a close above $109.44 targets $110 and then $115. An escalation scenario in which the pipeline stays shut beyond October and Yanbu storage runs dry would put Brent's April 30 peak of $126.41 in play.
The downside risk is diplomatic and mechanical. A confirmed pipeline restart date, a verified Hormuz traffic recovery or a ceasefire framework would drain the front-month premium, collapse the backwardation and send WTI through $100 toward $95. Monday showed how quickly headlines can knock $4 off Brent, but it also showed how quickly unverified claims fade.
The 30-day forecast range is $95 to $110 on WTI and $100 to $115 on Brent, with $100 on WTI as the pivot. As long as the East-West pipeline stays offline and both chokepoints remain contested, dips toward $100 are buying opportunities for physical buyers, and the path of least resistance runs to $110. A daily WTI close below $100 on a verified restart or reopening is the signal that the war premium has peaked, and until that happens, $100 is the floor for the market.