Brent ($88.93) and WTI ($83.09) Fade a 7.9% Surge as OPEC+ Adds 188,000 bpd It Cannot Ship Through Hormuz — Path to $85
Brent touched $92.65 before reversing 2%, despite overnight US strikes on dozens of IRGC sites | That's TradingNEWS
Key Points
- Brent trades at $88.93 after touching $92.65, up 25.8% over the past month; WTI sits at $83.09.
- Wednesday settled Brent at $90.74 (+7.9%) and WTI at $84.46 (+6.6%), the largest gains in over two weeks.
- OPEC+ output fell to 33.13 million bpd in May from 42.77 million in February despite five straight quota increases.
Brent crude is changing hands near $88.93, down roughly 2% on the session, after reaching $92.65 by 6:30 a.m. Eastern — $3.12 above where it traded at the same hour Wednesday. West Texas Intermediate sits at $83.09, off about 1.6%, with one feed logging $83.86 and a 60-cent decline earlier in the morning. That is a $3.72 intraday swing in the international benchmark on a day when the United States launched a heavy wave of strikes against Iran overnight. The market opened pricing escalation and spent the morning selling it.
Wednesday's settles frame the reversal. Brent closed at $90.74, up 7.9% — its largest single-day gain in more than two weeks. WTI settled at $84.46, up 6.6% and, on one measure, up 6.20% for its biggest daily advance since June 1. That surge came after the president said the US would hit Iran hard in retaliation for an attempted surprise attack on American forces, with Iran's Revolutionary Guard having launched ballistic missiles at a US base in Jordan that Central Command said were intercepted.
The medium-term move is larger than the daily noise suggests. Brent is up 25.8% over the past month and 25.6% year over year. WTI is up 21.1% over the month and 20.3% year over year. A month ago Brent traded near $72 — back at pre-war levels — after the market had convinced itself the conflict was resolving. It is now $17 higher, and it got there in four weeks.
Today's price action is the tell that matters for the forecast. Central Command struck dozens of Islamic Revolutionary Guard sites overnight in the second consecutive night of major operations. Iran's Revolutionary Guard has threatened further escalation. Two ships were hit by a drone attack at Egypt's Port Damietta, a liquefied natural gas hub, with no claim of responsibility. And Brent fell 2%.
A market that sells a major escalation is a market that has stopped pricing headlines and started pricing physical flows. That is a meaningful regime change from March through June, when every strike produced a sustained bid. It means the marginal trader now believes Hormuz throughput is recovering faster than the military tempo is disrupting it — and it means the risk premium currently embedded in the $89 print is considerably thinner than the headlines imply. Both the bull and bear cases below run through that single judgment.
Wednesday's 7.9% Was the Biggest Move in Two Weeks and It Did Not Hold
The sequence over the last week is the cleanest available read on how the market is processing this conflict. Crude fell for three consecutive sessions into Tuesday on diplomatic optimism, then surged more than 4% toward $83 on Wednesday morning as renewed hostilities reignited after several days of relative calm, then extended to a 6.6% WTI gain and a 7.9% Brent gain by the settle. Thursday opened higher again at $92.65 Brent and has since surrendered the entire overnight move.
That pattern — violent spike, partial hold, full retracement inside 24 hours — has repeated three times this month. Brent reached $101 in mid-July, its highest since May, then dropped about 4% to $96 and back under $100 within two sessions. It spiked above $100 earlier in the month before falling more than 6% toward $92 on diplomatic signals. Each escalation has produced a smaller and shorter-lived rally than the last, which is the signature of a market working through a risk premium rather than repricing a supply loss.
The physical data underneath is genuinely tightening, which makes the fade more informative. American Petroleum Institute figures showed crude inventories falling 3.3 million barrels last week, pointing to continued tightness in global supply. The official weekly report released Wednesday showed commercial crude posting its largest draw since mid-June. Those are constructive prints, and Brent still could not hold $92.
Two explanations fit. The first is that the July 5 decision by seven OPEC+ members to add 188,000 barrels per day from August — the fifth consecutive monthly increase — combined with recovering Hormuz transit volumes has convinced the market that supply normalisation is underway regardless of the military situation. The second is positioning: the same de-risking that hit semiconductors and crypto through July has been unwinding commodity length, and a crowded long into a conflict everyone expects to end is exactly the trade that gets trimmed into strength.
Both are probably operating. The practical consequence for anyone modelling this market is that headline-driven spikes should be sold rather than chased until Hormuz throughput visibly deteriorates again. The escalation trade has stopped paying, and it stopped paying on a day when the escalation was real.
The 2026 Chart: $57 to $115 to $72 to $92 in Seven Months
The annual path explains why positioning is so unstable. WTI opened 2026 near $57 a barrel with Brent around $62 in a pronounced downtrend, and monthly technical configurations reading Strong Sell across the board. The market was pricing a glut. Then the United States and Israel launched joint strikes on Iran on February 28, and Iranian forces declared the Strait of Hormuz closed on March 4, threatening and carrying out attacks on transiting vessels.
The move that followed was among the most violent in modern crude history. WTI spiked to almost $115 on April 7 as the strait effectively closed to tanker traffic, with Brent peaking above $120. Traffic through the waterway collapsed to as few as two tankers a day at the height of the conflict, and some vessels reportedly paid as much as $2 million per transit to negotiate passage with the Revolutionary Guard. Roughly 25% of the world's seaborne oil trade and 20% of global liquefied natural gas moved through that channel before the war.
The unwind was equally violent. A memorandum of understanding signed between Tehran and Washington on June 17 committed both sides to removing obstacles to maritime traffic for the duration of talks. Transit recovered — one US official put flows through the lane above 10 million barrels a day. Brent averaged $85 in June, down $22 from May and $32 from the April peak, and fell to roughly $72 by July 3, back to levels last seen just before the February attacks. Chinese import weakness, higher non-Middle East exports and a record coordinated strategic stock release did the rest.
Then July reversed it again. Renewed hostilities from early July pushed Brent back above $100, and the current $89 print sits roughly in the middle of a $72 to $120 annual range.
That range is the forecasting problem in one number. A 66% peak-to-trough band inside seven months means every technical level is contaminated by a geopolitical event, and every fundamental model has been wrong at least twice. The monthly technical configuration has swung from Strong Sell in January to Strong Buy in June and has since cooled to a modest Buy, with the weekly frame near neutral — an honest reflection of a market with no trend, only regimes.
Hormuz Is Still the Only Variable That Genuinely Matters
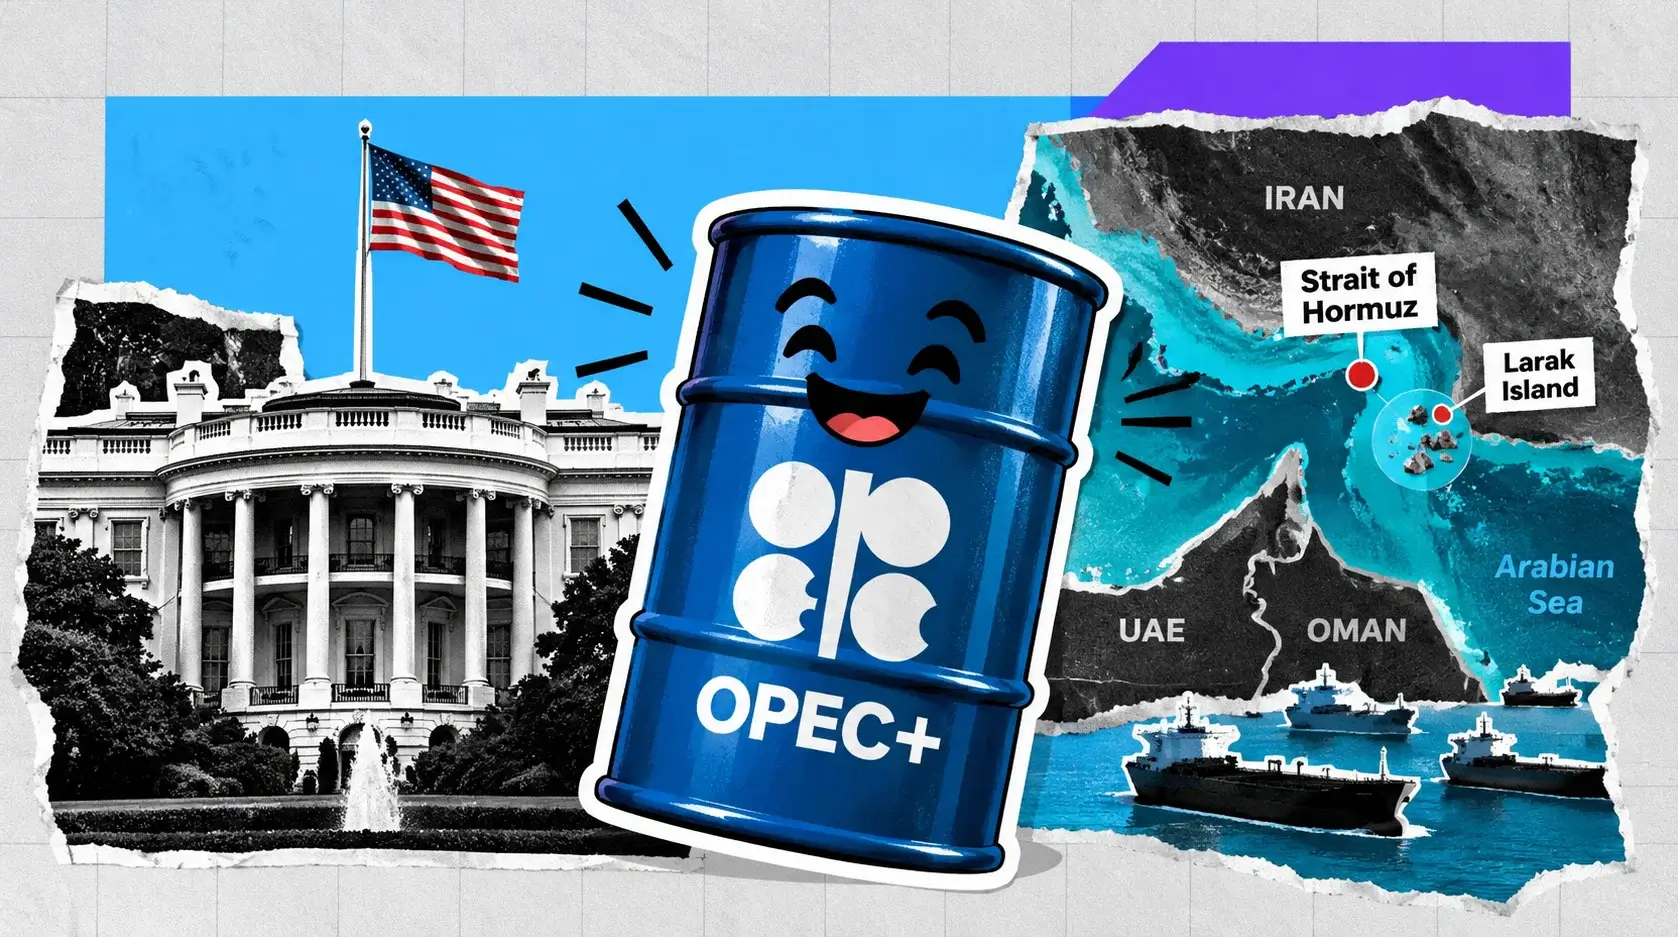
Everything else in this forecast is second-order. The strait sits at the entrance to the Persian Gulf between Iran and Oman, and before February it carried about a quarter of seaborne crude and a fifth of global LNG. Iranian forces declared it closed on March 4 and have alternately restricted, taxed and attacked traffic since — at times allowing passage only for vessels from select countries required to negotiate transit directly with the Revolutionary Guard.
The damage tally is substantial: at least 17 merchant vessels damaged with seven abandoned, two ships captured, one tugboat sunk, twelve seafarers killed or missing. Sea mines were laid in the waterway and remain there. The US conducted a naval blockade of Iranian ports from mid-April through late May and has run escort operations since. The US-led maritime security body headquartered in Bahrain downgraded the threat assessment from severe to substantial after the June memorandum, warning that an attack remained a strong possibility and that mines persisted on all approaches — before raising it back to severe following the July attacks on three vessels.
The current state is contested and deteriorating at the margin. Tehran continues to insist on retaining control of the strait, which remains the central unresolved provision in peace negotiations. Qatar and Pakistan are working to bring both sides back to the table. Oman has drafted a proposal to manage traffic through two separately controlled routes. US officials have maintained that talks cannot progress until ships are assured safe passage.
Meanwhile the conflict has widened rather than narrowed. Iran-backed Houthi forces in Yemen have threatened to blockade Saudi Arabia and have targeted the pipeline moving Saudi crude to Yanbu on the Red Sea. Saudi warplanes have joined US strikes on Iran-linked militias in Iraq after those militias launched drones at oil facilities in Riyadh and the Eastern Province. The Bab el-Mandeb Strait at the southern end of the Red Sea — the primary alternative route — is now itself a theatre.
Both choke points for Middle East oil exports are contested simultaneously. That is the structural condition beneath a $89 Brent print, and it is the reason the downside cases below have a hard floor considerably above where the fundamentals alone would put them.
OPEC+ Raised Quotas Five Times and the Barrels Cannot Move
Seven core OPEC+ members voted on July 5 to add 188,000 barrels per day to August production targets, the fifth consecutive monthly increase since April. Ministers from Saudi Arabia, Russia, Iraq, Kuwait, Kazakhstan, Algeria and Oman held virtual talks and agreed to implement the adjustment, while reserving the right to increase, pause or reverse the phase-out. Across April through July the group had already hiked quotas by almost 800,000 barrels per day.
Those increases have been largely symbolic, and the production data proves it. OPEC+ output fell to 33.13 million barrels per day in May from 42.77 million in February — a collapse of 9.64 million barrels per day, or roughly 23% of the group's output, in three months. Combined production from Saudi Arabia, Iraq and Kuwait alone fell by some six million barrels per day between the first quarter and May. Output began recovering in June on US efforts to help Gulf producers export more, but remains well below pre-war levels.
The organisational picture has deteriorated alongside the operational one. The United Arab Emirates has left the core group. Iraq has signalled it wants higher quotas following that departure. Every member that overproduced since January 2024 remains obliged to compensate, tracked monthly by the compliance committee. A cartel managing a supply shock it cannot physically deliver into, while losing members and fielding quota disputes, is not a stabilising force.
This creates an unusual and underappreciated asymmetry for the price outlook. Normally, spare capacity caps rallies — OPEC+ has barrels it can release, and the market knows it. Right now the group has enormous nominal spare capacity and no reliable route to market for most of it. The quota is a promise; the pipeline and the strait are the constraint.
The implication is that any genuine Hormuz resolution unleashes a supply wave far larger than the quota increases suggest, because it releases both the announced increments and the roughly nine million barrels per day of lost output simultaneously. That is the mechanism behind the sharpest bear case available. Conversely, until the strait clears, OPEC+ decisions are close to irrelevant to the physical balance, and traders reading the monthly announcements as a supply signal are reading the wrong document.
The Saudi Delivery Gap: 10.35 Million on Paper, Four to Five at Yanbu
The August decision raised Saudi Arabia's quota to 10.35 million barrels per day. The kingdom's actual production stood at roughly 7.76 million in March, already 2.5 million below quota. The gap is not a compliance choice. It is a pipe.
Before the crisis, 7 to 7.5 million barrels per day of Saudi crude flowed through Hormuz. The East-West Petroline — Riyadh's only bypass, running to Yanbu on the Red Sea — reached its physical maximum of 7 million barrels per day on March 11 and cannot move an additional barrel. After domestic refineries absorb roughly 2 million, Yanbu's terminals can load approximately 4 to 5 million for export. Loading a very large crude carrier takes 24 to 36 hours per vessel depending on grade and terminal operations, which caps throughput at the berth independent of pipeline capacity.
That leaves a permanent shortfall of 3 to 3.5 million barrels per day of Saudi crude that was routed through Hormuz and cannot be rerouted. No production decision changes it. The delivery gap against the new quota runs 5.35 to 6.35 million barrels per day. This is infrastructure, not policy, and it does not resolve on any timeline shorter than years.
Compounding it, the Yanbu route is now itself under threat. Houthi forces have explicitly targeted the pipeline infrastructure carrying Saudi crude to that terminal and have declared a maritime embargo posture in the southern Red Sea. Riyadh is relying on that route precisely because Hormuz shipping is disrupted. A successful strike on the Petroline or the Yanbu terminals would remove the single largest functioning workaround in the entire Gulf.
For the price forecast this matters more than any inventory statistic. The bull case for crude does not require a new escalation in Hormuz. It requires only a successful interdiction of the bypass, which is a smaller and more achievable operation than closing the strait. Markets are pricing Hormuz risk with reasonable sophistication. They are pricing Red Sea pipeline risk barely at all, and that is where the fat tail sits between now and the fourth quarter.
US Inventories: The Largest Draw Since Mid-June and an Eighteen-Week Slide
The weekly petroleum status report released Wednesday, covering the week ended July 24, showed commercial crude inventories posting their largest draw since mid-June — reinforcing signs of a tightening physical market. The industry group's figures had pointed the same direction, showing a 3.3 million barrel decline. That is a genuine tightening signal and it arrived alongside the largest single-day price gain in two weeks.
The base levels give context. For the week ending July 17, commercial crude excluding the strategic reserve stood at 411.7 million barrels after a 2.0 million build, roughly 6% below the previous five-year average. Gasoline inventories rose 0.8 million and sat 7% below the five-year average. Distillate rose 1.4 million and sat 10% below. Cushing, the delivery hub for the American benchmark, held 19.4 million barrels — a low absolute level that makes the WTI contract mechanically sensitive to small physical changes.
Products are the tighter side of the barrel and the more informative one. Distillate at 10% below the five-year average with refining margins elevated is the configuration that pulls crude into refineries regardless of what the crude balance says in isolation. Gasoline at 7% below average heading into the back half of driving season adds to it. A market with thin product cover and a contested supply route does not need a new escalation to squeeze; it needs a single refinery outage.
The counterweight is that these are American figures in a market whose imbalance is Middle Eastern. US commercial stocks 6% below a five-year average is a modest deficit by historical standards, and the country is a net exporter with production largely unaffected by the conflict. The tightness that matters is in Asia and Europe, where refiners have lost access to Gulf grades and are bidding for Atlantic Basin and West African barrels — which is precisely why Brent has traded at a wider premium to WTI throughout this crisis than it does in normal conditions.
Watch that spread. A widening Brent-WTI differential signals Middle East supply stress transmitting to the international benchmark. A narrowing one signals normalisation. It is a cleaner real-time indicator than either outright price.
The Strategic Reserve at a 1983 Low Removes the Policy Buffer
The strategic petroleum reserve declined for an eighteenth consecutive week, falling to its lowest level since 1983. It stood at 311.4 million barrels for the week ending July 17 and has drawn every week for more than four months. That is the single most consequential statistic in this entire analysis and it receives almost no attention.
The reserve exists to absorb exactly the kind of shock currently underway. It has been doing so — the International Energy Agency coordinated a record global strategic stock release that, together with Chinese import weakness and higher non-Middle East exports, was a primary reason Brent returned to pre-war levels by early July despite persisting supply disruptions. That release is a substantial part of why crude is at $89 rather than $120.
The problem is that the buffer is a stock, not a flow. Eighteen consecutive weeks of drawdown to a 43-year low means the tool that has been suppressing prices all year is running out of capacity. Every additional week of release lowers the ceiling on what the policy response can absorb next time, and the mechanism has no self-replenishment — refilling it requires buying barrels in the same market it is trying to calm, at prices well above where the reserve was drawn.
This creates a specific and dateable asymmetry. Through the first half of 2026, geopolitical escalations were met with coordinated stock releases that capped rallies. Through the second half, that response function weakens with every barrel released. A supply disruption in September or October — a strike on the Petroline, a mine detonation in the strait, a Yanbu terminal outage — would hit a market with materially less policy cushion than the same event would have hit in April.
The practical read: the distribution of outcomes for crude prices is becoming more right-skewed even as the central expectation drifts lower. Consensus forecasts are being cut on demand destruction and supply normalisation, and they may well be correct on the median path. But the tail risk is fattening at exactly the moment the instrument designed to manage it is at its weakest level in four decades. Options structures are the appropriate expression of that view rather than outright length.
Read More
-
Yen Stalls at 160 Despite a 3% JGB and Tokyo Core CPI at 2.0% — Intervention Sits at 164, Friday's Payrolls Decide
02.09.2026 · TradingNEWS ArchiveEnergy
-
QQQI ETF Pays 13.96% While The Nasdaq-100 Rolls Over — Why Section 1256 Is Worth More Than The Yield
14.09.2026 · TradingNEWS ArchiveStocks
-
XRP ETFs Took $19M In A Week After A $110M Record — Why The Filings Tell A Different Story Than The Flows
14.09.2026 · TradingNEWS ArchiveCrypto
-
US Gas Holds $2.88 While Europe Pays $28 — Why Only A Tenth Of The War Premium Reaches Henry Hub
14.09.2026 · TradingNEWS ArchiveCommodities
-
Yen Holds Near February Highs As Tokyo Prepares Its Highest Rate Since 1995 — Why The Yield Gap Will Not Move
14.09.2026 · TradingNEWS ArchiveForex
Demand Destruction, China, and the Downgrade Nobody Expected
The bearish half of this market is real and it has been underweighted in commentary focused on the conflict. One major bank now forecasts Brent averaging $86 in the third quarter, $80 in the fourth and $78 at year end — a cut from a previous year-end forecast of $95. The stated reason is that the oil market has rebalanced through larger-than-expected demand losses combined with smaller-than-expected OECD commercial inventory draws, with China presented as the case study in demand destruction.
That framing deserves emphasis because it inverts the usual narrative. The market did not absorb a nine-million-barrel-per-day supply shock by drawing inventories. It absorbed it by destroying demand. Chinese crude imports fell materially, refiners globally reduced runs against elevated feedstock costs, and consumption responded to $100-plus prices the way economic theory says it should. The bank's own framing was that it had expected the shock to be absorbed through a roughly equal combination of demand losses and inventory draws — and demand did more of the work than modelled.
Demand destroyed at $115 does not automatically return at $89. Industrial consumption lost to substitution, efficiency and outright production curtailment is sticky, and the countries that spent the spring diluting petroleum with ethanol and sourcing from alternative distributors have built supply relationships that will not unwind on one quarter of lower prices. That is a structural headwind to the recovery leg of any bull case.
The same assessment concluded that long-term damage to Gulf region production capacity is believed to be minimal — the wells and the fields are intact. What is damaged is the route, not the resource. That distinction sets up the sharpest version of the bear case: the moment Hormuz genuinely clears, roughly nine million barrels per day of latent supply meets a demand base that has been permanently reduced, into a market where OPEC+ has already committed to five consecutive monthly quota increases and lost the discipline of a departed member.
The resulting glut would not be modest. It would be one of the largest supply overhangs of the modern era, and it is the reason serious forecasters are publishing numbers with a seven handle for year-end.
The EIA Says $74 and the Forward Curve Disagrees
The official short-term outlook published this week is considerably more bearish than the bank consensus. It forecasts Brent averaging $74 per barrel in the third quarter — a reduction of $27 from the prior month's outlook — and expects ongoing inventory accumulation over the next year to keep pressure on prices, with Brent falling to an average of $65 in 2027. Lower crude is expected to feed through to American retail gasoline prices in the third quarter.
A $27 single-month revision is extraordinary and it tells you how quickly the supply-normalisation thesis took hold. It also puts the official forecast roughly $15 below spot with two months of the quarter already elapsed, which means the projection requires Brent to spend August and September in the $60s to average $74 for the period. That is not impossible — the benchmark traded at $72 as recently as July 3 — but it requires the strait to clear decisively and the current escalation to abate within weeks.
The gap between $74 official, $86 bank consensus and $89 spot is not a disagreement about fundamentals. It is a disagreement about the probability of a Hormuz resolution and its timing. Every model reaches roughly the same supply-demand balance conditional on the strait reopening; they differ on when that happens and how much risk premium to carry until it does.
For a trader, that gap is the entire opportunity set. The official forecast is effectively a short position on geopolitical risk with a September expiry. The current spot price embeds roughly $15 to $20 of premium over the underlying balance. If the memorandum holds and mine clearance proceeds, that premium bleeds out and the official number is closer to right. If the Petroline is struck or the strait closes again, the premium doubles.
The honest framing is that no fundamental model is currently forecastable to within $20, and anyone presenting a point estimate for year-end Brent is expressing a geopolitical view dressed as a commodity view. The scenario weights below are stated explicitly for that reason.
The Inflation Channel: Every Central Bank Is Now an Oil Trader
Crude is currently the most important variable in global monetary policy, and that transmission runs both ways into the oil price itself. The Federal Reserve held at 3.50% to 3.75% on Wednesday with three dissents favouring a hike, and the chair noted inflation remained above target partly because supply shocks had raised prices in sectors including energy. June core PCE eased to 3.3% from 3.4%, and that improvement was built substantially on a 5.9% drop in energy goods and services prices with gasoline down 9.2% — achieved during the brief ceasefire window that has now closed.
The European side is sharper. German July inflation jumped to 2.8% from 2.3% with energy prices up 8.3% year over year. Spanish inflation hit 3.5%, the highest since May 2024. Euro area energy inflation was still running at 8.5% in June after slowing from 10.8% in May. The European Central Bank held at 2.25% on July 23 and explicitly warned it was watching whether higher energy costs feed into broader prices, with markets now pricing roughly 79% odds of a September hike.
The feedback loop is what makes this dangerous for oil bulls. Higher crude pushes both central banks toward tightening. Tighter policy slows growth. Slower growth destroys demand. Demand destruction caps crude. That circuit is currently the most reliable ceiling on the oil price, and it operates with a two-to-three-month lag — meaning the demand response to July's $100 print has not yet fully appeared in the data.
The 30-year Treasury yield at 5.21%, a nineteen-year high, is the market's expression of exactly this. Traders removed the near-term hike after the hold while demanding materially more compensation for long-run inflation risk, and the single largest contributor to that risk assessment is energy. The bond market is telling you it expects crude to keep pressuring prices.
For the crude forecast, treat the macro as a governor rather than a driver. It will not push prices higher, and it will pull them lower with a lag if the current level holds. That argues for fading rallies above $95 and respecting the $80 area as a floor where the demand response reverses.
Technicals: $83 Pivot, $95 Cap, $100 the Line That Changes the Macro
The technical picture is unusually clean for a market this disrupted, largely because the geopolitical levels and the chart levels have converged. WTI's monthly configuration reads Buy on oscillators with moving averages at Strong Buy — a marked reversal from the Strong Sell alignment in early 2026 when the contract traded near $58, though it has cooled from Strong Buy since June. The daily frame stays modestly bullish while the weekly has moved close to neutral, reflecting the tension between a fading geopolitical premium and a still-adjusting structural picture.
The pivot for WTI sits near $79.67, and that number carries weight beyond the chart: it is roughly where the demand-destruction response reverses and where the official third-quarter forecast implies the contract should trade. Below it, $76 marks the top of the pre-escalation July range and $72 is the level Brent returned to on July 3 when the market briefly believed the war was over. Beneath that, the $62 to $65 area represents the 2027 official forecast and the early-2026 downtrend.
Above spot, Brent faces first resistance at $92.65 — today's high — then $96, where the mid-July rally stalled after a 4% reversal. The $100 level is the one that matters, and not for chart reasons. Brent above $100 for a sustained period rebuilds the energy contribution to August and September inflation prints in both the United States and the euro area, which forces both central banks toward September hikes and triggers the macro circuit described above. It is a level with a policy consequence attached, which makes it a harder ceiling than a technical one.
The Brent-WTI spread deserves monitoring alongside outright price. It has run wider than normal throughout this crisis because Middle East disruptions hit Brent-priced barrels more directly than American domestic production. Compression signals normalisation; expansion signals renewed Gulf stress. It has been a better leading indicator than either flat price this year.
The disciplined trading framework: fade Brent above $95 unless the Petroline or Yanbu is struck. Buy weakness toward $80 on the physical tightness in products and the depleted strategic reserve. Avoid outright positions between those levels, where the geopolitical variance swamps the fundamental signal.
The Forecast: $85 Base, $105 Bull, $72 Bear Into the Fourth Quarter
The base case, at roughly 45% probability, is Brent oscillating between $80 and $95 through the third quarter and settling near $85 by year-end, with WTI four to six dollars beneath. This requires the current escalation to remain a strike-and-retaliate cycle rather than a supply event, Hormuz throughput holding above the recovering ten million barrels per day, and the Yanbu bypass staying intact. Under this path the geopolitical premium bleeds slowly rather than collapsing, product tightness provides a floor, and demand destruction caps the upside. That sits between the official $74 and the $86 bank number, and it acknowledges that both models are conditional on a resolution neither can date.
The bull case, around 30%, does not require a new Hormuz closure. It requires a successful interdiction of the East-West Petroline, a strike on the Yanbu terminals, or a mine detonation that halts transit for more than a week. Any of those removes 3 to 5 million barrels per day with a strategic reserve at a 43-year low and no policy buffer to deploy. Brent trades through $100 immediately and $105 to $115 becomes the range, revisiting the April high near $120 if two events coincide. The Red Sea and Bab el-Mandeb are now active theatres and this is the most underpriced scenario in the market.
The bear case, around 25%, is a genuine diplomatic resolution. Qatari and Pakistani mediation succeeds, mine clearance begins, the blockade lifts and sanctions relief triggers. Roughly nine million barrels per day of latent OPEC+ output meets five consecutive monthly quota increases and a demand base permanently reduced by two quarters of $100-plus prices. Brent breaks $80, tests the $72 July low, and the official $74 third-quarter average becomes achievable. Year-end at $70 or below is realistic on this path.
The disciplined posture at $89 is short volatility premium rather than directional. Sell rallies above $95, buy weakness toward $80, and own upside optionality funded by that range — because the median path drifts lower and the tail has never been fatter.