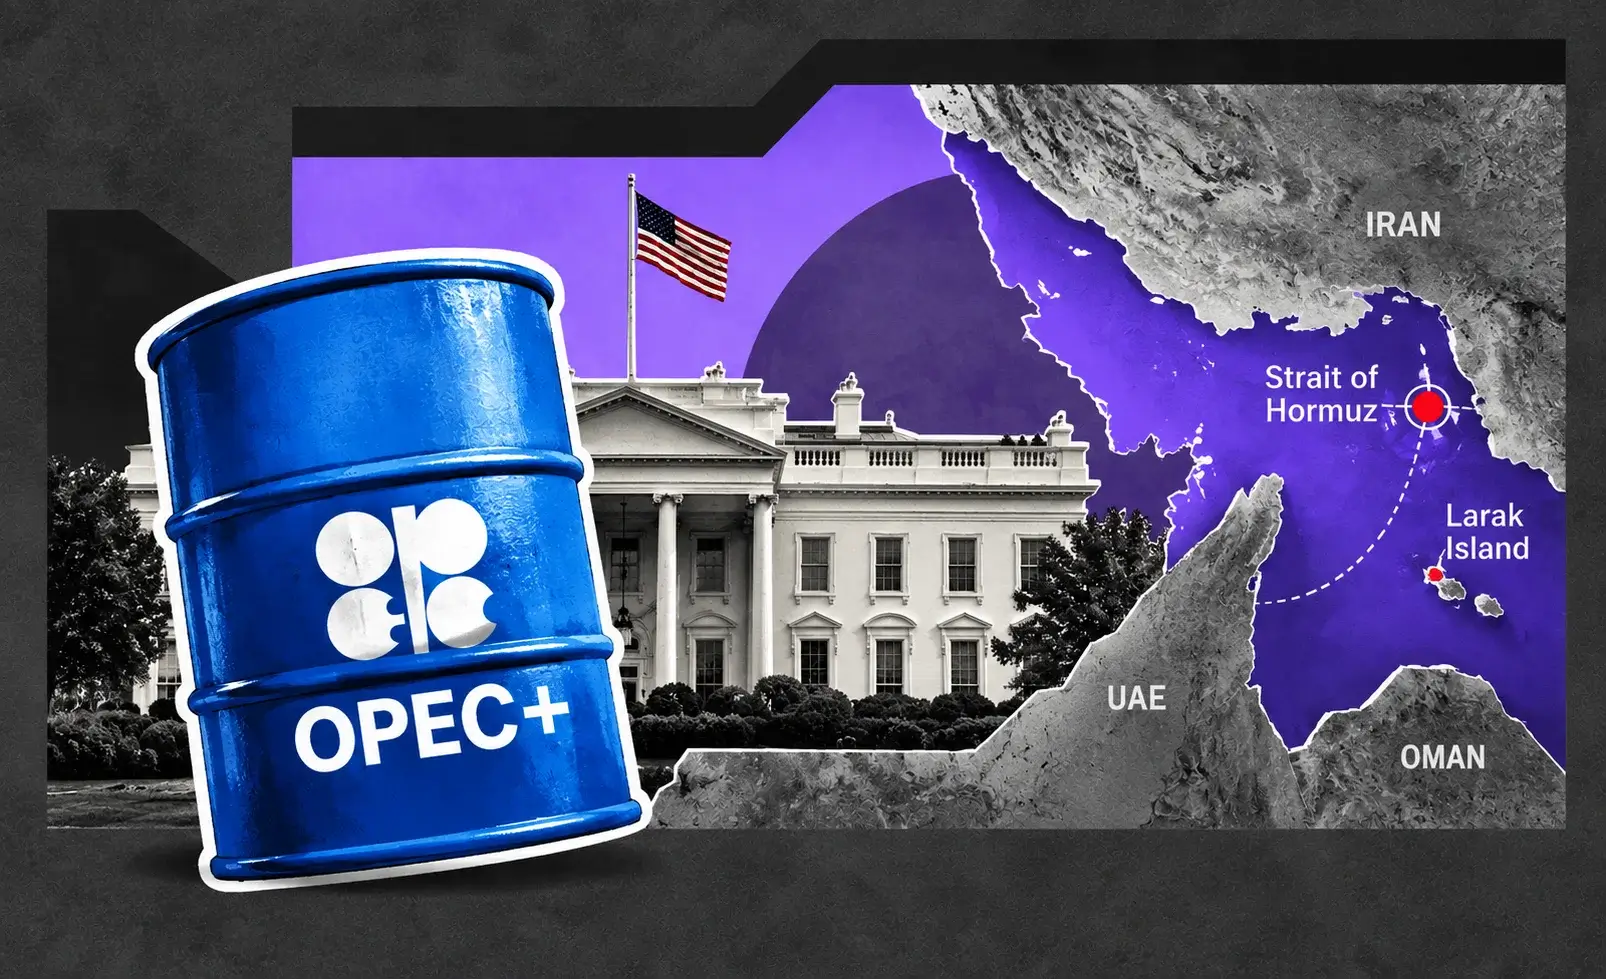
WTI ($103.20), Brent ($107.60) Hold Above $100 as 10M Barrels a Day Stay Shut In — 9.7% Upside to $118
Global inventories are down 400M barrels this year and the SPR sits at 285M barrels | That's TradingNEWS
Key Points
- EIA data showed U.S. crude stocks fell 640,000 barrels to 423.4 million, contradicting a 7.14 million-barrel industry build.
- More than 10 million barrels per day of Gulf oil production remains shut in, with global supply set to fall 5.7 million b/d.
- Brent must clear $109.21 to open $110 and $118, while a close below $105 exposes the $100 floor.
Crude oil is giving back part of its two-day surge on Wednesday, September 16, 2026, but the pullback has done nothing to change a market that is short of barrels. West Texas Intermediate fell 1.80% to $103.90 in early trading and extended the decline below $103, trading at $103.20, down 2.5% from Tuesday's settlement near $105.83. Brent crude slipped 0.90% to $107.80 early and slid toward $106 later in the session after trading at $107.60. The WTI-Brent spread stands at $4.40.
The context matters more than the daily move. Brent climbed to $109.21 on Tuesday, a four-month high, up 3.34% on the session. The benchmark is up 20.19% over the past month and 59.51% from a year ago. WTI traded as high as $107.38 intraday on Tuesday. Both benchmarks sit more than 20% above their early-August levels, when WTI settled at $84.67 and Brent traded at $87.38 after the OPEC+ meeting.
Three forces pulled prices lower on Wednesday. First, an industry survey reported a 7.14 million-barrel build in U.S. crude inventories for the week ending September 11. Second, Saudi Arabia began offering additional crude cargoes to Asian refiners through ship-to-ship transfers off Oman's Sohar port, easing fears that the shutdown of its East-West Pipeline would strand exports. Third, U.S. Energy Secretary Chris Wright said the pipeline outage should last only days.
The official data then undercut the bearish read. The Energy Information Administration reported that U.S. commercial crude inventories fell by 640,000 barrels to 423.4 million barrels, a draw rather than a build, although smaller than expected. Stocks at the Cushing, Oklahoma, delivery hub also declined. The 7.78 million-barrel gap between the industry estimate and the government figure is the story of this market: sentiment swings on headlines, but physical supply keeps tightening.
The thesis for this forecast is direct. The global oil market is running a structural deficit, with more than 10 million barrels per day of Gulf production shut in, global inventories down 400 million barrels this year, and the U.S. Strategic Petroleum Reserve at 285 million barrels, inside its operational minimum range. That deficit sets a floor under Brent near $100. The ceiling sits near $110, where Saudi rerouting, demand destruction and the Federal Reserve's expected rate hike at 2:00 p.m. ET cap further gains. A pipeline outage that lasts weeks rather than days breaks the ceiling and targets $118, the first-quarter peak. A Russia-Ukraine energy truce and a fast Saudi restart test the $100 floor.
The Two-Day Surge: Saudi Pipeline Shut, Libya Halts, Brent Hits $109.21
Monday and Tuesday delivered the sharpest supply shock since fighting in the Gulf resumed on August 30, and the details explain why Wednesday's pullback is shallow.
The central event is the shutdown of Saudi Arabia's East-West Pipeline. Attacks launched from Iraqi territory forced the closure of the pipeline, which had been allocating up to 7 million barrels per day of Saudi crude to Red Sea export terminals. That route was Saudi Arabia's primary alternative to the Persian Gulf, where Iran's blockade on tankers has halted normal shipments through the Strait of Hormuz. With the pipeline offline, Saudi Arabia lost its most important bypass.
The prolonged disruption to Gulf tanker traffic had already forced major OPEC members to cut production. Saudi output recently dropped to its lowest level since 1990. The pipeline shutdown compounds that damage by removing export capacity from barrels still being produced.
Libya added a second supply hit. The national oil company suspended operations at two oilfields and a pumping station amid protests by the Petroleum Facilities Guard, which shut the Hamada-Zawiya crude-loading pipeline. Libya warned it could declare force majeure. Overall Libyan output has held near 1.4 million barrels per day so far, but any extended outage removes barrels from the Mediterranean market that European refiners depend on.
The market reaction was immediate. WTI jumped 2.64% to $104.10 in early trading on Tuesday, and Brent climbed 2.14% to $107.90. By the afternoon, WTI traded as high as $107.38 and Brent reached $109.21, the highest level in more than four months. WTI climbed roughly $11 per barrel over one week, and Brent gained more than $7.
The price move extended a rally that started in August. Brent had already hit $105 on September 10, when U.S. stocks fell for a fourth straight session. On September 9, Brent passed $101. WTI traded at $96.62 on September 13 before the weekend, meaning Tuesday's high represented an $10.76 gain in two sessions.
The Houthi threat adds a third front. Iran-backed Houthi militants are advancing toward the Bab el-Mandeb Strait while intensifying attacks on Saudi targets and regional shipping. Saudi Arabia intercepted a Houthi drone launched toward Mecca on Wednesday, a claim the group denied. Bab el-Mandeb is the southern gateway to the Red Sea, the same waterway Saudi Arabia was using to bypass Hormuz. If the Houthis disrupt traffic there while the East-West Pipeline stays shut, Saudi Arabia would lose both of its main export alternatives.
The Inventory Data: EIA Draw of 640,000 Barrels Versus a 7.14 Million-Barrel Industry Build
The weekly U.S. inventory data produced a sharp contradiction on Wednesday, and resolving it matters for the near-term price outlook.
The industry survey released Tuesday afternoon estimated that U.S. crude inventories rose by 7.14 million barrels in the week ending September 11. That followed a 300,000-barrel decline the prior week. The same survey showed gasoline inventories rising 1.46 million barrels, reversing a 1.9 million-barrel draw, and distillate inventories gaining 1.61 million barrels on top of a 2 million-barrel increase the week before. A build of that size, during a global supply crisis, triggered Wednesday's early selling.
The Energy Information Administration's official Weekly Petroleum Status Report told a different story. Commercial crude inventories fell by 640,000 barrels to 423.4 million barrels. The draw was smaller than expected, but it was a draw, not a 7 million-barrel build. Cushing inventories also declined. The industry survey had shown Cushing falling 246,000 barrels after a 300,000-barrel drop the prior week.
The longer trend is unambiguous. On August 21, the EIA put commercial crude inventories at 428.9 million barrels. Three weeks later, stocks sit at 423.4 million, a 5.5 million-barrel decline. Commercial crude inventories excluding the SPR have lost just over 41 million barrels across the last 22 weeks, according to industry data. Cushing held 22.4 million barrels on August 21, a thin level for the delivery hub of the world's most traded oil futures contract, and has continued to fall.
The Strategic Petroleum Reserve is the buffer that has kept commercial stocks from falling faster. Another 400,000 barrels left the SPR in the week ending September 11, bringing total reserve holdings to 285 million barrels. That is 446 million barrels below the reserve's maximum capacity of 731 million, leaving it 39% full. The generally accepted operational minimum for the SPR sits between 250 million and 300 million barrels, below which the reserve may struggle to pump and process oil efficiently. At 285 million barrels, the SPR is already inside that range.
Product inventories are the tightest part of the market. Gasoline inventories were 5% below their five-year seasonal average before the latest report. Distillate inventories, which include diesel and heating oil, were 13% below the five-year average. The EIA forecasts that U.S. distillate inventories will drop below 100 million barrels in September and remain below the 2021–2025 five-year low through much of 2027.
The data points to a market with little room for error. The SPR cannot keep covering commercial draws for much longer, and product stocks are already critically low heading into the fall and winter demand season.
Global Supply: More Than 10 Million Barrels Per Day Shut In
The international agency data shows a supply shock of historic scale, and it explains why prices have held above $100 despite demand losses and emergency releases.
According to the International Energy Agency's September Oil Market Report, global oil production fell by 1.6 million barrels per day month over month to 100.1 million barrels per day in August. More than 10 million barrels per day of Gulf output remained shut in amid heightened security risks. The agency expects total oil supply to fall by 5.7 million barrels per day to 100.7 million barrels per day in 2026, with the expected recovery in Gulf production now deferred until 2027. Production is projected to rebound by 8 million barrels per day in 2027.
Non-OPEC+ supply is growing but cannot fill the gap. The Americas, led by the U.S., Canada, Brazil, Guyana and Argentina, are adding 1.4 million barrels per day of output in 2026 and 1 million barrels per day next year. That growth offsets less than a quarter of the Gulf shut-ins.
Refining capacity has taken a direct hit. Global refinery throughput reached a summer peak of 81.4 million barrels per day in August, up 960,000 barrels per day month over month, but 4.2 million barrels per day lower than a year earlier. Losses are spread across the Middle East, Russia and crude-importing economies in Asia. Global refinery runs are forecast to decline by 2.6 million barrels per day to 81.5 million barrels per day in 2026. Refining margins reached record levels in the Atlantic Basin in August, led by sharply higher diesel crack spreads, while surging freight rates weighed on Singapore refining profitability.
Sanctions and blockades add to the supply constraints. The U.S. renewed its blockade on Iran's oil exports after Iranian attacks on tankers in the Strait of Hormuz. The Treasury Department's Office of Foreign Assets Control imposed new rounds of sanctions targeting Iranian economic and oil interests. Attacks on Saudi Arabia's oil exports through the Bab el-Mandeb Strait reduced exports departing from Saudi Red Sea terminals even before the East-West Pipeline shutdown.
Some flows have proved resilient. Crude, condensate and refined products moving through the Strait of Hormuz may have risen above 7.5 million barrels per day since fighting resumed on August 30, and the link between military developments in the strait and actual oil flows has weakened. Saudi Arabia is increasing crude exports through Hormuz with U.S. military assistance while its pipeline remains offline.
The supply picture drives the forecast floor. A market missing more than 10 million barrels per day of normal Gulf production, with global supply set to drop 5.7 million barrels per day this year, cannot sustain prices far below current levels without a major resolution to the conflict
Read More
-
Yen Stalls at 160 Despite a 3% JGB and Tokyo Core CPI at 2.0% — Intervention Sits at 164, Friday's Payrolls Decide
02.09.2026 · TradingNEWS ArchiveEnergy
-
Semtech ($158) Holds $153 as Data Center Revenue Hits $100M and EPS Guide Jumps to $1.05 — 12% Path to Record High
16.09.2026 · TradingNEWS ArchiveStocks
-
XRP ($1.28) Tests $1.25 Support as Commodity Status Survives Senate Defeat — 16.4% Upside to $1.49
16.09.2026 · TradingNEWS ArchiveCrypto
-
Gold ($4,342) Holds 50-Day Average at $4,275 as Fed Decision Nears — 5.1% Upside to August Close at $4,563
16.09.2026 · TradingNEWS ArchiveCommodities
-
S&P 500 SPX Rises to 7,624, Nasdaq IXIC Gains 234 Points, Dow DJI Stalls as INTC Rips 4% Into Fed Decision
16.09.2026 · TradingNEWS ArchiveMarkets
-
GBP/USD (1.3480) Loses 1.3500 as Fed Hike Flips Rate Gap Against Bank Rate at 3.75% — 80 Pips to August Low at 1.3400
16.09.2026 · TradingNEWS ArchiveForex
The Inventory Drawdown: 400 Million Barrels Gone and 3.0 Million Barrels Per Day in Q3
Global stockpiles are the shock absorber for the supply crisis, and the rate at which they are being depleted sets the timeline for how long prices stay elevated.
The EIA's September Short-Term Energy Outlook, released on September 9, estimates that global oil inventories have decreased by 400 million barrels so far in 2026. The agency estimates inventories fell by an average of 3.9 million barrels per day in the second quarter. It forecasts additional draws of 3.0 million barrels per day on average in the third quarter and 1.7 million barrels per day in the fourth quarter.
The third-quarter draw alone amounts to 276 million barrels across 92 days. Adding the fourth-quarter forecast of 1.7 million barrels per day over 92 days removes another 156 million barrels. By year-end, cumulative 2026 inventory losses would exceed 800 million barrels on the EIA's trajectory, a drawdown unmatched in modern oil market history.
China's behavior shows how importers are responding. Dwindling stockpiles in China drove the world's largest crude importer to raise orders in August, adding competition for the limited barrels available outside the Gulf. Saudi Aramco has reportedly delayed some deliveries to European customers because of the East-West Pipeline disruption, increasing competition for alternative supplies in the Atlantic Basin.
The EIA's price forecast reflects that drawdown. The agency now expects the Brent spot price to average around $90 per barrel in the second half of 2026, $8 per barrel higher than its previous outlook. Brent averaged $91 per barrel in August, $7 higher than in July. The EIA expects falling inventories to keep prices near the August average in the coming months.
The gap between the EIA forecast and the market is significant. Brent at $107.60 trades $17.60 above the agency's second-half average forecast of $90. Either the market is pricing a larger disruption than the EIA modeled, or current prices include a geopolitical risk premium that fades if the East-West Pipeline restarts quickly. The EIA's forecast was completed on September 3, before the pipeline shutdown.
The longer-term path points lower. As Middle East exports gradually increase and shut-in production restarts, the EIA forecasts Brent falling to an average of $77 per barrel by the second quarter of 2027 and $67 per barrel in the second half of 2027, with a full-year 2027 average of $74. The agency assumes some constraints on Middle East exports persist through the end of 2026, keeping regional production below pre-conflict averages until the second quarter of 2027.
For traders, that forecast frames the risk: the deficit keeps prices high through year-end, but the futures curve should price a steep decline into 2027 once flows normalize.
OPEC+: October Quotas Frozen, 2 Million Barrels Per Day of Cuts Still in Place
OPEC+ policy has become secondary to physical disruptions, but the group's decisions still shape the medium-term supply outlook.
On September 6, OPEC+ confirmed that its combined oil production quota would remain unchanged for October 2026. The freeze followed a final 188,000 barrel-per-day increase in September, which completed the phased return of roughly 1.65 million barrels per day of voluntary cuts first agreed in 2023. The group approved that September increase on August 2, and WTI and Brent barely reacted, because quotas do not move barrels that are physically trapped behind Hormuz and the Bab el-Mandeb.
A separate layer of cuts totaling around 2 million barrels per day, dating to 2022, remains in place through the end of 2026. OPEC+ members are also running a production capacity review ahead of setting 2027 baselines, with quota negotiations expected later in the fourth quarter.
The distinction between quotas and actual output has never been wider. Saudi Arabia's production has fallen to its lowest level since 1990 because it cannot export barrels through normal routes, not because of any quota decision. Iran's exports are constrained by the U.S. blockade and sanctions. The UAE, Kuwait and Iraq face similar shipping disruptions through the Gulf. OPEC+ spare capacity, which normally provides a ceiling on prices during supply shocks, is largely unusable because the spare barrels sit in the region where exports are blocked.
That dynamic changes how the market treats OPEC+ announcements. In normal conditions, a freeze on quotas with 2 million barrels per day of cuts still in place would be bullish, signaling the group is keeping supply tight. In current conditions, the market views it as irrelevant to near-term flows. The quota decision that matters will come when shipping normalizes and Gulf producers want to recover market share lost to the Americas.
The 2027 baseline review is where OPEC+ becomes relevant again. The IEA expects global production to rebound by 8 million barrels per day in 2027 as Gulf output recovers. If OPEC+ members return to production with higher capacity baselines and unwind the remaining 2 million barrels per day of cuts at the same time, the 2027 market could swing from deficit to oversupply quickly. That scenario underpins the EIA's forecast of Brent falling to $67 in the second half of 2027.
Before the Iran war, the outlook was the opposite. In August 2025, the EIA projected Brent at $51 per barrel for all of 2026 as OPEC+ accelerated its cut unwinding. Brent started 2026 at $61. The war erased that oversupply thesis entirely.
The Fed at 2 P.M.: How a Rate Hike Hits Oil Demand and the Dollar
The Federal Reserve decision is the most important macro event for oil this week, and it cuts in two directions.
Fed funds futures price a 92.9% probability of a 25-basis-point hike to 3.75%–4.00%, the first increase since July 2023. The hike is a direct response to oil. U.S. CPI rose 3.4% year over year in August, per the Bureau of Labor Statistics, and gasoline prices jumped 3.9% in that month alone. July PCE inflation ran at 3.7%, per the Bureau of Economic Analysis. Energy costs have spread into core inflation, which rose 0.3% in August against a 0.2% forecast.
The first channel is demand. Higher interest rates slow economic activity, reducing fuel consumption from trucking, manufacturing, construction and consumer travel. Futures price a 39.1% probability of a second hike in October and 26.4% in December. A dot plot signaling additional hikes would tighten financial conditions further and reinforce concerns about demand destruction. U.S. mortgage rates already surged above 7% on Tuesday.
The second channel is the dollar. Oil is priced in dollars, so a stronger dollar makes crude more expensive for buyers holding other currencies. The U.S. Dollar Index climbed to 99.57 on Tuesday, its highest level since September 3. A hawkish Fed outcome that pushes the dollar through 100 would weigh on oil demand from importers in Europe and Asia.
The bond market reflects oil's role in the inflation story. The 10-year Treasury yield surged to 5.045% on Tuesday, its highest since 2007, as rising crude prices pushed inflation expectations higher. On Wednesday, as oil fell more than 2%, the 10-year eased to 4.967%. Oil and yields are moving together, which means every $5 move in crude directly shifts the Fed's calculus.
There is a feedback loop at work. Higher oil prices threaten growth but also make it harder for central banks to declare victory over inflation. That forces rate hikes that eventually slow demand and lower oil prices, but only after a lag of several quarters. The European Central Bank already raised its deposit rate to 2.50% effective today, and the Bank of Japan is expected to hike on Friday. Coordinated global tightening in response to an energy shock is historically the mechanism that ends oil price spikes, but the process takes time.
For this forecast, the Fed matters most at the margin. A restrained dot plot keeps demand expectations intact and supports Brent above $105. A hawkish dot plot strengthens the dollar and pulls Brent toward $100 on demand concerns, even without any change in physical supply.
Demand Destruction: Record Diesel, Trucking Warnings and Inflation Pass-Through
High oil prices are already damaging demand in specific sectors, and those signals help define the ceiling on crude.
Diesel is the clearest pressure point. The EIA forecasts U.S. distillate inventories will drop below 100 million barrels in September and stay below the five-year low through much of 2027. Tightness in the global distillate market has raised domestic prices and encouraged U.S. exporters to ship more distillates overseas. Atlantic Basin refining margins hit records in August on sharply higher diesel crack spreads. In the first quarter, the U.S. average retail diesel price reached $5.40 per gallon on March 30, the highest in real terms in more than two years.
The corporate impact is now visible in earnings guidance. J.B. Hunt Transport Services shares tumbled 12.64% on Wednesday after the trucking company warned that third-quarter earnings would fall 5% to 10% from the second quarter. The company cited record-high diesel prices and some of the most abnormal fuel price swings in its history, creating at least a $10 million fuel headwind in the quarter. Old Dominion Freight Line fell 4.34% premarket on concerns about rising operating costs. When a logistics bellwether issues an intra-quarter profit warning tied to fuel, the pass-through from oil to the broader economy is underway.
Consumer spending has not cracked yet. August U.S. retail sales rose 1.2%, beating expectations, and the control group rose 1.4%. That resilience gives oil some support, since consumers are absorbing higher gasoline costs without cutting overall spending. The risk is that resilience fades as interest rates rise and mortgage rates climb above 7%.
Outside the U.S., demand destruction is more advanced. Eurozone energy inflation spiked to 14.3% in August, pushing headline inflation to 3.3%. The European Central Bank's latest projections see growth risks tilted to the downside. China has emerged as a case study in potential demand destruction, even as it raised crude orders in August to rebuild dwindling stockpiles.
Airlines, chemical producers and freight companies are the next sectors to watch. Each has limited ability to pass fuel costs through to customers quickly, and each will report third-quarter results in October.
For the forecast, demand destruction explains the $110 ceiling on Brent. Above that level, the combination of trucking profit warnings, European recession risk and Fed tightening accelerates the demand response. Below $100, those pressures ease and the physical deficit reasserts itself. The zone between $100 and $110 represents the balance between a severe supply shortage and the demand losses it is creating.
Energy Equities: Diamondback -8%, APA -5.2% as Producers Give Back Tuesday's Gains
Energy stocks are the equity market's real-time read on oil's direction, and Wednesday's sharp losses show how quickly investors lock in gains when crude reverses.
On Tuesday, energy was the best-performing sector in the S&P 500, rising 1.9% while the broader index fell 0.45% to 7,585.73. Materials was the only other sector to finish higher, gaining 0.32%. Consumer discretionary fell 1.98% and utilities dropped 1.15%, as rising oil and bond yields hit consumer spending and rate-sensitive stocks. APA Corp. hit a new 52-week high during Tuesday's session.
Wednesday reversed that leadership. Diamondback Energy (FANG) dropped 8% amid concerns over inflation, rising Treasury yields and geopolitical risk in crude markets, after falling 4.74% in premarket trading. APA Corp. (APA) fell 5.2% one day after its 52-week high. Chevron (CVX) slipped more than 1% premarket as oil prices declined. The broader market moved the other way, with the S&P 500 rising 0.5% and the Nasdaq gaining 0.9% by late morning, led by semiconductors.
The magnitude of the energy selloff relative to crude's decline is revealing. WTI fell 2.5% from Tuesday's settlement, while Diamondback, a pure-play Permian Basin producer, fell more than three times as much. Energy equities had priced in more than the current oil price, likely reflecting expectations that Brent would push through $110. When crude reversed instead, positioning unwound quickly.
The producer landscape is shifting in favor of companies with international exposure outside the Gulf. Chevron is expanding its presence in Venezuela, where the company expects to more than double gross production from 280,000 barrels per day to 600,000 barrels per day by 2031 across three joint ventures. That growth fits the IEA's forecast of non-OPEC+ supply in the Americas adding 1.4 million barrels per day in 2026.
Permian producers face a different calculation. At WTI above $100, U.S. shale drilling is highly profitable, but capital discipline and investor pressure for returns have limited production growth. The EIA had projected U.S. production near 13.3 million barrels per day for 2026 before the war. Higher prices encourage more drilling, but new wells take months to reach full production.
The Energy Select Sector SPDR Fund (XLE) and the United States Oil Fund (USO) offer the most liquid ways to trade the sector and crude directly. For the forecast, energy equity behavior serves as a leading indicator: sustained outperformance by producers signals that investors expect Brent above $110, while continued selling signals expectations of a return toward $100.
The Saudi Question: Days or Weeks for the East-West Pipeline
The single most important variable for oil over the next two weeks is how long Saudi Arabia's East-West Pipeline stays offline, and official and independent views diverge sharply.
U.S. Energy Secretary Chris Wright has said the pipeline outage should last only a matter of days, describing it as temporary and indicating he expects operations to resume soon. That view contributed to Wednesday's price decline. If Wright is correct, Saudi Arabia restores up to 7 million barrels per day of Red Sea export capacity quickly, and the market's supply fears ease.
Independent analysts warn that repairs could take several weeks. Pipeline infrastructure damaged by drone and missile strikes typically requires assessment, replacement of damaged sections and pressure testing before full flows resume. An outage of three to four weeks would remove a significant share of Saudi exports through the end of September and into October, precisely when refiners are building inventory ahead of winter.
Saudi Arabia's workarounds are partial. The kingdom is offering additional crude cargoes to Asian refiners through ship-to-ship transfers off Oman's Sohar port. It is also moving to increase exports through the Strait of Hormuz with U.S. military assistance. Those measures helped ease Wednesday's concerns, but ship-to-ship transfers have limited capacity compared with a pipeline, and Hormuz transits remain exposed to Iranian attacks.
European supply chains are already feeling the impact. Saudi Aramco has delayed some deliveries to European customers, increasing competition for alternative supplies from the U.S., West Africa, Norway and Libya, where supply is also disrupted.
The Houthi threat to the Bab el-Mandeb raises the stakes. Even when the East-West Pipeline restarts, its barrels flow to Red Sea terminals and must exit through Bab el-Mandeb to reach Europe and much of Asia. Houthi forces are advancing toward that chokepoint and intensifying attacks on Saudi targets. A disruption at Bab el-Mandeb would render the pipeline's restart far less valuable.
The broader diplomatic picture offers one potential offset. Signs of progress toward a Russia-Ukraine energy truce, which would halt attacks on energy infrastructure, briefly weighed on prices this week. Conflicting statements from President Trump and Ukrainian President Volodymyr Zelenskyy raised uncertainty over whether a halt will take hold. A confirmed energy truce would restore some Russian refinery and export capacity and ease product market tightness, particularly for diesel.
For the forecast, the pipeline timeline defines the scenarios. A restart within a week supports the $100–$110 Brent range. An outage lasting beyond the end of September pushes Brent through $110 toward the $118 first-quarter high.
The Technical Map: Brent $109.21 Resistance, $105 Pivot, $100 Floor
Oil's chart structure shows a strong uptrend testing resistance at four-month highs, with clearly defined levels based on recent price action.
For Brent, immediate resistance sits at $109.21, Tuesday's four-month high. A daily close above that level would open the $110 psychological mark, 2.2% above the current price of $107.60. Beyond $110, the next major resistance is $118, where Brent closed the first quarter of 2026 after the largest inflation-adjusted quarterly increase in data going back to 1988. From $107.60, $118 represents a 9.7% gain.
The Brent pivot sits at $105, the level Brent reached on September 10 and the price referenced in the IEA's September report, $21 above the start of August and 45% above pre-war levels. Brent slid toward $106 on Wednesday, testing that pivot. A daily close below $105 would signal the two-day surge has fully reversed.
Below $105, the $100 level is the critical floor. Brent crossed $101 on September 9 and has held above $100 for most of September. A break below $100 would open a move toward $91, the August average price and the level the EIA expects Brent to hold near in coming months. From $107.60, $100 is a 7.1% decline, and $91 is a 15.4% decline.
For WTI, immediate resistance sits at $105.83, Tuesday's settlement, then $107.38, Tuesday's intraday high. Support sits at $103, which WTI tested on Wednesday, then $100, then $96.62, where WTI traded on September 13 before the weekend surge. The August 3 settlement at $84.67 marks the base of the current rally.
The WTI-Brent spread offers a secondary signal. At $4.40, the spread sits well below its March 31 peak of $25 per barrel, when SPR release plans and ample U.S. inventories limited WTI's gains relative to Brent. The spread averaged $11 in March. A narrower spread reflects falling U.S. inventories, particularly at Cushing, and strong export demand for U.S. crude. If Cushing continues to draw, WTI could outperform Brent even in a pullback.
The broader trend remains firmly bullish. Brent is up 76.4% from its $61 starting level in January 2026, up 23.1% from its early-August level, and up 20.19% over the past month. Monthly forecast ranges for WTI in September span $69.92 to $102.18 in some projections, a range that the market has already broken to the upside. Momentum favors buyers on dips toward $105 Brent and $100 WTI as long as the supply picture stays unchanged.
Scenarios and Price Targets: $118 Spike Versus $100 Floor Test
Three scenarios cover the realistic outcomes for crude oil through early October, driven by the East-West Pipeline timeline, the Houthi threat to Bab el-Mandeb and the Fed decision.
The bull case is an extended outage. The East-West Pipeline stays offline for three to four weeks as independent repair estimates prove correct. Houthi forces disrupt traffic near the Bab el-Mandeb, limiting the value of any Saudi restart. Libya declares force majeure on the Hamada-Zawiya pipeline. U.S. commercial inventories continue drawing and the SPR falls toward 280 million barrels. A restrained Fed dot plot keeps the dollar below 100 and demand expectations intact. Brent breaks $109.21 and $110 inside a week and targets $118, the first-quarter high, by early October, a 9.7% gain. WTI clears $107.38 and targets $112, an 8.5% gain. Probability: 30%.
The base case is a range. The pipeline restarts within one to two weeks, consistent with the Energy Secretary's guidance, but Houthi attacks and Gulf shipping risks keep a geopolitical premium in place. The Fed hikes with an ambiguous message. Global inventories keep drawing at the EIA's forecast 3.0 million barrels per day pace, preventing a deep decline. Brent trades between $103 and $110, and WTI between $99 and $107, through the end of September. Probability: 45%.
The bear case is de-escalation and tightening. The East-West Pipeline resumes full operations within days, Saudi ship-to-ship transfers and Hormuz exports expand, and a Russia-Ukraine energy truce takes hold. The Fed's dot plot signals additional hikes, the dollar index breaks above 100, and demand destruction concerns intensify after trucking and airline warnings. Brent breaks $105 and tests the $100 floor, a 7.1% decline. WTI slides to $96.62, a 6.4% decline. A sustained break below $100 Brent opens $91. Probability: 25%.
The risk-reward favors a measured bullish view. Downside to $100 Brent is 7.1%. Upside to $110 is 2.2%, and to $118 is 9.7%. The structural deficit, with more than 10 million barrels per day shut in, global inventories down 400 million barrels and an SPR inside its operational minimum range, limits the probability that the bear case extends far below $100.
The single variable to watch this week is official Saudi guidance on the East-West Pipeline restart date. Confirmation of a restart within days supports the base case. Silence past the weekend triggers the bull case.
Verdict: Bullish Above $105 Brent — $110 First, $118 on an Extended Pipeline Outage
Oil is pulling back from four-month highs, but the forces behind the rally remain firmly in place. WTI fell 2.5% to $103.20 and Brent slipped toward $106 after trading at $107.60 on Wednesday, as an industry survey showed a 7.14 million-barrel U.S. crude build, Saudi Arabia offered cargoes through Oman and the Energy Secretary said the East-West Pipeline outage should last only days. The official EIA data showed a 640,000-barrel draw instead, taking commercial crude to 423.4 million barrels, while Cushing stocks fell again.
The supply picture is the tightest in modern oil market history. More than 10 million barrels per day of Gulf production remains shut in. Global supply is set to fall 5.7 million barrels per day in 2026. Global inventories have dropped 400 million barrels this year, with draws of 3.0 million barrels per day forecast for the third quarter. The U.S. Strategic Petroleum Reserve holds 285 million barrels, inside its 250 million to 300 million-barrel operational minimum range. Distillate inventories are forecast to fall below 100 million barrels this month. Saudi output has dropped to its lowest since 1990, Libya has halted fields and threatened force majeure, and Houthi forces are advancing toward the Bab el-Mandeb.
The ceiling is equally clear. Brent at $107.60 trades $17.60 above the EIA's second-half average forecast of $90. Demand destruction is showing up in trucking profit warnings, 14.3% eurozone energy inflation and a Fed about to hike rates for the first time since 2023. The dollar index at 99.57 adds pressure on importers. OPEC+ spare capacity cannot reach the market, but 2 million barrels per day of cuts and an 8 million-barrel-per-day production rebound expected in 2027 point to a steep decline once flows normalize.
The verdict is bullish above $105 Brent and $100 WTI, with a base-case range of $103 to $110 Brent through the end of September. A daily close above $109.21 opens $110 and then $118, a 9.7% gain, if the East-West Pipeline outage extends beyond the end of the month. A daily close below $105 shifts the outlook to neutral, and a break below $100 Brent, a 7.1% decline, would signal that de-escalation and Fed tightening have overpowered the physical deficit, opening a move toward the $91 August average.