WTI Crashes 6.5% to $83.10 and Brent Gaps Below $90 From Friday's $96.80 as the US Halts Its 13-Day Campaigns
Crude gave back roughly $10 in a single session after Washington paused | That's TradingNEWS
Key Points
- WTI gapped to $83.10 and traded near $83.50, down 6% to 6.5% from Friday's $89.31 settlement.
- Brent fell as much as 7.4% below $90 from $96.80, swinging an $87 to $92 band, roughly $10 off last week's peak.
- WTI broke the ascending trendline from $68.00 to $93.83; the 61.8% retracement at $89.73 is now the ceiling.
Crude opened Monday with the largest downside gap of the year. WTI September futures sliced through the ascending trendline that had guided the entire climb from $68.00, printed a low near $83.10, and spent the session attempting a recovery. Prices traded a $83.10 to $85.50 band and were quoted near $83.50 by late morning New York, down roughly 6% to 6.5% against Friday's $89.31 settlement.
Brent did the same thing harder. The global benchmark gapped lower on the Asian open and fell as much as 7.4%, breaking below $90 a barrel from Friday's settle near $96.80. It printed $89.43 by 7:24 a.m. Eastern, traded $89.85 in early London hours, and swung across an $87 to $92 band through the session as buyers stepped into the vacuum and then withdrew. That is roughly $10 below last week's peak above $100.
The scale of the reversal is what makes this a genuine event rather than a routine correction. Brent touched above $100 on Thursday July 23 for the first time since late May, capping a run that had taken the benchmark up nearly 40% inside a single month. Two sessions later it was trading with an $87 handle. Even after Monday's collapse, Brent remains up more than 22% over thirty days and more than 30% against the same period last year.
The rest of the complex moved in sympathy. European natural gas fell alongside crude after pushing toward €60 per megawatt hour last week. The dollar weakened against every G10 counterpart. The two-year Treasury yield fell almost four basis points to 4.29% and the ten-year dropped more than four to 4.63%, both retreating from cycle highs set Thursday and Friday — the highest levels across the curve since late 2024.
Equity markets took the relief and then gave it back. The S&P 500 opened up 0.85% on futures and round-tripped to close the morning flat at 7,411. That pattern repeated across gold, Ethereum and the euro. Every asset that gapped higher on Monday's catalyst faded before New York lunch, which tells you the market does not believe this de-escalation is durable.
Neither does anyone reading the weekend wire. This is a hold-fire without a signed document, in a conflict that has already produced three of these.
A Thirteen-Day Campaign Stopped Without Anyone Announcing It
The mechanics of the pause matter more than the headline, because they determine how quickly it can unwind.
The United States halted a thirteen-day air campaign against Iran starting late Friday. There was no official announcement. Washington's framing has been that Tehran's willingness to avoid further escalation was the reason, and the US ambassador to the UN said Sunday that the president was giving the talks some space before deciding whether to resume strikes. No American air strikes have been reported since Thursday overnight. Iranian forces have not attacked US bases in the region since Friday.
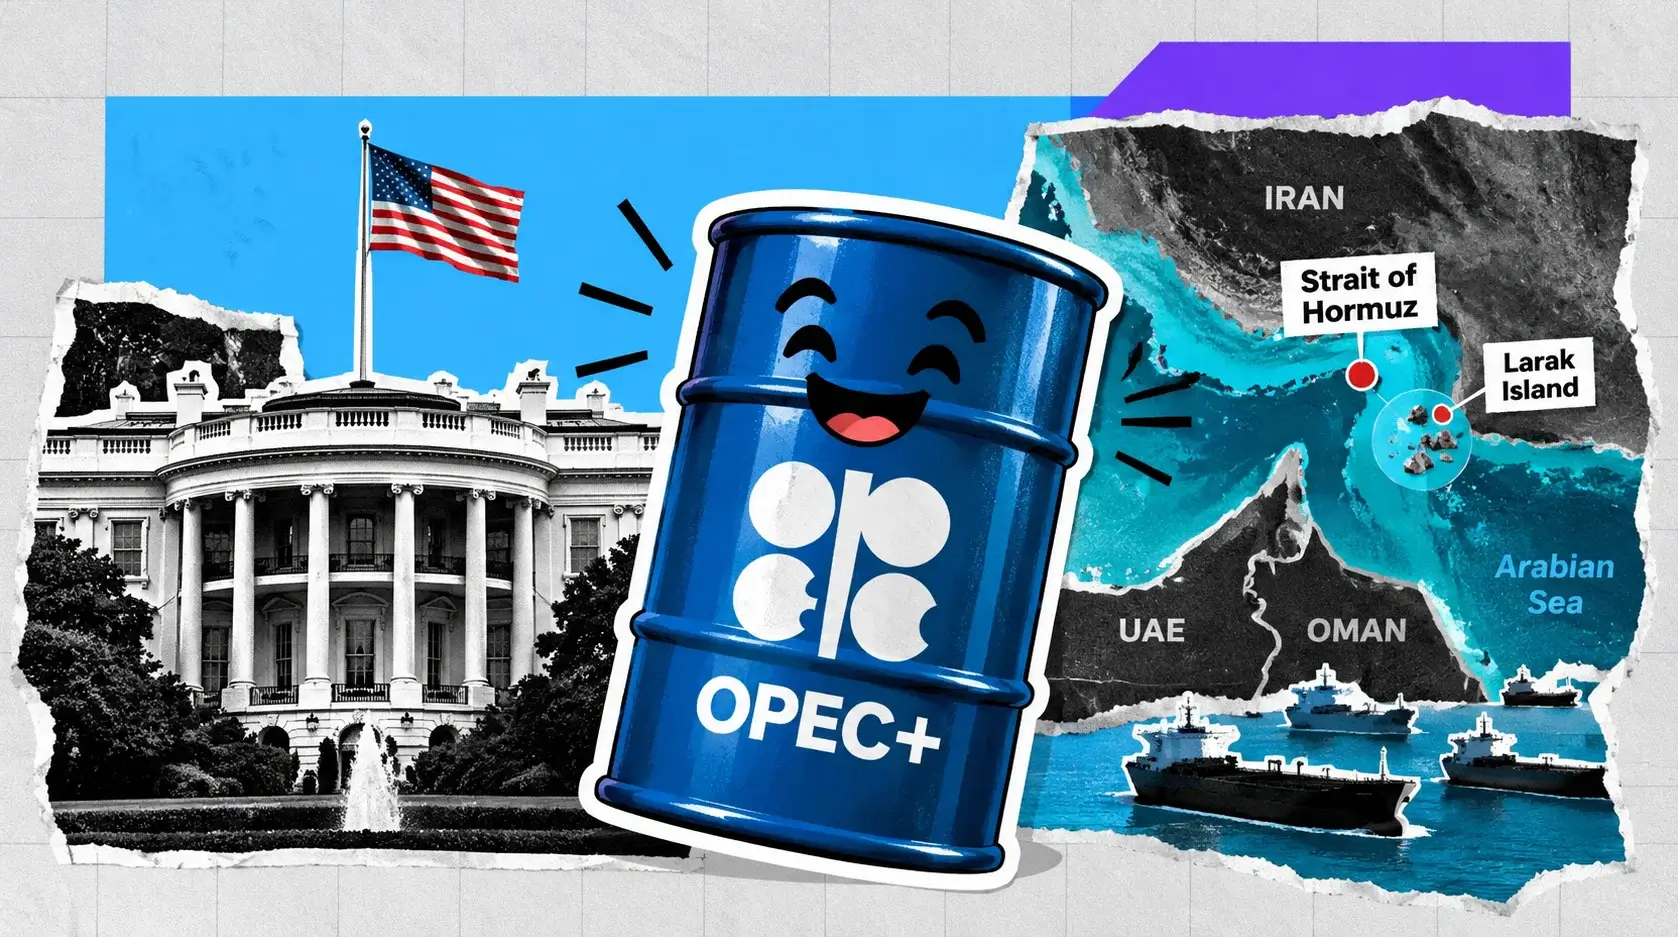
Tehran reciprocated conditionally. A senior Iranian official indicated the country will refrain from attacks as long as the United States also refrains from striking. Iran separately opened a channel with Oman focused specifically on the Strait of Hormuz — the waterway through which roughly a fifth of the world's oil and gas passed before the war, and which both sides have been contesting for control of since February.
That conditional structure is exactly why crude could not hold the lows. Neither party has committed to anything beyond not shooting while the other does not shoot. There is no ceasefire agreement, no monitoring mechanism, and no timeline.
The weekend also delivered a reminder that the conflict has proxies operating on their own logic. Iran-backed Houthi forces claimed responsibility for attacks on Saudi Aramco-linked facilities at the Red Sea ports of Jizan and Yanbu. Those are the alternative export terminals Riyadh has been leaning on precisely because Hormuz is compromised, and last week the same group struck two Saudi tankers in the Red Sea — the event that drove Brent above $100 on Thursday.
So the sequence is: strikes paused between the principals, attacks continuing against the infrastructure that constitutes the workaround. Asian buyers have begun discussing rerouting Saudi crude shipments through the Suez Canal and around Africa, which adds weeks of voyage time and tightens available tonnage regardless of what happens at the wellhead.
One further pressure point sits outside the Gulf entirely. The Caspian Pipeline Consortium suspended crude loadings at its Black Sea terminal after tanker attacks, disrupting roughly 80% of Kazakhstan's oil exports. That barrel is not returning because Washington stopped bombing Iran.
The 2026 Arc Explains Why Nobody Trusts This Level
Understanding the current price requires understanding the year, because 2026 has produced four separate hundred-dollar round trips in crude.
The year opened in deeply bearish territory with Brent near $62 a barrel, on a consensus built around OPEC+ restoring production and resilient non-OPEC growth from the United States, Brazil, Canada and Guyana. Then on February 28 the United States and Israel attacked Iran. The Strait of Hormuz was effectively closed from the end of February.
Prices surged. Crude hit a four-year high near $120 by early April, with Brent above $114 in early May. It retreated sharply on ceasefire hopes, spiked again at the start of June as peace talks stalled, and by June 2 Brent was trading $95.06 against WTI at $92.32.
Then came the first genuine de-escalation. On June 18 the United States and Iran signed a memorandum of understanding to end the conflict and open the strait. Shipping traffic through Hormuz increased. By early July Brent had collapsed to around $72 — back to levels traded immediately before the February 28 attack, and down from peaks above $120.
That resolution did not hold. Mid-July brought re-escalation, a thirteen-day American air campaign, Houthi strikes on Saudi tankers and export terminals, and the Caspian pipeline suspension. Brent ran from $72 to above $100 in roughly three weeks. Monday reversed a third of that in a single session.
The pattern is now well established: peace headline, violent unwind of the risk premium, escalation, violent repricing back up. Each cycle has been faster than the last. Monthly technical indicators on both benchmarks flipped from Strong Sell in early 2026 to Strong Buy by June, which describes a market that has stopped trading fundamentals and started trading headlines.
What sits underneath all of it is a structurally oversupplied market waiting for the premium to fade permanently. That is the tension defining every forecast below: a bearish physical balance repeatedly overwhelmed by a geopolitical shock that will not resolve.
The Disruption Was the Largest in the History of the Oil Market
The scale of what happened is worth stating precisely, because it explains why the market cannot simply revert to a pre-conflict price.
At the peak of the disruption, crude and product flows through the Strait of Hormuz plunged from roughly 20 million barrels per day before the war to a trickle. Bypass capacity around the waterway is limited, onshore storage filled, and Gulf countries cut total oil production by at least 10 million barrels per day as a result. Global oil supply was projected to fall by 8 million barrels per day in March alone, with Middle East curtailments partly offset by higher output from non-OPEC producers, Kazakhstan and Russia.
That is the largest supply disruption in the recorded history of the global oil market — larger than 1973, larger than 1979, larger than the 2019 Abqaiq strike. Top producers Saudi Arabia, Iraq, Kuwait and the UAE all cut output because they physically could not move barrels.
Restoration has been partial and reversible. Following the June 18 memorandum, shipping traffic increased and forecasters raised expectations for global production, projecting a return to near pre-conflict levels by year-end with the majority of shut-in crude back online during the first quarter of 2027. Then July re-escalated.
The insurance and physical-protection question is the one that determines whether flows resume, and it is not solved by a strike pause. Tanker owners price war risk on a rolling basis. A hold-fire announced by nobody, with proxies still attacking Red Sea terminals, does not restore normal freight rates or normal charter availability. Asian refiners discussing Suez and Cape routings are making decisions on a months-long planning horizon, not a weekend headline.
That is the asymmetry the tape is expressing. Prices can fall 7% on a pause because the paper market reprices instantly. The physical market — vessels, insurance, storage positioning, refinery runs — moves on a far slower clock and has not yet unwound its war configuration.
Long-term damage to production capacity in the Gulf region is believed to be minimal. The barrels exist. Moving them is the problem.
OPEC+ Keeps Adding Paper Barrels While Losing Members
The cartel's position has weakened materially, and Monday's collapse arrives a week before a ministerial meeting that could make it worse.
OPEC+ agreed at its early-July meeting to increase quotas by 188,000 barrels per day from August, on top of similar increases for June and July. The seven core members have lifted output targets by almost 800,000 barrels per day across April through July. The rises have been largely symbolic — several key members have been physically unable to raise production because Hormuz was closed, so the quota increases signalled readiness rather than delivered supply.
The organisational problems are more consequential than the quota arithmetic. The United Arab Emirates has left the group. Iraq has signalled it wants higher quotas, with an energy adviser attributing the demand to mounting economic pressures, and Baghdad's response ahead of the August 2 ministerial meeting is the item to watch — including whether it escalates its own exit threat. OPEC+ nominally groups 21 to 22 members including Iran, but in recent years only seven or eight nations have been involved in monthly production management. Losing one of them and having another threaten departure is a structural erosion, not a negotiating tactic.
Production levels among the majors, per secondary sources, put Saudi Arabia near 9.8 million barrels per day and Russia around 9 million. Russian output has been separately disrupted by drone attacks throughout the year.
The decision to keep raising quotas reflects a desire to maintain member unity rather than sacrifice volumes for price support, which suggests intervention capacity has weakened considerably as non-OPEC barrels flood the market. That is a meaningful change from the group that defended prices through 2023 and 2024.
The central question for the second half is how quickly paper quota increases translate into actual barrels reaching the market, and whether demand can absorb them. If Hormuz normalises while OPEC+ continues restoring output into a market already carrying record American production, the surplus that was building before February returns immediately and with additional volume behind it.
That is precisely what several forecasters expect once the conflict premium finally clears.
US Inventories Are the Bullish Detail Nobody Is Trading
The American supply picture cuts both ways and is currently being ignored by a market focused entirely on geopolitics.
On the bearish side, US crude production has been running at a record near 13.6 to 13.9 million barrels per day, establishing a new all-time high that adds structural supply-side pressure once the geopolitical premium fades. That output growth was the reason the year opened with Brent at $62, and it has not stopped.
On the bullish side, the inventory position is genuinely tight. Total US petroleum inventories including the Strategic Petroleum Reserve recently dipped to their lowest level since 1984. The SPR itself dropped 5.1 million barrels to 311.4 million, the lowest since 1983. Commercial crude stocks have not recovered to the five-year seasonal average despite a build reported in the most recent weekly data, and both gasoline and distillate stocks remain below average levels.
That combination — record production alongside four-decade lows in total inventory — describes a system running flat out with no buffer. It means the fundamentals are not as weak as a market pricing a peace headline might assume, and it means any renewed disruption hits an inventory base with nothing behind it.
The refined-product side matters for the macro read. Retail gasoline averaged $4.48 per gallon in May at the height of the disruption. Forecasts now put the second-half average near $3.60 per gallon on the assumption that production and trade flows normalise. That $0.88 swing is the transmission channel from crude to American inflation and, roughly a hundred days from midterm elections, to politics.
This week delivers two direct reads. The American Petroleum Institute publishes weekly inventory estimates Tuesday evening, and official government data follows Wednesday morning — a few hours before the Federal Reserve decision. A meaningful draw against a market that has just given back 7% would be the cleanest bullish catalyst available.
Traders have been positioned for continuing declines in commercial stocks. A build instead, on top of the geopolitical unwind, is how $83.10 becomes $80.
Read More
-
Yen Stalls at 160 Despite a 3% JGB and Tokyo Core CPI at 2.0% — Intervention Sits at 164, Friday's Payrolls Decide
02.09.2026 · TradingNEWS ArchiveEnergy
-
QQQI ETF Pays 13.96% While The Nasdaq-100 Rolls Over — Why Section 1256 Is Worth More Than The Yield
14.09.2026 · TradingNEWS ArchiveStocks
-
XRP ETFs Took $19M In A Week After A $110M Record — Why The Filings Tell A Different Story Than The Flows
14.09.2026 · TradingNEWS ArchiveCrypto
-
US Gas Holds $2.88 While Europe Pays $28 — Why Only A Tenth Of The War Premium Reaches Henry Hub
14.09.2026 · TradingNEWS ArchiveCommodities
-
Yen Holds Near February Highs As Tokyo Prepares Its Highest Rate Since 1995 — Why The Yield Gap Will Not Move
14.09.2026 · TradingNEWS ArchiveForex
The Level Map for WTI: $89.73 Is the Ceiling, $83.10 Is the Floor
The technical structure resolved cleanly Monday, which makes the levels unusually tradable.
WTI broke down from the ascending trendline that guided its entire climb from the $68.00 area up to the $93.83 swing high. Price sliced through that rising support with a sharp selloff before finding footing around $83.10, and spent the session attempting a recovery back toward the broken line.
The Fibonacci retracement drawn from the $83.10 low to the $93.83 high provides the roadmap. The 38.2% level sits at $87.20, the 50% at $88.46, and the 61.8% at $89.73. That last figure is the one that matters, because it lines up closely with where the broken trendline now resides and with the area where sellers previously stepped back in. Confluence of a broken trendline, a 61.8% retracement and prior supply makes $89.73 a difficult ceiling to crack.
Below, the support ladder runs $82.67, $80.53, $78.42, $76.02, $73.91 and $71.84. A failure to reclaim the trendline and the Fibonacci cluster opens a larger reversal that drags crude back toward $83.10 and beneath.
Momentum is mildly constructive. Stochastic dipped into oversold territory and is curling higher. The relative strength index is working up from a low reading with room to climb before overbought conditions become a constraint. The 100-day simple moving average remains above the 200-day, confirming that the longer path of least resistance has not yet flipped.
Weekly scenario framing across desks puts the WTI bullish case at $92.00 to $94.90 and the bearish case at $78.00 to $76.00 — a $19 spread that honestly reflects how binary the geopolitical input is. Separate work identifies $85.09 as immediate support with $97.41 as resistance, and a bullish extension target of $104.54 if the conflict re-escalates.
The clean framework into Wednesday: constructive above $87.20, confirmed above $89.73, and broken below $83.10. Everything between those levels is noise generated by headlines nobody can forecast.
Brent's Structure: $87.37 Decides Whether the Recovery Survives
The global benchmark carries its own set of references and they are currently clustered tightly around spot.
Brent recovered from a July low near $70.08 during the re-escalation, taking price back through both the 50-day exponential moving average at $85.54 and the 100-day at $86.58. It has since been trading beneath a descending trendline resistance that has been in place since April, and near the 61.8% retracement level at $87.37. Those three technicals together dominate near-term price action.
Resistance above runs $91.82, then $98.03, then $105.64 — the last of which approximates the second-quarter peak zone. Support below sits at $87.37, then $84.12, $80.83 and $76.72. The relative strength index was reading 62 during the recovery, which left it stretched but not extreme before Monday's decline pulled it lower.
The honest read is that Brent has been recovering within a larger corrective structure, and a close above the descending trendline from April is needed to improve the medium-term technical outlook. A rejection from resistance pulls price toward the $87.37 to $84.12 band, which is precisely where Monday's session has landed it.
Weekly scenario work puts the Brent bullish case at $95.50 to $98.00 against a bearish case of $84.00 to $81.50. Both benchmarks were trading above their respective uptrend lines heading into the week, maintaining a constructive structure — WTI broke its line Monday, and Brent's equivalent test is what the $84.12 level represents.
The spread between the two benchmarks is itself informative. Brent near $90 against WTI near $83.50 puts the differential around $6.50, wider than the historical norm and consistent with a market where waterborne barrels carry a security premium American landlocked crude does not. A narrowing spread would signal genuine normalisation of Gulf logistics. A widening one would signal the opposite regardless of what the flat price does.
Monday delivered neither. Both fell together in roughly equal percentage terms, which is the signature of a pure risk-premium unwind rather than any change in physical arbitrage.
Cheaper Crude Is a Dovish Shock Two Days Before the Fed
The most consequential second-order effect of Monday's move lands on Wednesday afternoon.
The Federal Open Market Committee meets July 28-29 with the decision at 2 p.m. Eastern Wednesday. Consensus is a hold at 3.50% to 3.75%, extending a level maintained by unanimous vote in June. Hike probability fell to 30.5% Monday from 37.4% at Friday's close — seven percentage points of hawkish risk removed by the oil move alone, without a single data release.
The linkage is direct and has been the dominant macro story of the summer. US headline inflation is running near 4.1%, having hit 4.2% year over year in May, the highest since April 2023, while core sat at 2.9%. The gap between those two numbers is energy. Oil above $100 was the single input pushing the committee toward its first hike in three years. Oil at $87 removes it.
The complication is timing and stickiness. Desk commentary through July has argued that oil pass-through is incomplete, that the absence of demand destruction at elevated energy prices worsens the trajectory, and that price increases tied to AI infrastructure are contributing independently. September hike odds sit near 82% regardless of Monday's move.
Second-quarter GDP and June PCE inflation both land Thursday at 8:30 a.m. Eastern, less than twenty-four hours after the decision. That sequencing means a hawkish statement Wednesday can be undercut by soft data Thursday, and crude will trade the dollar reaction as much as the barrel count.
The dollar index has been holding above 101, easing toward 101.19 Monday with the greenback weaker against every G10 counterpart. A softer dollar is mechanically supportive for crude priced in it, which is the one factor arguing against a deeper break of $83.10 this week.
The feedback loop runs both ways and is worth stating explicitly. Falling oil reduces the case for tightening, which weakens the dollar, which supports oil. Rising oil forces tightening, which strengthens the dollar, which caps oil. That self-correcting mechanism is part of why crude has been oscillating in a wide band rather than trending.
Every Major Forecast Has Been Cut, and They Still Disagree by Thirty Dollars
The sell-side reset this summer has been aggressive and uniformly directional, which makes the remaining dispersion more informative than the individual numbers.
One US bank forecasts Brent sliding to $60 to $65 a barrel by end-2026 as the Hormuz shock fades. A Swiss bank cut its 2026 average Brent forecast to $83.74 and its 2027 forecast to $75, flagging downside risk to $70 if UAE supply ramps faster than expected. Two other major houses have warned of a returning global supply glut. Another projects Brent averaging $86 in the third quarter, $80 in the fourth and $78 at year-end, arguing the market rebalanced via larger-than-expected demand losses and smaller-than-expected OECD commercial inventory draws, with China providing a case study in genuine demand destruction.
Official forecasting sits in the middle. The 2026 annual average is projected near $85 to $91 per barrel under conflict scenarios, with Brent peaking around $106 in the second quarter and declining toward $70 by year-end. Global oil inventories are now expected to fall by 2.2 million barrels per day in the third quarter, against a prior forecast of more than 7 million — a dramatic revision that reflects restored production rather than weaker demand. The next official update lands August 11.
The spread from $60 to $91 on a full-year average is roughly 50%. That is not analytical sloppiness; it is an honest expression of a market where a single political decision can move the benchmark $15 in a week.
What unifies the bearish camp is the physical balance. A structural surplus was building before February, driven by OPEC+ restoration and non-OPEC growth from the US, Brazil, Canada and Guyana. Record American production near 13.9 million barrels per day has not paused. Estimates of the underlying surplus have run near 2 million barrels per day. Every one of those barrels is still there, sitting behind a price that is currently 40% above where the year started.
The bull case does not dispute the balance. It disputes the timeline, and it points at the four-decade low in total US petroleum inventories as evidence there is no cushion if the pause fails.
Energy Equities Split Between the Barrel and the Build-Out
The read-through into energy stocks Monday produced a divergence worth noting, because it separates companies levered to the oil price from companies levered to spending.
Producers followed crude down. Chevron and ExxonMobil were each seen off 2.5% in pre-market trading, with ConocoPhillips down 3.2% and the European majors lower alongside them. Venture Global fell 7.79% to $13.19. Those are the direct price-takers, and a 7% move in Brent compresses their realised revenue mechanically.
Baker Hughes went the other way, rising 6.79% to $61.13 on 5.16 million shares against an 8.44 million average. The company reported second-quarter results Sunday evening and hosted its call at 9:30 a.m. Eastern Monday, beating expectations and raising its order outlook. Full-year 2026 revenue guidance runs $26.65 billion to $28.05 billion with adjusted EBITDA of $4.60 billion to $5.10 billion, and the Horizon 2 industrial and energy technology orders target was lifted above $45 billion — with management pointing at power generation and LNG demand rather than upstream drilling activity.
That reclassification is the more durable story. A company whose order book is driven by turbines for data centres and liquefaction equipment for LNG facilities is decoupled from the barrel in a way that a producer is not. The company closed its acquisition of Chart Industries on July 16, adding cryogenic and gas-handling technology, and booked three awards in the quarter for a Louisiana LNG facility covering liquefaction equipment, a re-liquefaction unit and a four-year turbine upgrade programme supporting over 6 million tonnes per annum of added capacity.
The natural gas complex offers a parallel. LNG exports are forecast at 17 billion cubic feet per day on average in 2026 amid record American output, and that demand is contracted rather than spot-priced.
ExxonMobil and Chevron both report Friday, closing the week's calendar. Their results will show how a 40% monthly swing in crude translates into realised earnings, and more usefully, what they say about capital discipline into a price they clearly do not trust.
What Cheaper Oil Does to Everyone Else's Inflation Problem
The transmission from Monday's move extends well beyond energy markets, and the eurozone is where it lands hardest.
Central bank modelling puts every sustained $10 increase in oil prices at roughly 0.5 percentage points of additional eurozone harmonised inflation. Oil has risen more than $40 since the conflict began in late February, implying approximately 2 full percentage points of imported inflation the region did not generate. That is the entire reason the European Central Bank raised rates on June 11 for the first time since 2023, lifting its deposit facility to 2.25%.
Reverse the arithmetic and Monday's collapse is worth roughly half a percentage point of eurozone inflation relief if it holds. Eurozone headline inflation printed 2.8% in June, down from 3.2% in May, with staff projections putting the 2026 average at 3.0% largely on energy. A survey of 74 economists found roughly 70% expect at least one further ECB hike this year if energy prices remain elevated — a conditional that Monday just weakened considerably. Eurozone July flash inflation lands Friday.
The asymmetry between regions is structural. The eurozone is a major net energy importer; the United States is a net producer. An oil spike hurts Europe through both terms of trade and inflation while supporting the dollar through higher yields and haven demand. Cheaper crude reverses both legs, which is why EUR/USD gapped higher Monday before fading back below 1.1400.
The political dimension is not decorative. Retail gasoline at $4.48 per gallon in May and a forecast $3.60 average for the second half sits roughly a hundred days ahead of American midterm elections in which control of both congressional chambers is contested. A sustained fall in crude is worth more to the administration than most of what appears on the economic calendar.
Which introduces the uncomfortable question underneath the whole trade. A strike pause announced by nobody, timed to a rally that had just taken Brent above $100 and gasoline toward $4.50, delivers an immediate and politically valuable outcome. Traders do not need to assign motive to recognise that the incentive to keep the pause in place is considerable — and that incentives are not commitments.
Forecast: $83.10 and $89.73 Bracket the Week, With Wednesday's Data the Deciding Input
The base case is continued consolidation between $83.10 and $89.73 on WTI, with Brent holding the $84.12 to $91.82 band, while the hold-fire persists without becoming an agreement. Assign roughly 45% weight, targeting a WTI weekly close between $84 and $88. The structure supports it: stochastic is oversold and curling higher, the 100-day average remains above the 200-day, and the inventory position is tight enough to floor a decline that has no fresh physical driver behind it.
The bearish path requires two things together. A crude inventory build in Wednesday's official data on top of the geopolitical unwind, and a hawkish Fed statement that lifts the dollar back through 101.50. That breaks $83.10, and given the support ladder runs $82.67 then $80.53 then $78.42, the move extends quickly. Assign 30%, targeting $80 on WTI and $84.12 on Brent — roughly 4% lower. Any signal that Hormuz transit is genuinely normalising, or that Iraq secures a higher quota at the August 2 ministerial, accelerates it toward the $76 to $78 zone that weekly scenario work identifies.
The bullish path is a failure of the pause. Renewed strikes, a further Houthi escalation against Saudi export terminals, or a formal breakdown in the Oman channel puts the entire $10 premium back within days — the market has demonstrated three times this year that it reprices geopolitical risk faster than it unwinds it. That reclaims $87.20, then $89.73, and opens $93.83 with $97.41 above it. Assign 25%, targeting $92 to $94 on WTI. The four-decade low in total US petroleum inventories means there is no buffer to absorb a second disruption.
The trigger checklist: API estimates Tuesday evening and official inventory data Wednesday morning, particularly whether commercial crude closes any of its gap to the five-year average. The Fed at 2 p.m. Wednesday and the dollar's reaction rather than crude's first print. GDP and PCE Thursday. ExxonMobil and Chevron Friday. The August 2 OPEC+ ministerial and Iraq's posture within it. And above everything, whether the strike pause survives a week in which Houthi forces have already attacked Saudi terminals twice.
Watch the Brent-WTI spread near $6.50. It narrows only when the physical market believes the Gulf is safe.