Crude Oil: Brent at $90.36 Caps a 22% July as Hormuz Runs at a Third of Capacity — Support $84.50, Resistance $93
Global supply climbed 4.1M barrels per day in June to 98.8M but remains 9.4M short of pre-war output | That's TradingNEWS
Key Points
- Brent closed July up 22% at $90.36 and WTI up 20% at $85.41, the best month since March.
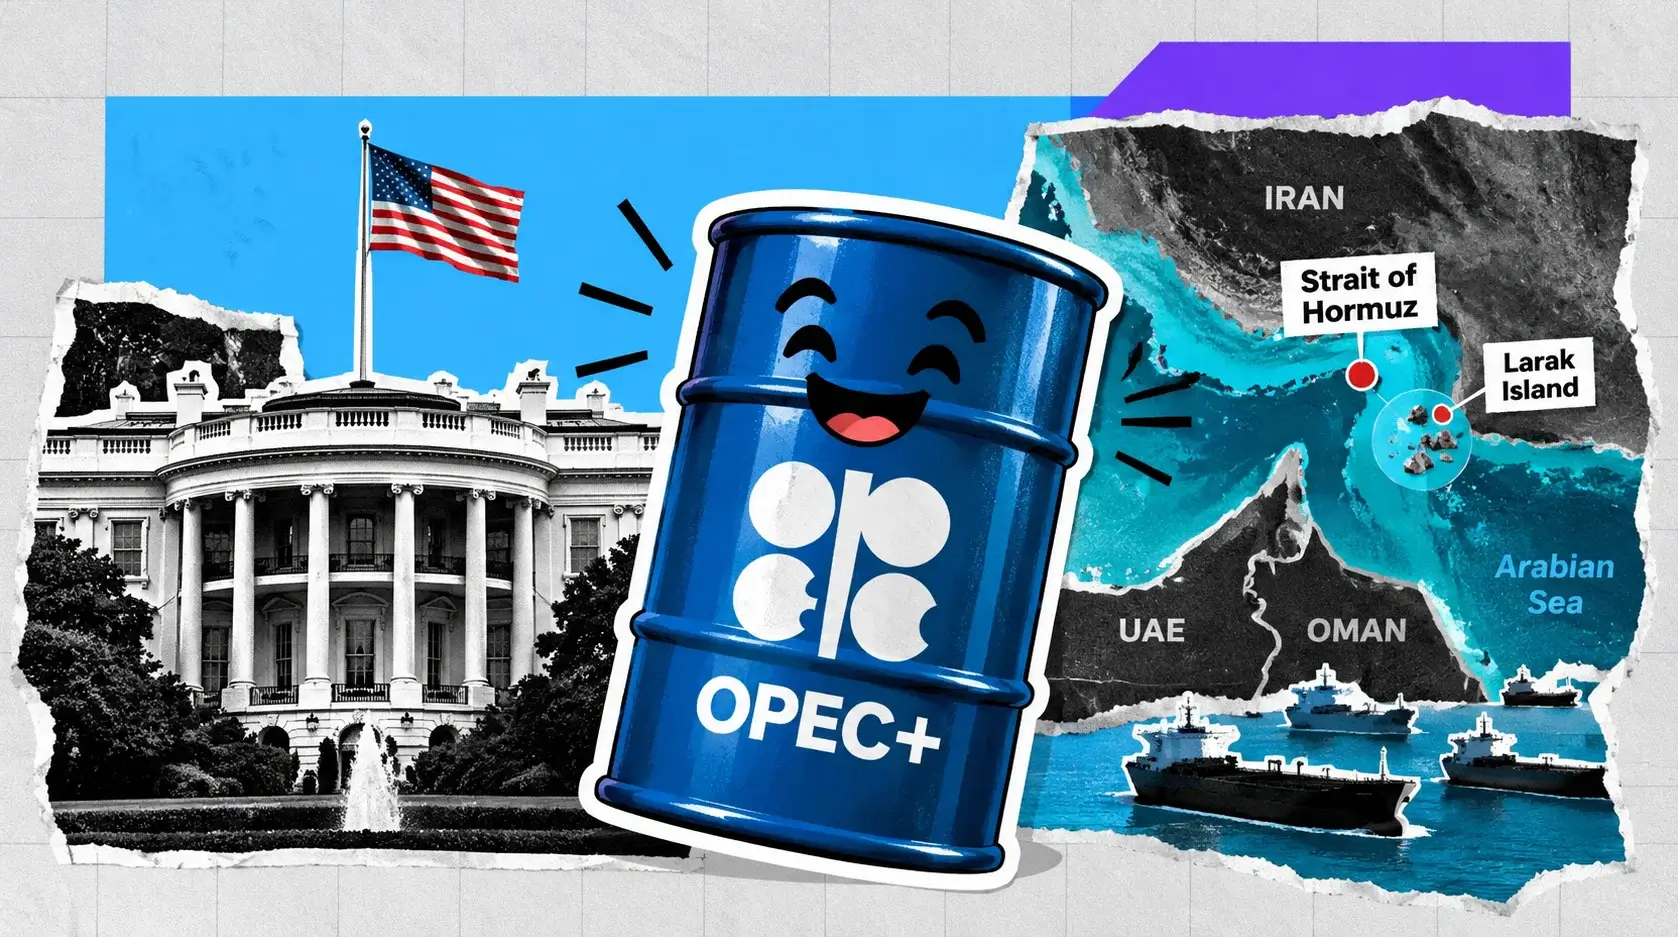
- Hormuz throughput sits at 30% to 35% of pre-war levels against 125 to 140 daily departures.
- Exxon and Chevron posted combined Q2 profits above $26 billion, up more than 300%.
Oil closed July's final session higher on the specific event the market has been pricing for five months. West Texas Intermediate futures rose 2.2% to $85.41 a barrel and Brent gained 1.5% to $90.36 after Iran's Islamic Revolutionary Guard Corps said it attacked two tankers transiting the Strait of Hormuz under U.S. military escort. Four additional tankers turned back after the strikes, according to Iranian state media. U.S. and British maritime security organizations monitoring regional traffic have not confirmed the attacks.
The intraday path shows how thin the market's conviction is. Brent traded $89.50 and WTI $83.63 at 09:52 GMT before the tanker headlines, having spent Thursday selling off on improving Hormuz throughput. Crude fell to $83.87 on July 30, down 0.70%, after Brent dropped nearly 1.8% below $89 on signs of better shipping activity. Wednesday had gone the other direction entirely, with Brent surging 7.9% and WTI 6.4% after the administration said the U.S. would hit Iran hard in retaliation for an attempted surprise attack on American forces. Brent briefly pushed above $93 that session.
The month closes with the steepest gain since March. Brent is on track for a 22% July advance and WTI for 20%, with the front-month contract up 22.30% over the past 30 days and 21.09% year over year. Oil is the best-performing major asset class of the month by a wide margin, against a Nasdaq that entered correction and gold that managed 2%.
The Brent-WTI spread sits near $5 after averaging $12 in March, when Hormuz-related shipping disruptions and elevated U.S. inventories capped the domestic benchmark relative to the international one. Narrowing spread with both benchmarks rising means the disruption premium is being priced globally rather than regionally.
The equity read-through was muted. The energy sector ETF fell 0.51% on the session even with crude firming, while the oil fund tracking WTI gained 1.81%. That divergence says the market is treating current prices as a war premium rather than a run rate, and refuses to capitalize the earnings at a normal multiple.
Two attacked tankers moved the front month 2.2%. That is the entire structure of this market compressed into one session — a supply chain running at a fraction of capacity, where any single incident reprices the curve because there is no spare throughput to absorb it.
A 22% Month Inside a Year That Has Traded $62 to $138
The July move needs the full-year path to make sense, because 2026 has produced one of the widest ranges in the history of the crude market.
Brent opened the year near $62 a barrel in deeply bearish territory, with the market focused on OPEC+ production restoration and resilient non-OPEC supply growth pointing toward structural oversupply. The U.S.-Israel military operation against Iran began in late February and inverted that setup within weeks. Crude peaked at $138 on April 7, and April averaged $117.
Prices traded at or above $100 for most of the second quarter. They eased through May and June on de-escalation, then collapsed under $70 in mid-June after a memorandum of understanding was signed on June 18 between the United States and Iran to end the conflict and reopen the Strait of Hormuz. Renewed U.S.-Iran strikes pushed prices higher again from mid-July, and by July 16 Brent traded near $84.50.
That is a $76 range on the international benchmark inside seven months, from $62 to $138 and back to $90. Annualized realized volatility on that path is closer to an equity growth name than a commodity.
The July advance itself came in two legs. The first was the collapse of the June ceasefire and resumption of hostilities in early July. The second was Wednesday's 7.9% Brent surge on the retaliation announcement, followed by Thursday's 1.8% give-back on improving throughput and Friday's 1.5% recovery on the tanker attacks.
The behavioral pattern across those sessions is what matters for August. Every de-escalation headline produces a 2% to 8% decline. Every escalation headline produces a 2% to 8% advance. The market has no anchor because the physical situation changes weekly, and positioning resets with each move rather than accumulating.
One analyst framing put Brent in an $80 to $100 range near term, reflecting ongoing instability in shipping flows, continued negotiations and recurring incidents. That band has contained every session since mid-July with the exception of Wednesday's spike above $93.
Gasoline is the transmission point into everything else. The U.S. national average is back above $4 a gallon after a 9.2% June drop in energy goods prices — the largest monthly decline since August 2022 — that reversed as soon as the ceasefire failed.
Hormuz Is Running at 30% to 35% of Pre-War Throughput
The single most useful number in this market is how many vessels actually transit the strait, and it has been improving before Friday's attacks.
Commonwealth Bank of Australia estimates traffic through the waterway has recovered to roughly 30% to 35% of pre-war levels. Kpler tracked 14 commodity vessels transiting in both directions on Wednesday, up from single-digit daily crossings the prior week. Before the conflict, daily departures typically ran between 125 and 140 vessels. Two of the recent transits were VLCCs each carrying roughly two million barrels of crude.
The threshold that matters is explicit. CBA estimates a rebound to around 50% to 60% of normal flows would be enough to reassert oversupply conditions in the global oil market. That puts the entire bull case on a narrow band: Hormuz has to stay below roughly half capacity for the current price structure to hold.
Friday's attacks push directly against that recovery. Two tankers hit and four turned back removes six vessels from a flow running at 14 per day, which is a 40%-plus single-day hit to throughput. More consequentially, attacking ships under U.S. military escort raises the insurance and risk calculus for every owner considering the route, regardless of how many escorts are available.
The LNG exposure is larger than most crude-focused analysis captures. The strait carries approximately 93% of Qatar's LNG exports and 96% of the UAE's, which together account for about 19% of world LNG trade. Qatar dispatched its first LNG cargo through the waterway this week, which is a genuine de-escalation signal — a laden LNG carrier is the highest-value, highest-risk asset any owner sends through a contested channel.
Saudi Arabia has moved to institutionalize protection, proposing a naval coalition to safeguard key trade routes and holding talks with representatives from 43 countries on forming a maritime coalition following the Houthi blockade in the Red Sea.
AIS-dark voyages make exact vessel counts difficult, which means published throughput figures understate actual flows to an unknown degree. Traders are pricing a number nobody can verify.
U.S. forces struck dozens of Iranian military targets this week in an effort to weaken Tehran's ability to threaten regional shipping and U.S. allies. That is the stated objective, and Friday's tanker attacks are the measure of how far it has succeeded.
The IEA Balance Still Shows 9.4 Million Barrels Missing
The physical supply picture underneath the headlines is worse than the price suggests.
Global supply climbed 4.1 million barrels per day in June to reach 98.8 million barrels per day. That recovery still leaves output 9.4 million barrels per day short of pre-war figures — roughly 9% of global production offline or rerouted. A market missing 9.4 million barrels daily with Brent at $90 is a market pricing a resolution it has not received.
The IEA's forward balance projects 2026 supply falling 3.7 million barrels per day to 102.6 million, with demand also declining by one million barrels daily. Demand is forecast to recover by more than eight million barrels per day from May through October. That outlook explicitly assumes rapid de-escalation, and the agency flagged that renewed conflict presents potential for higher prices.
OPEC+ has been the swing variable and it moved the wrong direction. Output fell by around 1.74 million barrels per day in April alone, with the cartel's May monthly report cutting its 2026 global demand growth forecast to 1.17 million barrels per day from 1.38 million, citing the conflict's impact on trade flows.
The demand-side offset is building quietly. Elevated crude inventories in China continue to weigh on import demand, easing fears of a near-term supply squeeze. China stockpiled aggressively when prices collapsed under $70 in mid-June and is now working through that inventory rather than buying at $90.
The EIA's assumption set is the most constructive of any official body. Following the June 18 memorandum and increased strait traffic, the agency raised expectations for global oil production for the remainder of the year, projecting most crude production returns to near pre-conflict averages by year-end and the majority of shut-in production back online in the first quarter of 2027.
That forecast was completed July 1, before the ceasefire collapsed and before this week's strikes. It represents the base case that Friday's tanker attacks directly contradict.
Shut-in production is the asymmetry nobody prices correctly. Wells and facilities offline for six months restart slowly and imperfectly, and the longer the disruption runs the higher the probability that some portion of that 9.4 million barrels never returns at previous rates.
The June 18 Agreement That Lasted Three Weeks
The most important event in the 2026 oil market was a deal that failed, and understanding why it failed determines how to price the next one.
On June 18 the United States and Iran signed a memorandum of understanding to end the conflict and open the Strait of Hormuz. Crude collapsed under $70 within days. The EIA rebuilt its entire production forecast around the agreement. Traffic through the strait increased. Gasoline prices fell and energy goods prices dropped 9.2% in June, the steepest monthly decline since August 2022, which is the single largest reason U.S. headline PCE inflation printed negative for the month.
It held for roughly three weeks. Fighting resumed in July, U.S. strikes on Iranian targets resumed, and by Wednesday the administration was announcing retaliation for an attempted surprise attack on American forces. The President had earlier described Iran's response to a peace proposal as totally unacceptable.
Diplomacy has since gone the other direction. Trump has called for adding tariffs on Iran to a bipartisan sanctions bill targeting both Tehran and Russia. Sanctions against both have widespread congressional support, though tariffs as a coercive instrument are more contested — the U.S. imported just $1.4 million of goods from Iran in 2025, which makes the measure symbolic rather than economic.
The trading lesson from June is precise. A signed agreement produced a $20-plus collapse in Brent inside a week, and the reversal took roughly the same amount of time once the agreement broke. Any headline suggesting renewed talks now carries an asymmetric downside risk to price that positioning cannot easily hedge.
The escalation path runs the other way with equal force. Traders are watching for the conflict to widen toward Egypt, which would put the Suez Canal alongside Hormuz and the Red Sea as a compromised route. That scenario is not in any published forecast.
The market's own read on the ceiling is that substantial supply waits to hit once the conflict resolves, which caps dramatic spikes even with the strait contested. Nine point four million barrels per day of offline production is a wall of supply sitting behind any peace headline, and every trader long crude knows it.
That structure — capped upside from latent supply, uncapped downside from a signature — is why Brent cannot sustain a move through $95 despite genuine physical shortage.
The EIA Says $74 in the Third Quarter and Brent Is at $90
The gap between official forecasts and spot pricing is the widest it has been all year, and the direction of that gap has flipped twice.
The EIA's July Short-Term Energy Outlook, released July 7 with the forecast completed July 1, projects Brent averaging $74 a barrel in the third quarter — a reduction of $27 from the prior month's outlook. The agency expects ongoing oil inventory accumulation over the next year to continue putting downward pressure on crude, with Brent falling to an average of $65 in 2027.
Brent trades $90.36. The third quarter is one-third complete with an average well above $85. Hitting a $74 quarterly average now requires August and September to average close to $66, which would demand a full Hormuz reopening and a durable ceasefire inside four weeks.
The revision history explains the whiplash. The April STEO raised the full-year 2026 Brent forecast sharply to $96 from $78.84 in March, and WTI to $87.41 from $73.61, attributing the increase to the conflict. Three months later the agency cut its third-quarter number by $27 on the June memorandum. The ceasefire broke ten days after the forecast was completed.
The next STEO lands August 11 and will almost certainly revise the third quarter higher again.
That sequence is not a criticism of the agency so much as a description of the problem. Any model that takes a signed agreement as an input produces a forecast that is only as durable as the agreement, and this conflict has now produced one that lasted three weeks.
The inventory argument underneath the bearish call is real regardless. Global stock accumulation, elevated Chinese crude inventories, and OPEC+ spare capacity all point toward structural surplus once transit normalizes. That was the setup in January when Brent traded $62, and none of the underlying supply-demand mechanics have changed — only the routing.
The bull case is not a demand story. It is a logistics story, and logistics stories resolve faster than production stories when the political constraint lifts.
Bank Forecasts Range From $60 to $120 on the Same Barrel
Sell-side dispersion on crude is now wider than on any other major asset, and the spread maps directly onto how each desk models Hormuz.
JPMorgan cut its end-2026 projection to $78 from $95. Its published revision earlier in the year had Brent averaging $96 for full-year 2026 and $75 in 2027, with WTI at $89 in 2026 and $70 in 2027, while a separate baseline carried roughly $60 on the view that protracted supply disruption resolves. The bank noted crude traded at or above $100 for most of the second quarter before falling under $70 in mid-June on the reopening.
Goldman Sachs raised its 2026 Brent average forecast to $85 as a base case, with upside above $120 if Strait of Hormuz flows remain severely restricted through the third quarter. That conditional is the most useful framing available, because it states the exact variable rather than hiding it inside a point estimate.
The EIA sits at $74 for the third quarter and $65 for 2027. A Reuters-surveyed analyst put Brent in an $80 to $100 near-term band.
The gap between Goldman's $120 restricted-flow scenario and JPMorgan's $60 resolution baseline is $60 a barrel — two-thirds of the current price. That is not analytical disagreement about supply-demand fundamentals. It is a binary bet on whether Hormuz reopens, expressed as a price range.
Positioning reflects that binary. Neither a large speculative long nor a large short survives well in a market where a single diplomatic headline moves the front month 20% inside a week. The result is thin participation, wide intraday ranges, and price discovery driven by headlines rather than flows.
The forecast that has aged best is the conditional one. Hormuz at 30% to 35% of pre-war throughput supports $85 to $95 Brent. At 50% to 60% the oversupply reasserts and Brent moves toward $70. Below 20% with escalation toward Egypt, $120 becomes the reference rather than the tail.
For traders the practical framework is to stop forecasting price and start forecasting vessel counts. Kpler's daily transit figure has been a better leading indicator of the front month than any published model this year.
Big Oil Printed a Windfall and the Market Refused to Pay
Friday morning delivered the clearest evidence of how the equity market is treating this price environment.
Exxon and Chevron reported combined second-quarter profits above $26 billion, up more than 300% year over year. Exxon earned $14.5 billion in net income, more than doubling the year-ago figure and its highest since 2022 during the onset of the Russia-Ukraine war — roughly $160 million per day across the quarter. Adjusted earnings came in at $14.7 billion, or $3.52 per share against reported EPS of $3.48. Cash flow from operating activities hit $23.6 billion with free cash flow of $17.2 billion and shareholder distributions of $9.4 billion including $4.3 billion of buybacks.
It counted as a miss. The Street wanted $3.60 to $3.63 per share on revenue near $97.7 billion, and scheduled maintenance costs ate into the result. Shares fell 2%.
Chevron delivered the cleaner print with net income of $12.0 billion against $2.5 billion a year earlier — nearly quadrupling — and adjusted EPS of $6.06 beating estimates. The stock added about 1% premarket.
Shell reported $9.8 billion, its second-highest quarterly profit ever, driven by upstream performance and record Brazil production.
The sector's response was to fall. The energy ETF declined 0.51% on a session when crude rose 2.2%. That disconnect is the market stating plainly that it treats these earnings as a war premium rather than a run rate, and refuses to apply a normal multiple to peak-cycle numbers generated by a conflict that could end with a signature.
Exxon closed Thursday at $154.87 against a 52-week range of $105.52 to $176.41, up 26.3% year to date, trading at 10.23 times trailing EV/EBITDA against an industry average of 6.71. Chevron carries a 3.63% dividend yield at 9.85 times.
The political dimension arrived within hours. Lawmakers moved to target the results in the affordability debate, with gasoline back above $4 a gallon nationally while the two largest domestic producers report the best quarter in four years.
Windfall earnings during a consumer energy shock is the configuration that historically produces legislative risk, and it is now on the table alongside the Iran sanctions package.
Read More
-
Yen Stalls at 160 Despite a 3% JGB and Tokyo Core CPI at 2.0% — Intervention Sits at 164, Friday's Payrolls Decide
02.09.2026 · TradingNEWS ArchiveEnergy
-
QQQI ETF Pays 13.96% While The Nasdaq-100 Rolls Over — Why Section 1256 Is Worth More Than The Yield
14.09.2026 · TradingNEWS ArchiveStocks
-
XRP ETFs Took $19M In A Week After A $110M Record — Why The Filings Tell A Different Story Than The Flows
14.09.2026 · TradingNEWS ArchiveCrypto
-
US Gas Holds $2.88 While Europe Pays $28 — Why Only A Tenth Of The War Premium Reaches Henry Hub
14.09.2026 · TradingNEWS ArchiveCommodities
-
Yen Holds Near February Highs As Tokyo Prepares Its Highest Rate Since 1995 — Why The Yield Gap Will Not Move
14.09.2026 · TradingNEWS ArchiveForex
The Routes Nobody Is Watching Are Also Compromised
Hormuz dominates coverage, but three other chokepoints are simultaneously degraded, and the compounding effect is what keeps the risk premium sticky.
The Red Sea carries an active Houthi blockade imposed last week, which is what prompted Saudi Arabia to convene talks with representatives from 43 countries on forming a maritime coalition to safeguard shipping. A functioning Red Sea route is the alternative that makes Suez viable, and without it Europe-bound Gulf crude has to round the Cape.
The Black Sea has its own disruption. Loadings at the export terminal critical to Kazakhstan's crude shipments were suspended again this week following fresh attacks on oil tankers. Kazakhstan routes the bulk of its export volume through that single terminal, which means the outage removes a supply source that has nothing to do with Iran from a market already short 9.4 million barrels per day.
LNG is where the second-order damage sits. The strait carries roughly 93% of Qatar's LNG exports and 96% of the UAE's, together about 19% of world LNG trade. Qatar dispatching its first cargo through the waterway this week is genuinely significant — LNG carriers are the highest-value assets on the water and owners do not risk them on marginal probability assessments.
European gas is the transmission channel. Euro area energy inflation ran 10.0% annually in July against 8.5% in June, and that acceleration is the single largest contributor to eurozone headline HICP rising to 2.9%. It is also the reason the ECB is now expected to hike on September 10 with markets fully pricing a 2.75% deposit rate by early 2027.
Volatility across these routes creates opportunity for flexible trading portfolios while importers face materially higher costs, and the spread between those two positions is where most of the physical market's profit is currently being made.
The compounding risk is that resolution of any single chokepoint does not restore normal flows. Hormuz reopening with the Red Sea blockaded still forces Cape routing for a substantial share of westbound cargoes, which adds two weeks of voyage time and absorbs tanker capacity that would otherwise loosen freight rates.
Freight is the hidden tax in every barrel priced today.
Demand Is Softening Underneath the Supply Story
The consumption side of the equation has quietly deteriorated, and it is the reason the upside keeps failing above $93.
China is the clearest signal. Elevated crude inventories continue to weigh on import demand, easing fears of a near-term supply squeeze. Chinese buyers loaded aggressively when Brent collapsed under $70 in mid-June and are now drawing down rather than bidding at $90. The world's largest importer stepping back removes the marginal buyer from the highest-priced barrels.
OPEC cut its own 2026 global demand growth forecast to 1.17 million barrels per day from 1.38 million, citing the conflict's impact on trade flows. That is a producer group marking down consumption expectations, which producers rarely do without cause.
The IEA balance carries a one million barrel per day demand decline for 2026 against a 3.7 million barrel supply decline, which nets to a tighter market but by considerably less than the supply number alone implies.
The U.S. consumer picture reinforces it. Gasoline above $4 a gallon is a critical threshold for consumer psychology, and June's 9.2% drop in energy goods prices — the largest since August 2022 — has already reversed. Final July consumer sentiment came in at 55.2, up from 49.5 but 11% below a year ago, with survey commentary explicitly noting that continued shipping constraints in the Middle East make sustained confidence improvement difficult.
The personal saving rate fell to 2.7% in June, a nearly four-year low, with spending rising 0.3% against income growth of 0.2%. Households are funding consumption from savings while paying $4 gasoline, which is not a configuration that supports sustained demand growth.
The demand recovery the IEA models — more than eight million barrels per day from May through October — rests entirely on the rapid de-escalation scenario. Renewed conflict that keeps prices near $90 suppresses the consumption that forecast assumes.
That circularity is the market's core problem. High prices from supply disruption destroy the demand that would justify high prices, which means the equilibrium clears lower than the physical shortage suggests once the initial risk premium fades.
What Crude Is Doing to the Rate Path
Oil at $90 Brent is now the dominant input into central bank decisions on both sides of the Atlantic, and both are leaning hawkish because of it.
The Federal Reserve held at 3.50% to 3.75% on July 29 in a 9-3 vote, with Hammack, Kashkari and Logan dissenting in favor of an immediate hike — the most hawkish dissent since September 2016. September hike odds sit near 63%. The 10-year Treasury jumped to 4.731%, its highest since January 2025, and the 30-year hit 5.263%, a 19-year high. Bond yields have climbed through the month as tensions escalated and oil rebounded.
The June inflation data shows exactly how much crude is doing. Headline PCE fell 0.1% month over month with the annual rate easing to 3.7% from 4.1%, driven almost entirely by the 9.2% energy goods decline during the ceasefire window. Core PCE rose 0.1% and held 3.3% year over year. Strip energy volatility and underlying inflation runs around 3%.
That decline reverses in July data. Gasoline is back above $4, crude gained 22% in the month, and the improvement in June will be partially or completely undone by July's upward volatility.
The European transmission is more direct. Euro area energy inflation hit 10.0% in July against 8.5% in June, pushing headline HICP to 2.9% and core to 2.5%. Eurozone Q2 GDP grew 0.4% against a 0.2% forecast. Markets now fully price the ECB deposit rate reaching 2.75% by early 2027 with a September 10 hike at 70% to 79% probability.
Both central banks are being pushed toward tightening by a supply shock neither can control with interest rates. Raising rates does not reopen the Strait of Hormuz. It does slow demand, which is the only lever available, and that lever also slows growth.
The feedback loop into crude runs through the dollar and through demand. Higher U.S. rates strengthen the dollar, which raises the local-currency cost of dollar-denominated crude for every importer outside the U.S. That mechanism has been partly offset by Japan's $52.8 billion intervention Thursday, the largest single-day operation Tokyo has ever executed.
Crude is now setting monetary policy in two currency blocs, and the policy response is making the demand outlook worse.
The Technical Map: $93 Caps and $80 Floors
The price structure has compressed into a defined band that has held every session since mid-July, and the boundaries are precise.
WTI trades $85.41 after Friday's 2.2% advance, with Brent at $90.36. The July range on Brent runs from roughly $84 at the mid-month low to $93.60 at Wednesday's spike high — a $9.60 band that contains every close.
Resistance on Brent starts at $93, the level that rejected Wednesday's surge after a 7.9% single-session move. Above it, the $100 handle is the psychological line that crude held for most of the second quarter and has not touched since June. Clearing $100 with sustained throughput below 30% opens Goldman's $120 restricted-flow scenario.
Support on Brent sits at $89, which Thursday broke and Friday reclaimed. Below it, $84.50 marks the July 16 level and the base of the recent range. A break there targets $80, the bottom of the analyst-consensus band, and below that the mid-June low under $70 becomes the reference — the level that printed when the memorandum was signed.
WTI carries the same structure shifted by the spread. Support at $83.63 from Friday morning, then $80. Resistance at $85.41, then the $89 to $92 zone.
The Brent-WTI spread near $5 is meaningfully tighter than the $12 March average. That compression indicates U.S. inventory pressure has eased relative to international tightness, and a widening spread from here would signal domestic stock builds resuming.
Volatility is the defining feature rather than direction. Single sessions this month have produced 7.9% and 6.6% moves in both directions on headlines alone. Position sizing built for normal crude volatility does not survive this tape, and stop placement inside the $80 to $100 band is close to arbitrary.
The one structural signal worth tracking is the relationship between vessel counts and price. Fourteen transits Wednesday coincided with the selloff. Two tankers attacked Friday coincided with the rally. Throughput is the fundamental, and price is following it with roughly a one-session lag.
Forecast: $80 to $100 Until Throughput Resolves
The base case into August is continued range trade between $84 and $93 Brent, with $80 to $100 as the outer band and direction set by daily Hormuz vessel counts rather than by inventory data or OPEC guidance.
The bear path requires only that transit keeps improving. Commonwealth Bank's threshold is explicit: throughput recovering from 30% to 35% toward 50% to 60% of pre-war levels reasserts oversupply. Global supply already climbed 4.1 million barrels per day in June to 98.8 million, Chinese inventories are elevated and suppressing imports, OPEC cut its own demand growth forecast to 1.17 million barrels daily, and the EIA models Brent at $74 for the third quarter and $65 for 2027 on inventory accumulation. A ceasefire signature repeats June — a $20 collapse inside a week toward $70.
The bull path needs escalation rather than continuation. Friday's tanker attacks under U.S. escort are the template: throughput falling back toward single-digit daily crossings, an incident involving an LNG carrier, or the conflict widening toward Egypt to compromise Suez alongside Hormuz and the Red Sea. That path takes Brent through $93 and opens $100, with Goldman's $120 scenario live if flows stay severely restricted through the quarter. Nine point four million barrels per day remain offline, and that shortfall is real regardless of what the price does.
The structural asymmetry favors the downside over a three-month horizon. Latent supply behind any peace headline caps rallies, while demand destruction at $90 with gasoline above $4 and central banks tightening into the shock erodes the consumption that would justify current pricing. The EIA expects most production back near pre-conflict averages by year-end and the majority of shut-in barrels online by the first quarter of 2027.
Targets: downside $89, then $84.50, then $80 on a confirmed break in Brent, with WTI at $83.63, $80 and $76. Upside $93, then $100 on escalation, with WTI at $89 and $95.
Crude closes July up 22% on Brent and 20% on WTI, the steepest monthly gain since March, with the strait at a third of capacity, two tankers hit under military escort, and the next EIA revision due August 11.